Embedded Analytics
Zing Data’s embedded analytics capability lets you embed charts, tables, and interactive querying capabilities within your app or website with just a few lines of code.
Embed Zing’s powerful data visualization and querying capabilities in your own application.
Note: Embedded analytics is available only on the Pro tier, and must be enabled for your account by the Zing team - it is not enabled by default.
Reach out to the Zing team to see a demo and learn more about pricing.
Capabilities
Zing charts, tables, and interactive querying functionality can be embedded in your app via Zing’s React SDK.
Providing users embedded analytics can:
- Improve user retention
- Help users understand their usage of your product and drive upgrades
- Compare performance to peers (e.g. conversion rate compared to peers in a segment)
- Create new revenue sources (such as offering advanced analytics and reporting functionality as an add-on)
Zing’s React SDK allows developers to get up and running with rich charting, querying, and visualization capabilities without having to maintain complex data architecture, or build visualizations from scratch.
Benefit from Zing’s robust data analysis and querying capabilities and get up and running in minutes:
* Easy visual querying
* Natural language based querying
* SQL typehead for power users
* Flexible graph formatting (including specifying colors, date formatting, sorting, and more)
* Export to PNG or CSV
When you’re setting up embedded analytics you can control the features you want to show up on the embeds.
For example, if you want to disallow exporting as a PNG, you can simply turn off that capability in the admin panel and no user will have that option from the embed.
Update frequency
Choose refresh frequency to optimize data freshness while minimizing database load.
Update frequency options include:
- Full-live
- Every minute
- Every 5 minutes
- Every 15 minutes
- Every 30 minutes
- Every hour
Authentication and data visibility
- Inherit user access controls from your app if you’d like to customize end-user experiences based on user id, role, entitlement, or other attributes
- Limit chart visibility to verified sessions for improved security
- Apply chart-level controls
Getting Started
Zing’s embeds also support secure authentication using a Single Sign On provider, session-based authentication, and row level security. Speak to our team to learn more.
2 - Integration
Install the SDK and create the signed URL required for embedding.
In order to embed a chart, your application’s source code needs to be updated based on the below steps.
Server-side (backend)
Step 1 - Create a Secure Session with Zing
A secure session needs to be created with Zing in order to start embedding charts/dashboards. This should be done by calling the API:
POST https://console.getzingdata.com/api/v1/embed-sessions
An example of how to create a Zing session using NodeJS:
const url = 'https://console.getzingdata.com/api/v1/embed-sessions';

const payload = {
 userData: {
  email: loggedInUserEmail,
 },
};

const options = {
 headers: {
  'Content-Type': 'application/json',
  'x-zingdata-api': ZING_API_KEY,
 },
};

const response = await axios.post(url, payload, options);
const oneTimeSessionToken = response.data.token;
This token created by the backend will need to be passed to the frontend for your end user to be able to view an embedded chart. You can expose an API from your backend for the frontend to fetch this token for each chart that you embed. A session token needs to be created for every chart you want to embed.
Step 2 - Generate Signed Embed URL
You can create signed one-time-use URLs for graphs/dashboards, which are more secure because they can’t be reused and are a way to ensure your server has validated each request. In order to generate the signed URL, add a new API endpoint in your server code.
A NodeJS example for this API endpoint is given below.
const crypto = require('crypto');
const uuid = require('uuid');
app.post('/api/generate-url', (req, res) => {
const { embedId, where } = req.body;
const baseUrl = 'https://console.getzingdata.com/embeds';
let parameters = `?nonce=${uuid.v4()}`;
parameters += `×tamp=${Math.floor(new Date().getTime() / 1000)}`;
parameters += `&embedId=${embedId}`;
if (where) {
parameters += `&where=${where}`;
}
const urlWithParameters = baseUrl + parameters;
const signature = crypto
.createHmac('sha256', Buffer.from(process.env.ZING_EMBED_SECRET, 'utf8'))
.update(Buffer.from(urlWithParameters, 'utf8'))
.digest('hex');
const finalUrl = `${urlWithParameters}&signature=${signature}`;
res.json({ url: finalUrl });
});
In here, the ZING_EMBED_SECRET is read from an environment variable.
Now let’s move on to the frontend updates.
Client-side (frontend)
-
Contact the Zing team and obtain the Zing key (REACT_APP_ZING_KEY).
-
Install the Zing SDK on your application’s front-end.
From NPM:
npm install --save @zingdata/zingdata-react
- Import the Zing CSS file in your main HTML or CSS file.
import "@zingdata/zingdata-react/dist/zing.css";
-
Call the API endpoint that you defined in your backend to fetch the Zing session token for each chart (E.g: zingToken).
-
Call the API endpoint that you defined in your backend to generate the signed embed URL for each chart.
- Payload should contain the embedId of the question and the where property (If dynamic filtering is required - where property is optional. More information about the where condition is given at the end of this guide.)
- This should be done for each embedded chart/dashboard in your application, as each chart/dashboard will have an immutable URL.
const fetchUrl = async (embedId, where) => {
  const result = await axios.post(
   '/api/generate-url',
   {
    embedId: embedId,
    where: where,
   },
   {
    headers: {
     'Content-Type': 'application/json',
    },
   }
  );

  return result?.data?.url;
};

// Call the above function to fetch the generated URL
const signedUrl = await fetchUrl(embedId, where);
- Embed the chart using the SDK
Include the below code on the page where the chart/dashboard needs to be rendered.
import { ZingDataEmbed } from '@zingdata/zingdata-react';

<ZingDataEmbed
  embedUrl={signedUrl}
  apiKey={process.env.REACT_APP_ZING_API_KEY}
  token={zingToken}
  zingKey={process.env.REACT_APP_ZING_KEY}
  className="mt-5" // optional
/>
- An optional className parameter can be passed to ZingDataEmbed if you need any custom styles to be applied to the container.
- embedUrl, token and apiKey properties are required.
- A question can be filtered from your application’s source code by adding a chart property: where. For instance, you could filter based on city, company, or any other field in your datasource to customize the chart to a specific context. The example below shows filtering based on the city.
where={JSON.stringify({
  queryConstruct: {
    where: [{
      column: ['Prospect City'],
      condition: '!=',
      values: 'Boston'
    }]
  }
})}
This condition needs to be passed to the fetchUrl function in step 3 to be included in the signed URL.
Multiple conditions can be added to the where property as follows.
where={JSON.stringify({
  queryConstruct: {
    where: [
      {
        column: ['Prospect City'],
        condition: '!=',
        values: 'Boston'
      },
      {
        column: ['Year'],
        condition: '=',
        values: '2023'
      },
    ]
  }
})}
The where property can have the following conditions.
- Equals (=) only returns results which match the value you input (e.g. “City = ‘New York’” will return results only where the city field for that row equals New York).
- Does Not Equal (!=) returns results which do not match the value you input (e.g. “City != ‘New York’” would return all cities except New York).
- Greater than (>) returns results which are greater than the value you input.
- Greater than or equal (>=) returns results which are greater than or equal to the value you input.
- Less than (<) returns results which are less than the value you input.
- Less than or equal (<=) returns results which are less than or equal to the value you input.
- Between (between) returns results which are between the two values you specify. For date fields this will be two dates.
- Includes (includes) returns results which include part or all of the value you input. For instance “City includes ‘San’” would return “San Francisco” and “San Diego” if those values are present in the data.
- Excludes (excludes) returns results which do not include any of the value you input. For instance “City excludes ‘San’” would return all cities which do not contain “San” in their name so “New York” and “Boston” would be part of the result set, but “San Diego” and “San Francisco” would not.
where conditions should not be defined for user specific data.
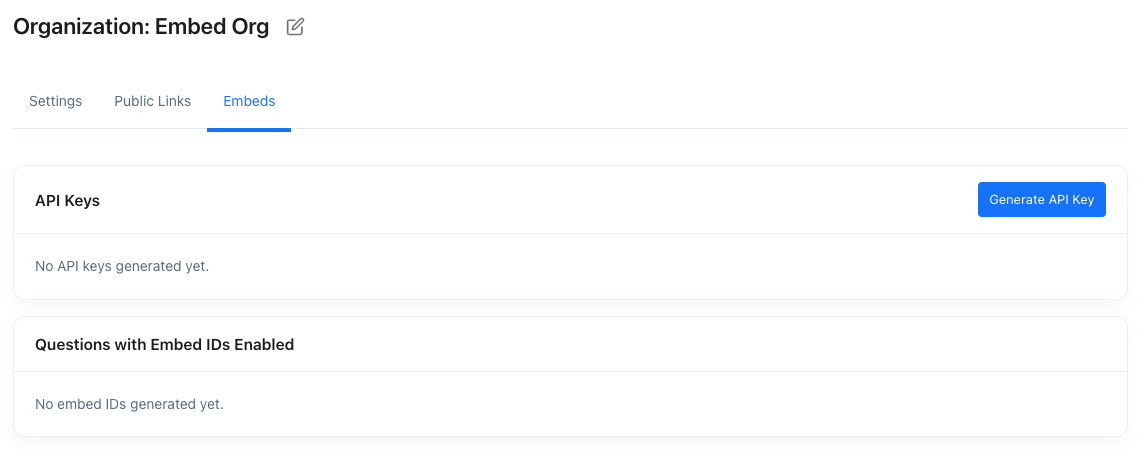
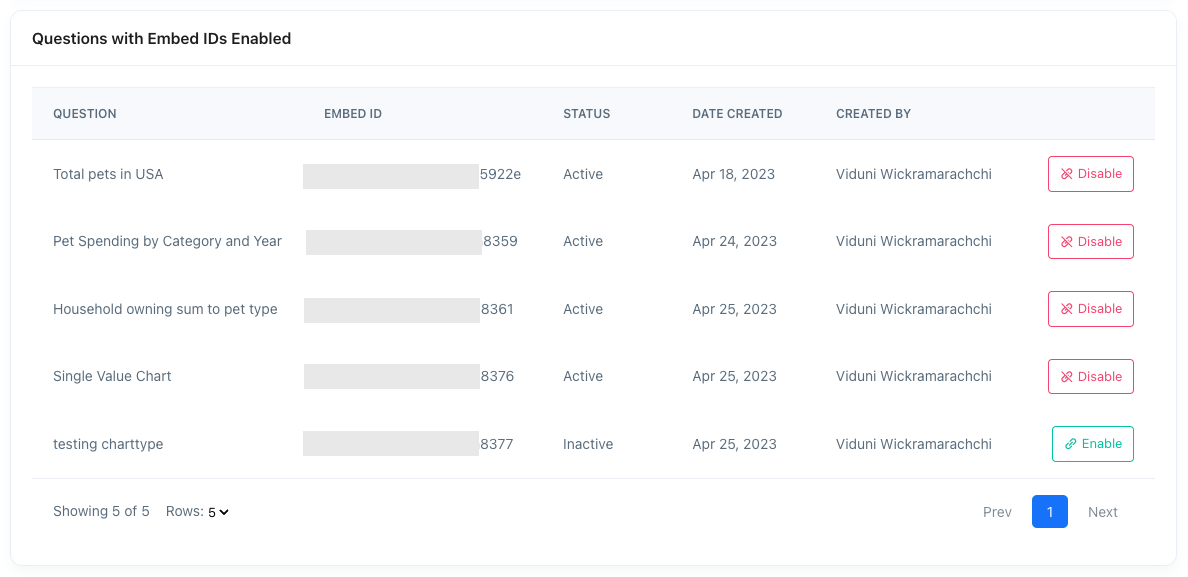
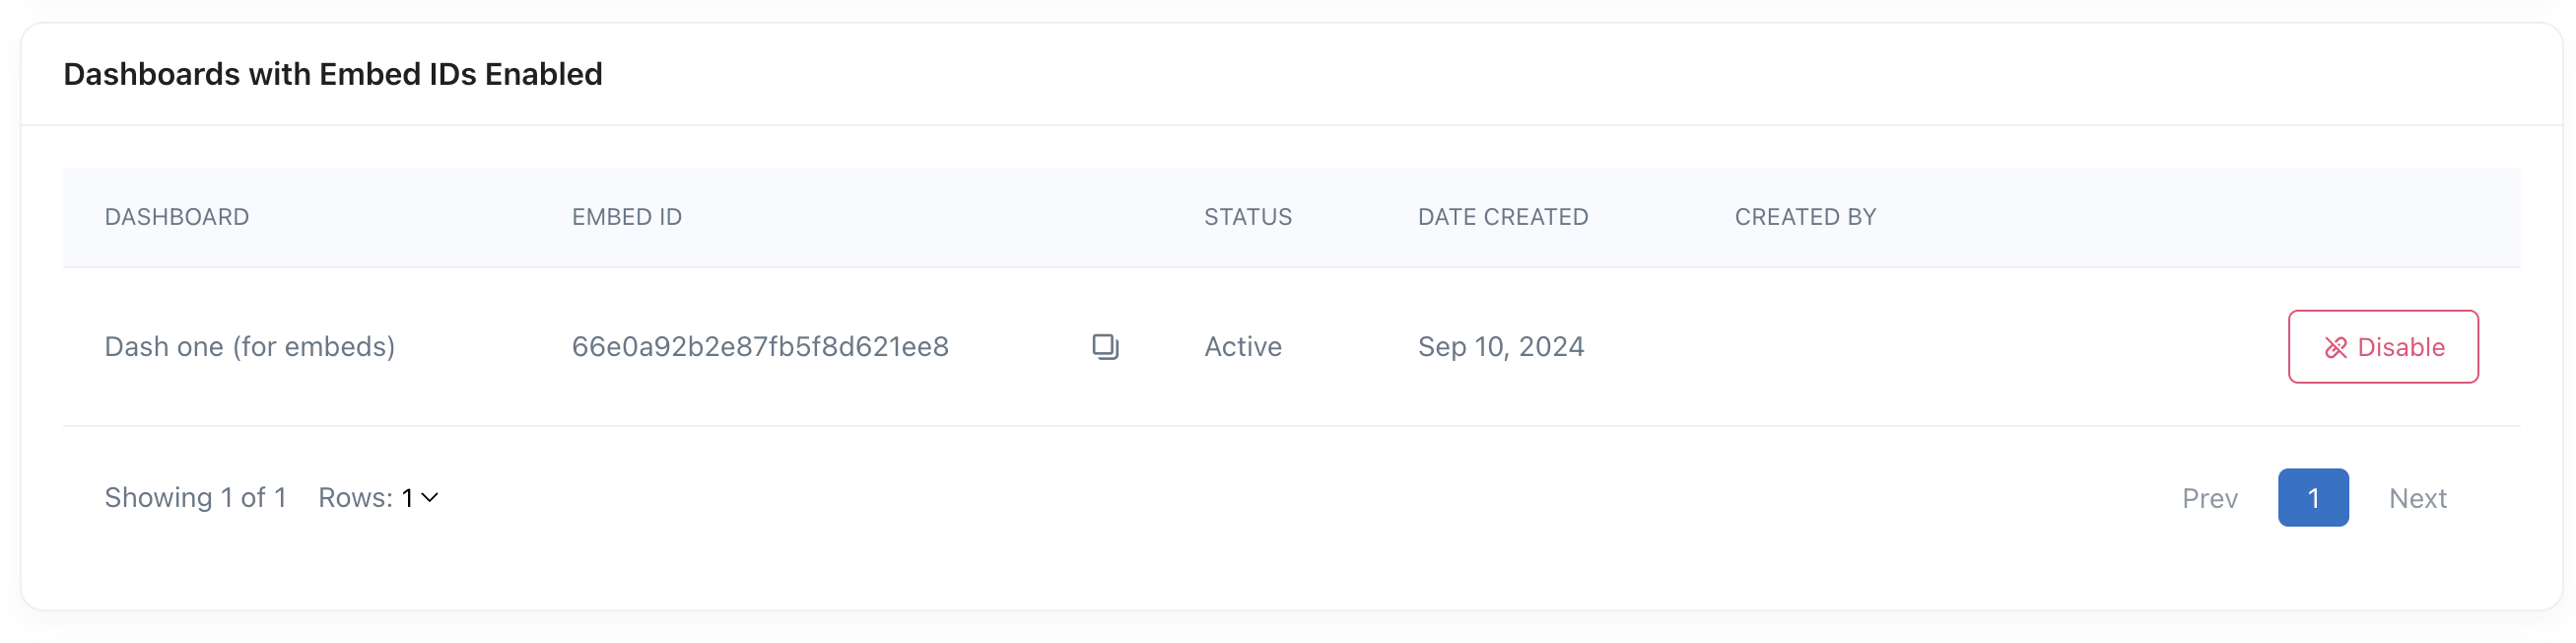
- Multiple charts/tables/dashboards can be embedded by using an embed ID for each chart/table/dashboard.
3 - Row Level Security for Embedded Charts
Filter your chart based on who views it.
Row Level Security allows you to control access to data in a database by row, so that a logged in user can only view the data they are authorized for. You will be able to control “Who sees what in the chart?” by including a RLS filter to the question.
Steps
- Ask a question via the Zing Web App or Mobile App with a Row Level Security filter. Refer this guide for more information on how to create a question with an RLS filter.
- Embed the chart by following the steps under the Setup and Preparation and the Integration sections.
- Send the logged in user’s data when creating a session with Zing via your backend code. The information sent in the payload will be used for RLS filtering.
An example of how to create a session token in NodeJS is shown below.
const url = 'https://console.getzingdata.com/api/v1/embed-sessions';

const payload = {
 userData: {
  email: loggedInUserEmail,
  role: loggedInUserRole,
  username: loggedInUserUsername,
  name: loggedInUserName,
 },
};

const options = {
 headers: {
  'Content-Type': 'application/json',
  'x-zingdata-api': ZING_API_KEY,
 },
};

const response = await axios.post(url, payload, options);
const oneTimeSessionToken = response.data.token;
How to use this one-time token is explained in the Integration steps.
That’s it. 🎉
The resulting chart for a query with RLS filtering will have different results based on the logged in user in your application. By excluding certain data from the dataset based on the logged in user would reduce access of data by users who are unauthorized to view them.