Asking Questions & Querying
Asking Questions
From the Zing App you’ll see three sections:
- Dashboards are collections of questions laid out on a canvas. Any question can be added to a dashboard.
- Questions displays questions you save or that other people in your organization have shared with you. Tap a question to view the graph or table of results, or to clone an existing question to make it your own. You can also comment on questions to participate in a conversation, and anybody who is part of that conversation will be notified by email of your comment.
- Tables displays all visible tables and views of any of your database(s). If you have multiple data sources configured in Zing, you’ll see all visible tables and views from all data sources you have set up or which have been shared with you. If you only made certain tables available to Zing in your connection settings, only the tables / views you ’turned on’ will show here.
Ask questions from a table by tapping on the table name, then dragging fields to the x, y, or filter areas of the SwiftQuery canvas.
Ask questions from a dashboard by tapping on a question card in a dashboard then clicking on an individual data point to deep dive or see values, or click on the three dots in the upper right to duplicate a question and modify it.
You can also create queries using natural language by just tapping the search bar, and selecting the a data source from the drop-down.
Organizing with Question Categories
As your organization creates more questions, keeping them organized is key to helping team members find the insights they need. With Categories, you can group related questions by project, department, or topic.
Creating a New Category
You can create a category at any time from the ‘Questions’ list.
- From the Questions tab on the home screen, tap the three-dot menu (…) next to any question.
- Select Assign category from the dropdown menu.
- If this is your first one, you will see a prompt to Create First Category. Otherwise, you can select an existing category or tap Create New Category.
- In the creation screen, provide the following details:
- Category Name: A descriptive name for the group (e.g., “Q4 Marketing Funnel,” “Sales Team KPIs”).
- Organization: Select the organization this category belongs to.
- Icon & Color: Choose a unique icon and color for easy visual identification.
- Tap Create Category to save it.
Assigning Questions to a Category
Once a category is created, you can assign any question to it.
- Tap the three-dot menu (…) next to the question you wish to categorize.
- Select Assign category.
- Choose the desired category from the list. The question will now appear grouped under that category name in your Questions list.
Managing Categories
- Unassigning: To remove a question from a category, follow the assignment steps and select ‘Uncategorized’.
- Editing/Deleting: Category management (editing names, icons, or deleting) is handled by organization administrators in the account settings.
Selecting Fields
- Drag a field from the filter section (the top of the SwiftQuery canvas)
- Set the filter comparison values and filter groups as desired.
Aggregations and Filters
NEW: Filters now support up to 6 layers of nesting within filter groups. This feature is compatible with both natural language and visual query inputs.
Note that not all fields will show all of the aggregations mentioned above because Zing only shows the aggregations which are relevant – for instance a string field won’t show “greater than” or “less than” as an option because those are only relevant for dates and numeric fields.
If you are using the visual query editor, up to 50 data points will be shown with one group-by selected, and up to 1,000 data points will be shown with two group-bys selected. This will be indicated at the top of the screen as ‘partial results’ and if you’d like you can modify your question or tap ‘full results’.
Dates and Date Operators
If your database has a date, time, or timestamp field, Zing will show date-specific functionality for filtering and will give you options for grouping by different time scales.
Timestamp fields will by default be shown by day. This means if you GROUP BY a timestamp field, Zing will consider all the timestamps in a given day to be part of that day. You can specify the time scale you’d like – with options for second, minute, hour, day, week, month, and year.
To choose the time scale for a given field, first drag the time field to the SwiftQuery canvas, then tap the field for date aggregation options:
To limit the date range of your query you can simply select the date range you want on the pop-up calendar using the following conditions for dates:
- Before lets you specify a date and time with results limited to records before that date/time.
- After lets you specify a date and time with results limited to records after that date/time.
- Between lets you tap between two dates on a calendar to limit the results to that date range
- Not Between lets you tap between two dates on a calendar to exclude results from that time range. This can be useful if, for instance, data was incorrect for a given time range.
- Week to date / Month to date / Quarter to date / Year to date display the dates up to today for the period you’ve specified and that date is always evaluated at run-time, so if you were to run this next year you’d see data relevant for next year.
- Current week / current month / current quarter / current year display all the dates within the current period referenced.
If the date/time options outlined above are not showing up for a given field, that field is likely not classified as a date, time, or timestamp.
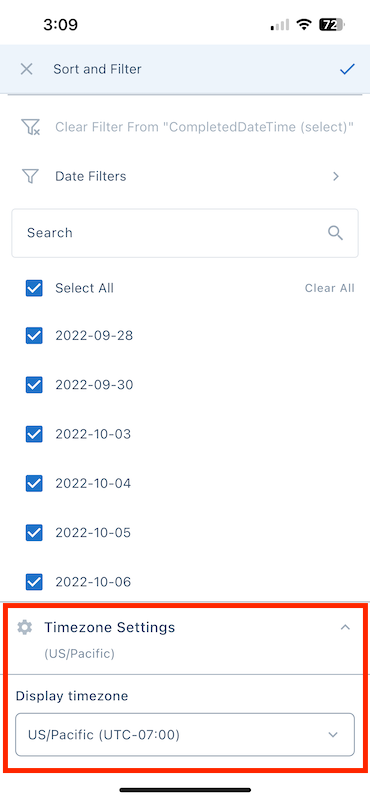
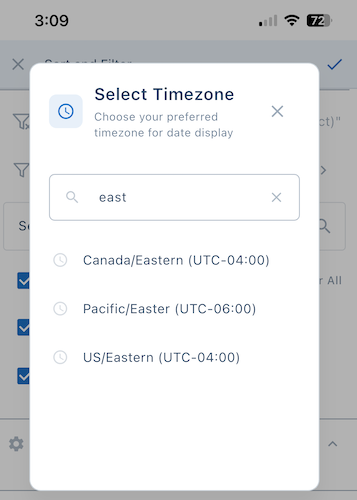
Time Zones
If you have fields that contain a time zone, Zing supports showing any time filters or comparisons for any time zone you wish, and defaults to the time zone you are accessing the question from (though this is changeable from a drop-down) . This lets you see - for instance - the operational logs in a specific time range based on where you are.
Of course, many situations don’t require using a time zone attribute on a date - for example simple day-level rollups are common with DATE fields. You can also have TIMESTAMP or DATETIME fields without time zones (in which case Zing just does everything in a no-timezone space).
But when you have a time zone indicator on your fields, operating in UTC versus a relevant time zone leads to different results.
TIMESTAMPTZ (in PostgreSQL) and TIMESTAMP (in mySQL), and DATETIMEOFFSET (SQL Server) are timezone aware and will now show a time zone selector in Zing.
Time zone selection is available when you apply a filter on a timestamp / date time field from filter settings, or from the filter at the top of a data table.
Calculated Fields
Create calculated fields by tapping ‘Calculated Field’ below the field names on the question screen.
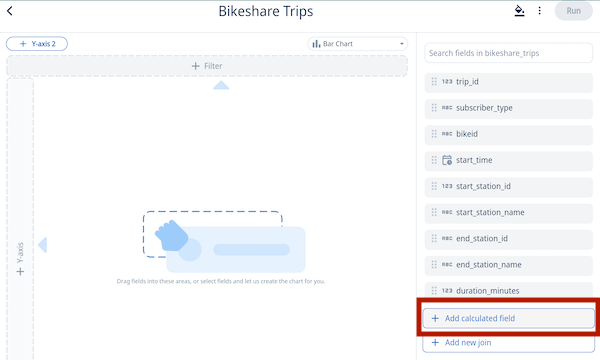
You’ll then name the field (avoiding the use of spaces), and the calculation. As you type, a autocomplete typeahead will display aggregations and fields.
You can mix and match fields and aggregations in a calculated field. For example, use calculated fields to compute a weighted average, a percentage, or CASE logic.
A question can have multiple calculated fields. To remove a calculated field, tap the ‘X’ on that field, and to edit it, tap ’edit’.
Search
From the main screen, you can search any table names using the search bar at the top of the app.
Once you’ve tapped on a table, you’ll see all fields in that database. You can search across all fields using the search bar at the top of the screen.
SwiftQuery Interactive Question Builder
Once you’ve tapped on a table, tap the three dot overflow menu in the top right and select ‘drag and top editor’. Then simply hold and drag field names (shown in the bottom sheet) to the x-axis, y-axis, filter, or dimension drop targets.
The chart will update as you make changes and drag new fields onto the chart.
Natural language querying (text-to-question)
From iOS, Android, and the Web simply:
- Create a Zing Data account
- Add a data source from iOS, Android or web versions of Zing
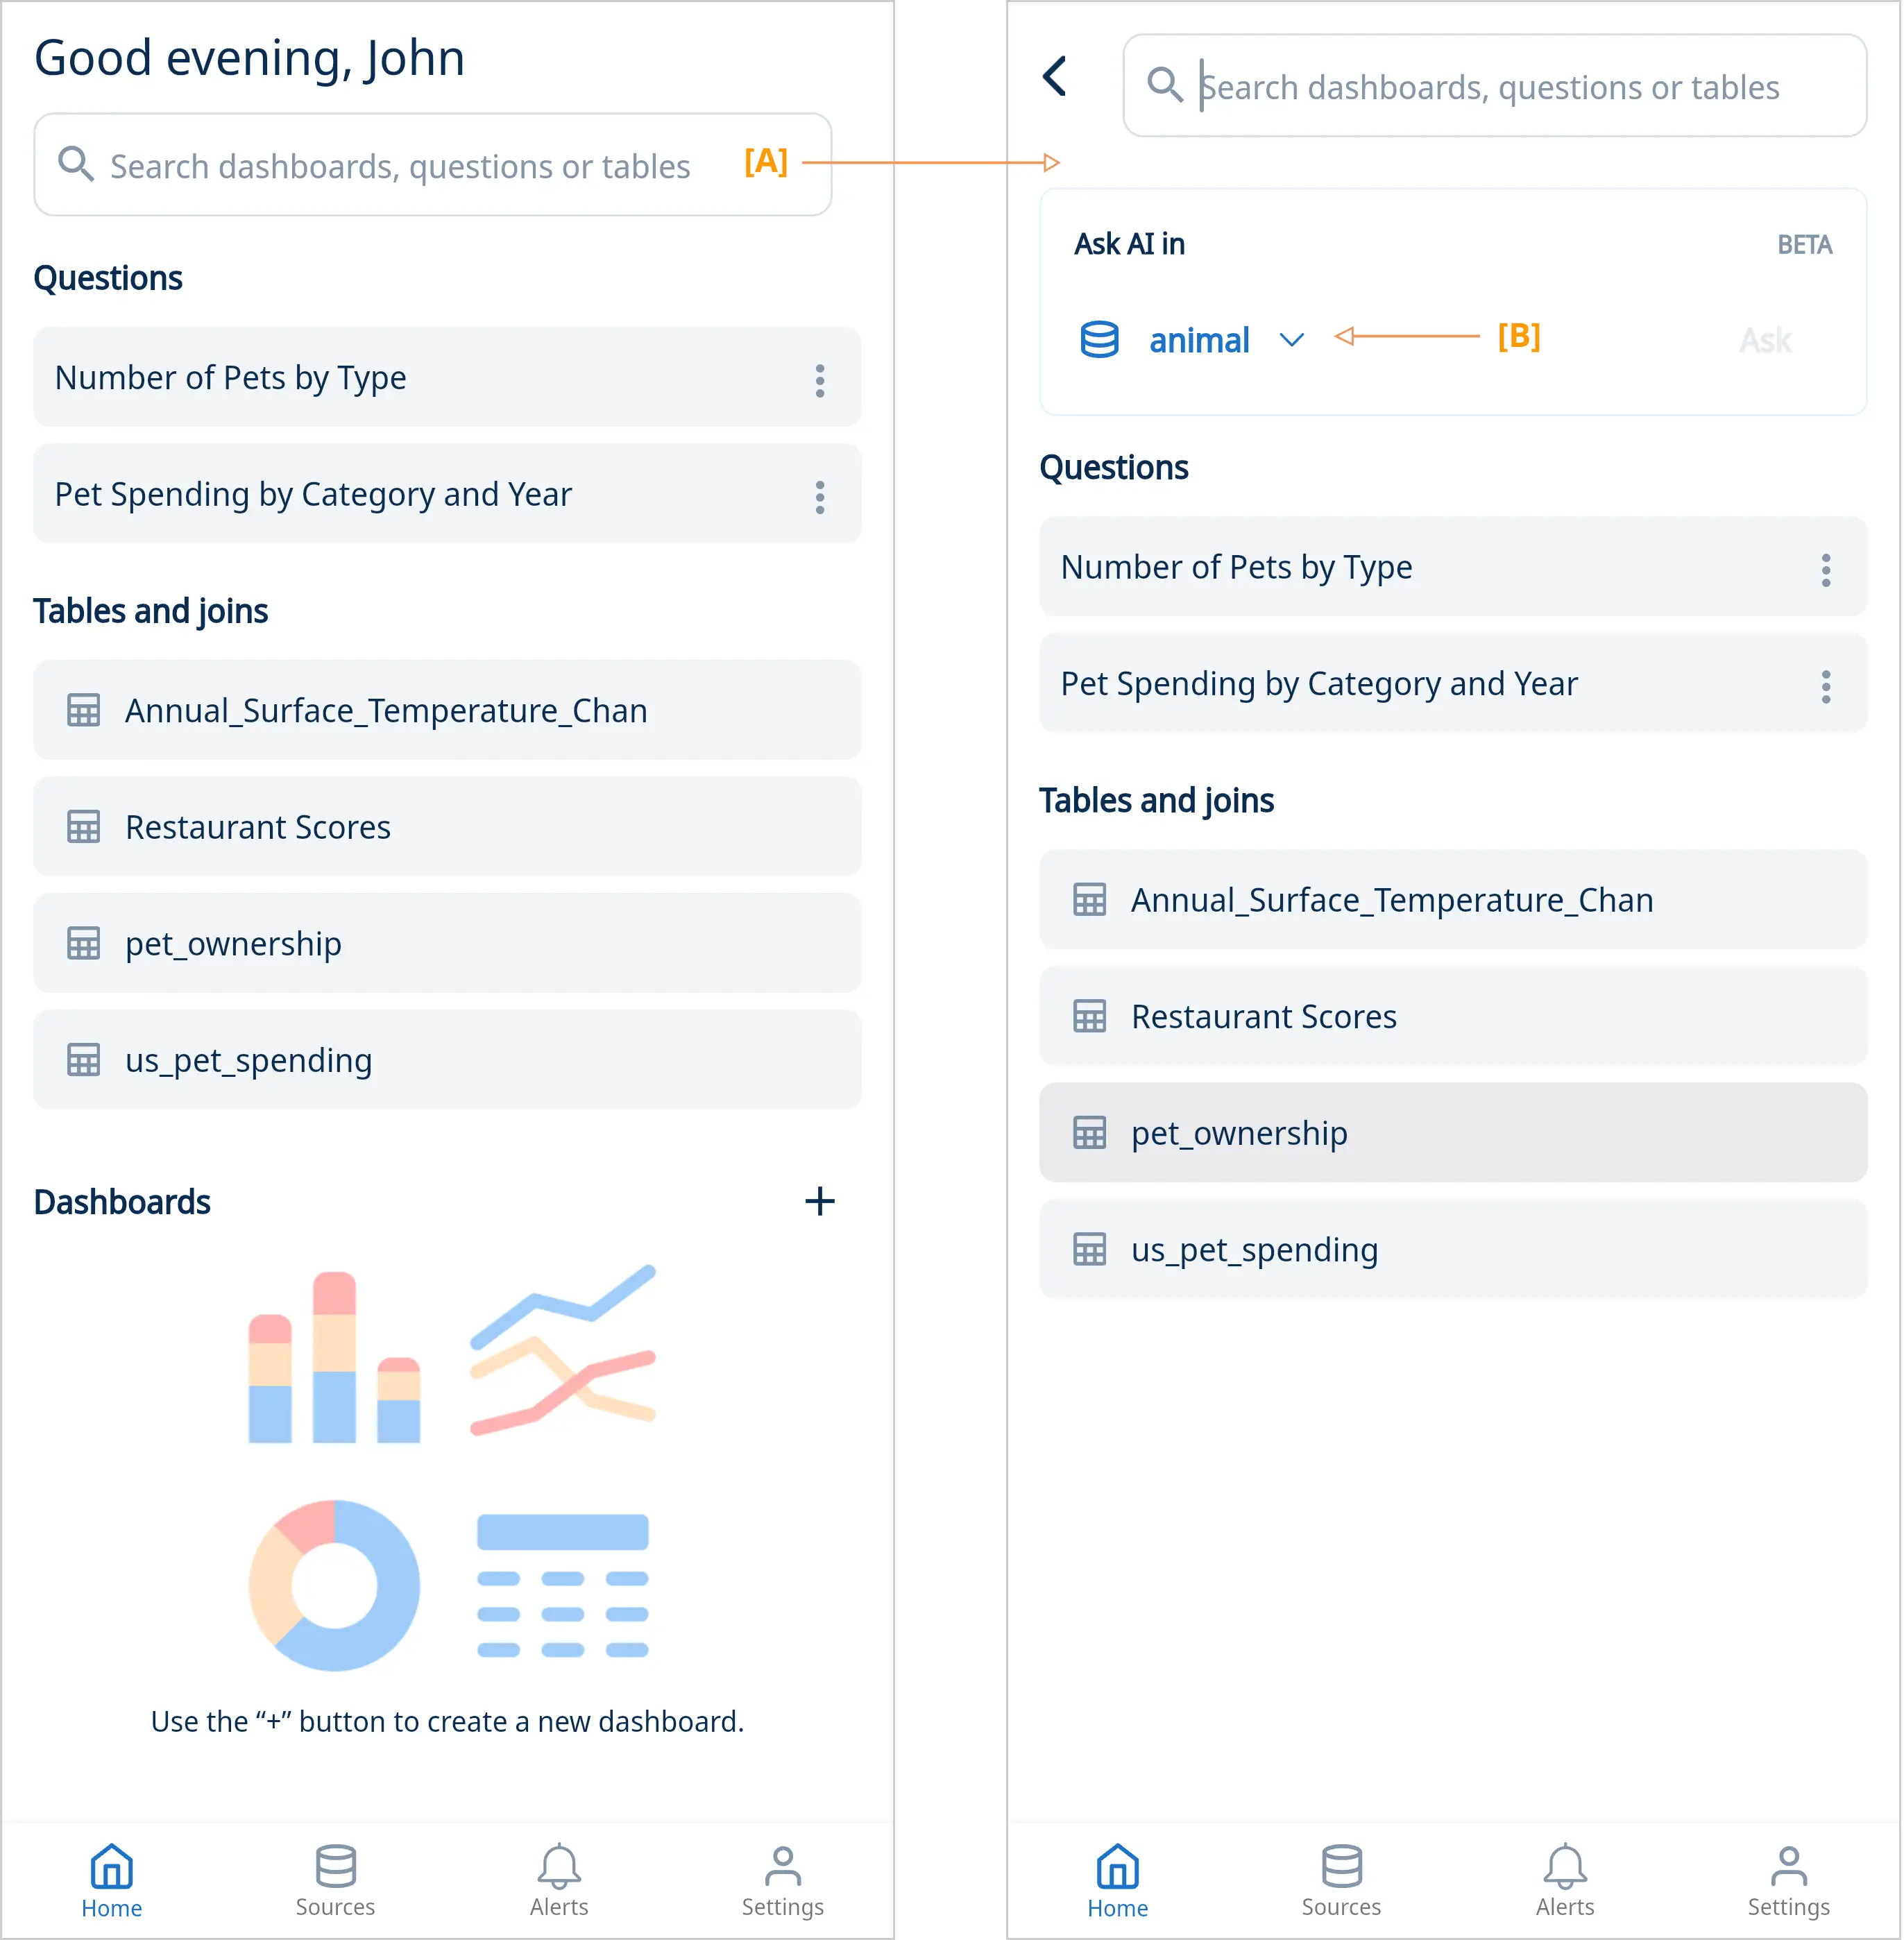
- On the home screen tap the search box [A] to get started. Select the data source you want to ask questions in [B] and enter your query. Tap “Ask” or “Done” on your mobile keyboard to submit your question.
- Your question will run using a large language model trained on english to query contruction against your data source.
- You’ll see a visualization or table of your question. If AI can’t understand your question, you’ll want to ask it in a different way or use the visual query editor, or custom SQL editor. Questions can join data from across tables within a data source but joins across multiple data sources are not supported.
- From here, you can save down chart images as PNGs, export query results as CSVs, mention or invite colleagues, or set up real-time push notifications and emails so you’re alerted when data changes or hits a threshold.
Helper text
Helper text guides your team members in knowing what type of questions they can ask about a data set.
To add helper text:
- Go to ‘Data Sources’ and click on ‘Settings’.
- Tap on the ‘Helper Text’ tab and select ‘Add New Helper Text’.
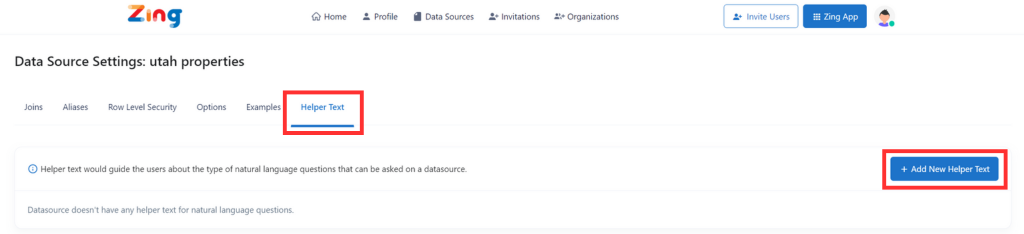
- Type in a question and save it. You can add as many sample questions as you’d like! This will help your team members know what kind of questions they can ask about the data set.
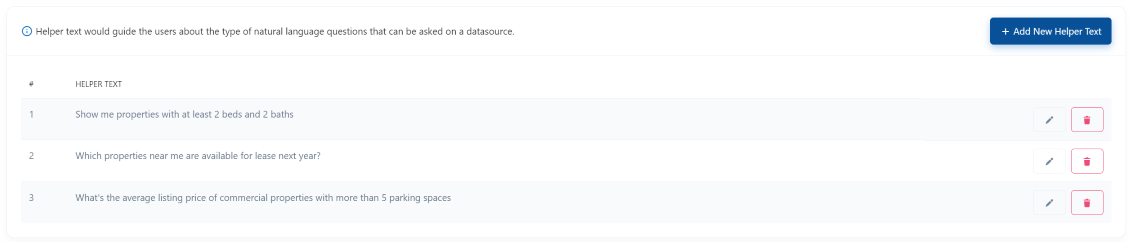
The helper text you’ve added will loop through the search bar as you’re about to key in a question.
Value typeahead
Value typeahead disambiguates values, fields and tables, enabling you to complete your question in a straightforward manner.
For instance, if you’re trying to find customer addresses, do you want the billing address or shipping address? Zing’s typeahead will prompt you with these suggestions, letting you decide the exact value you need.
Here’s how it works:
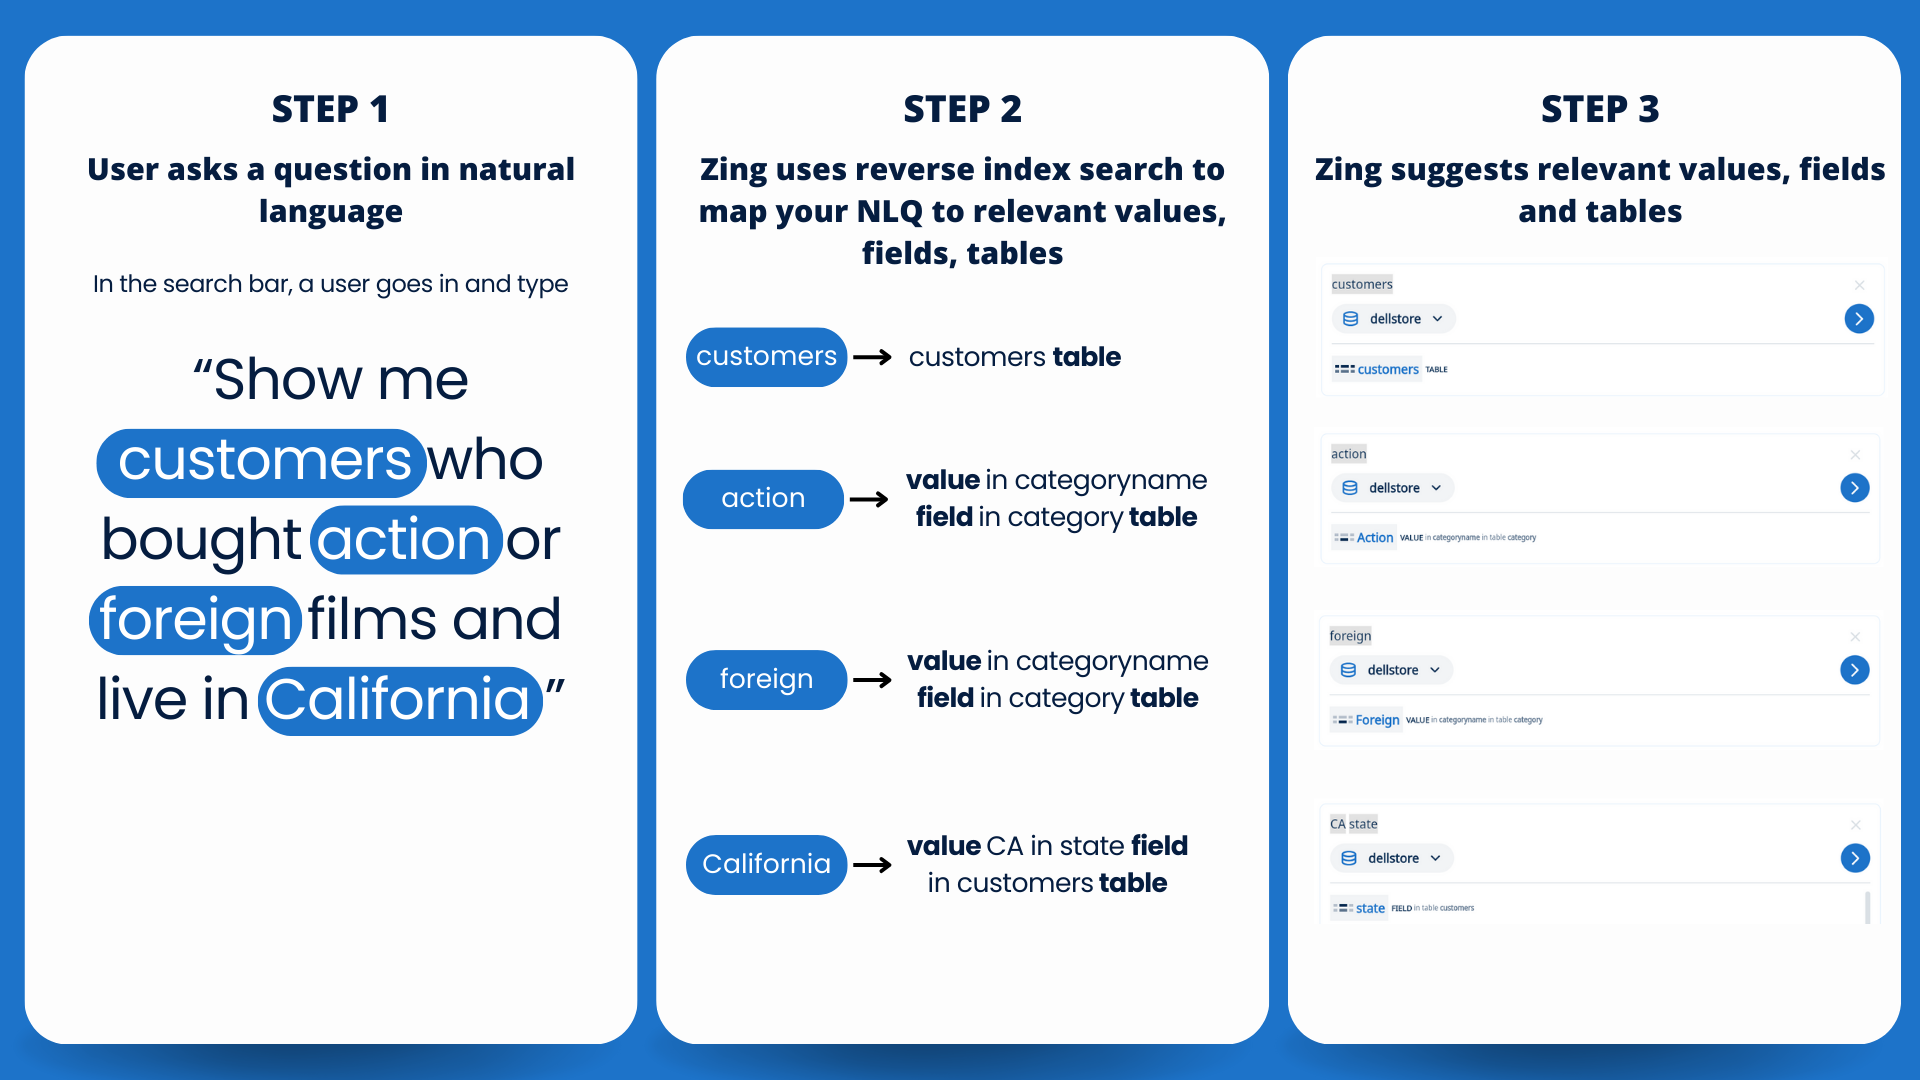
As you’re typing a question, Zing automatically suggests relevant values, fields and tables by doing a reverse index search.
We could ask, “Show me customers who bought action or foreign films and live in California.”
As you’re typing, Zing shows you:
- ‘action’ is a value in the field ‘categoryname’ in the table ‘category’
- ‘foreign’ is a value in the field ‘categoryname’ in the table ‘category’
- ‘CA’ is a value in the field ‘state’ in the table ‘customers’
And if you decide to switch categories from ‘action’ to ‘horror’ mid-query, Zing will update its suggestions, now showing you:
- ‘horror’ is a value in the field ‘categoryname’ in the table ‘category’
This helps you select the exact value you need without recalling its location. It helps avoid confusion and ensures you’re querying the right data, even in large datasets with overlapping values.
Note: value typeahead is only available on Zing’s Enterprise plan.
Notes specific to charts created from the visual question builder
If you run a question that returns a lot of results, sometimes Zing can’t display all the results (nobody wants a billion of individual rows sent to their phone). A things happen behind the scenes for questions asked using the visual question builder:
- When the number of data points on the X-axis is greater than 50, Zing samples results:
- For chronological data, the most recent 50 data points are shown
- For everything else, the top 50 data points with the highest chart values are shown
- When 2 GROUP BY columns are selected, Zing limits the number of categories shown for one of the GROUP BY columns:
- If one of the GROUP BY columns is a date/time type, we use it for the X-axis and limit the values for the other GROUP BY column. These values are currently limited to the top 20 with highest Y-axis values for each X-axis value.
- A maximum of 1,000 data points is shown if two GROUP BYs are specified.
To view all results, you can tap the drop-down on the top left and select ‘Full Results’ to see a data table view of the full results set.
Custom SQL
You can also use the Zing Custom SQL editor for more sophisticated use cases. A helpful typeahead that auto-completes popular aggregations like (SUM, COUNT, MIN, MAX, GROUP BY, etc.), and field names.
Using the custom SQL creation mode, you can also join across tables from the same data source as well.
To access the custom SQL typeahead:
- Select a table from the home screen
- Tap the three dots in the upper left and then ‘Write custom SQL’
- Write your query and then tap ‘Run’ Note: If the administrator of your organization’s account has disabled custom SQL, you won’t see this option.
You can control which fields from your custom SQL query are graphed on the X-axis or Y-axis by using a special aliasing in Zing.
- To ensure a field is graphed on the X-axis, add the “_x1” alias to your field in custom SQL. If you also specify “_x2” that _x2 field will be used as the ‘cut’ or ‘split’ for the x-axis field.
- To ensure a field is graphed on the Y-axis, add the “_y1”, “_y2”, “y3”, alias to your field name in custom SQL. The underscore and axis designation in your alias won’t show up in your graph titles, but are used to indicate which axis you want a field graphed on.
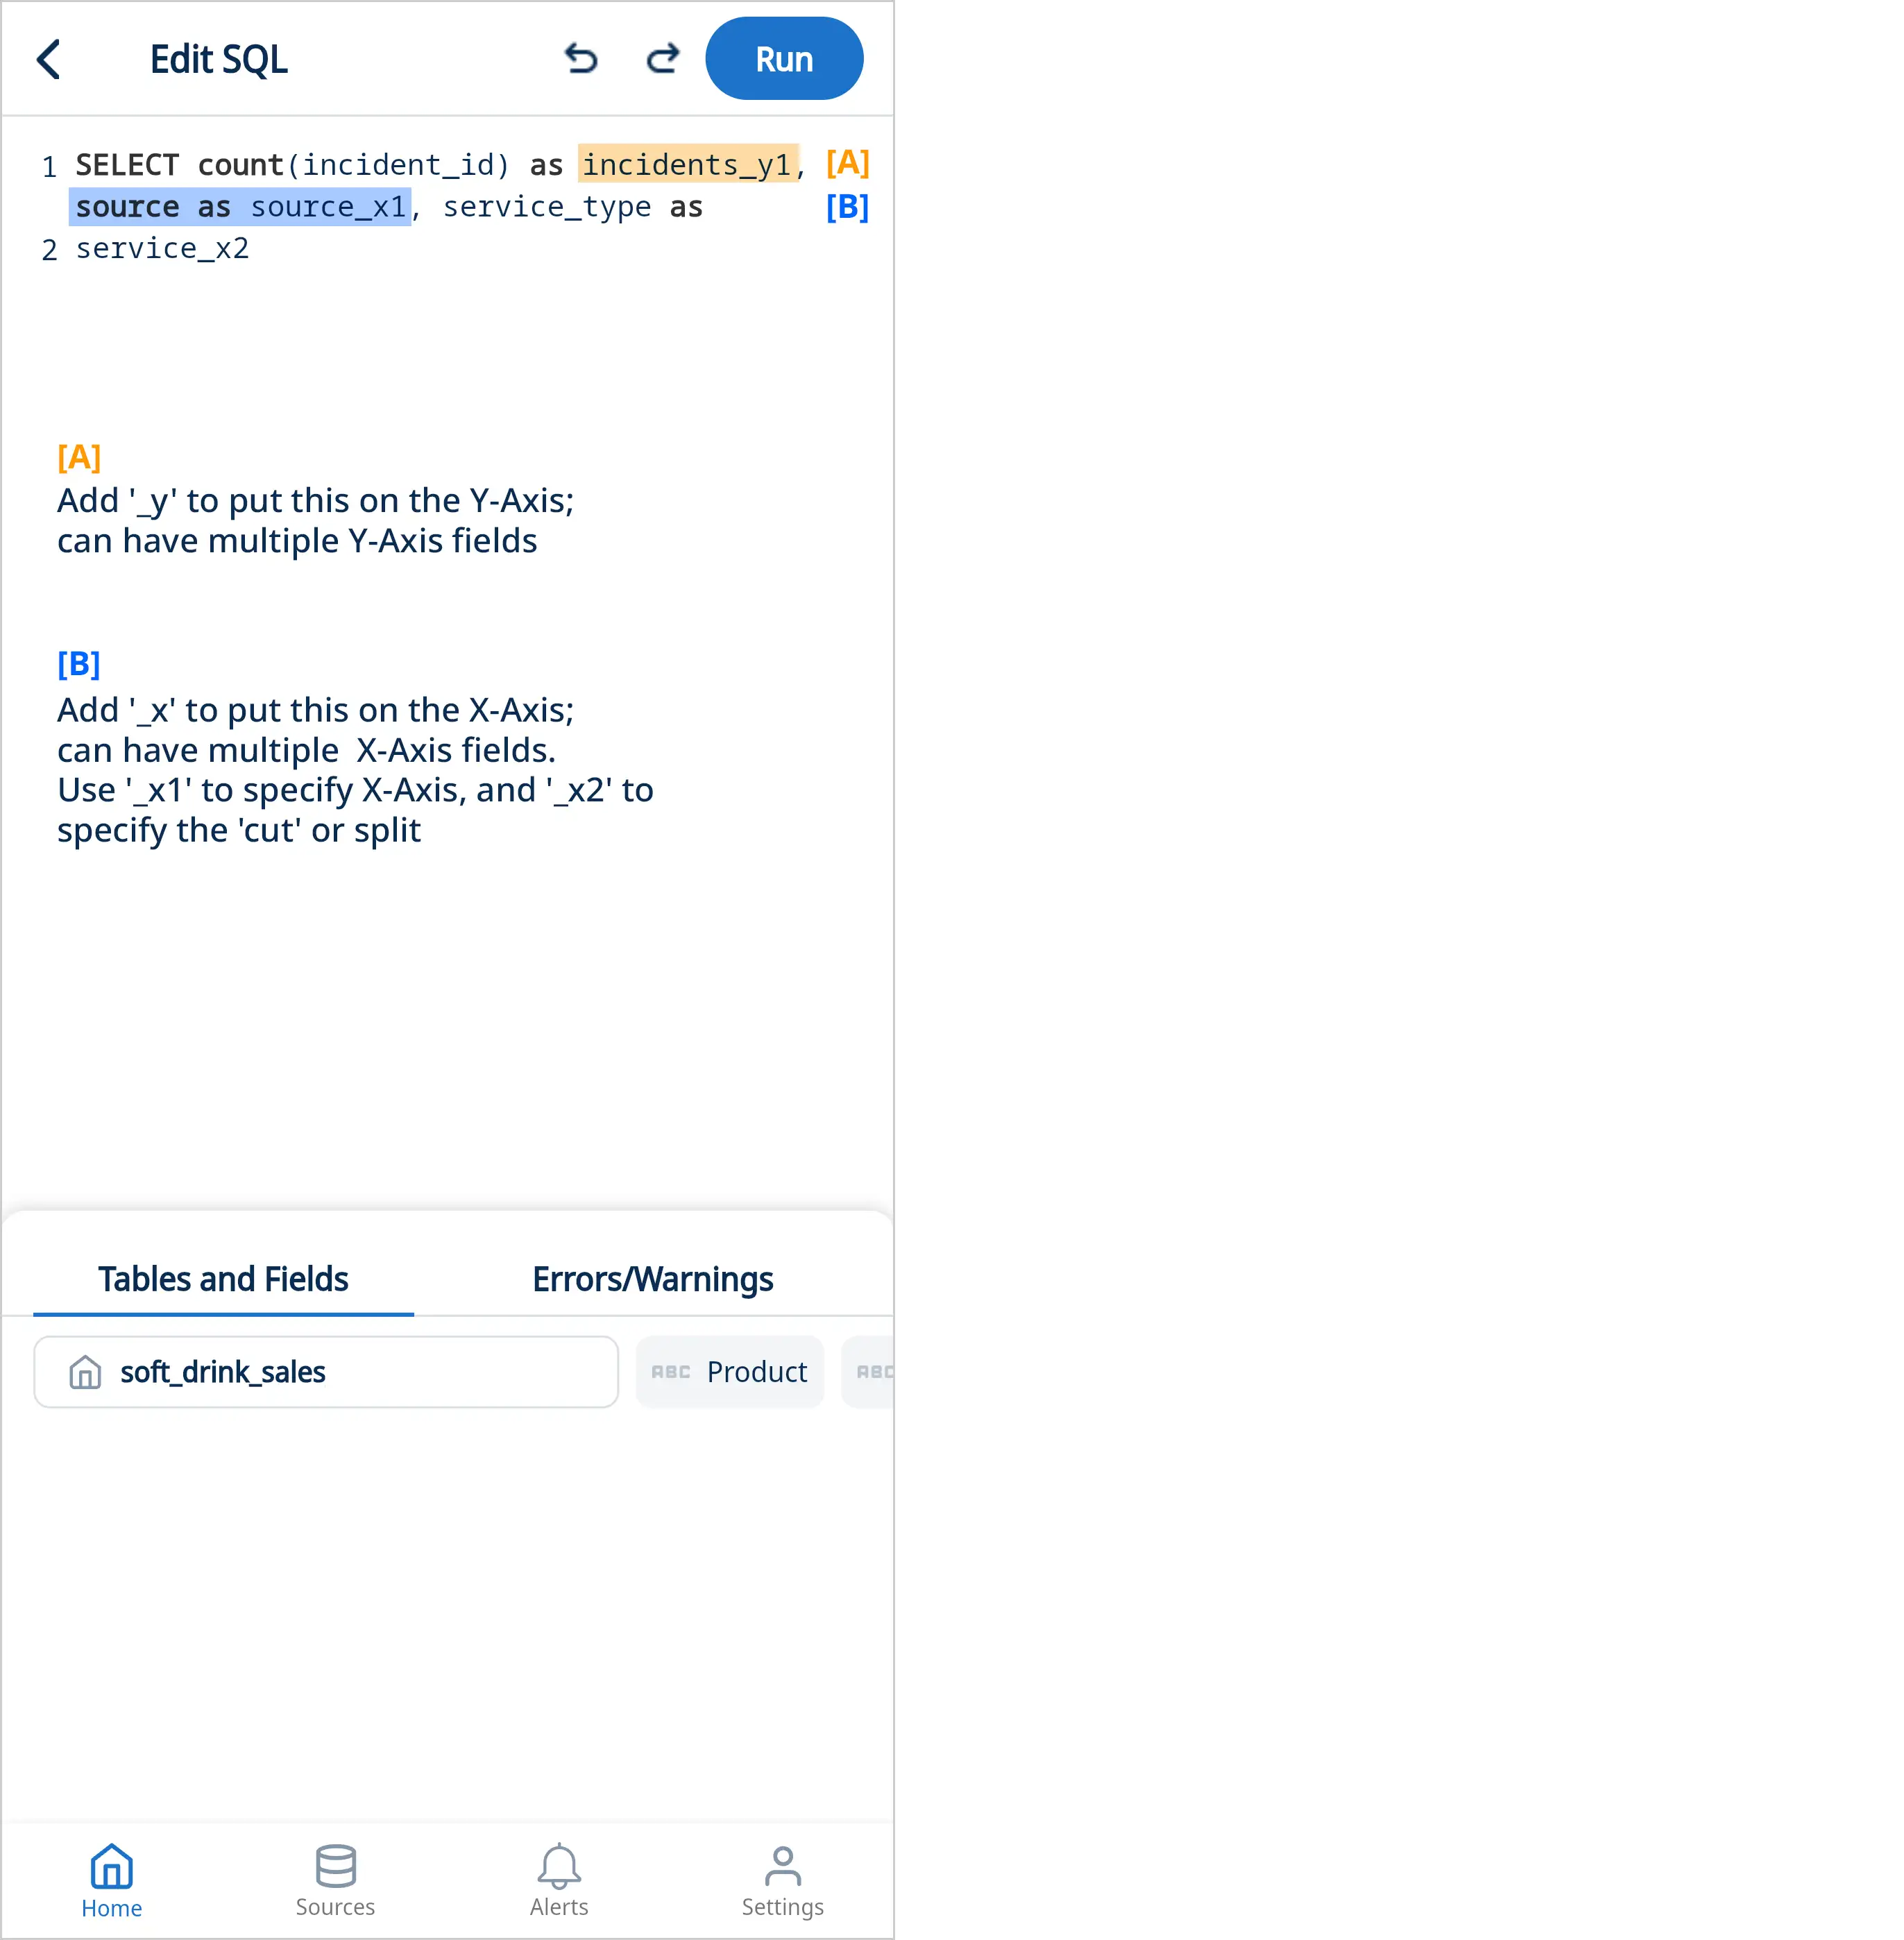
For example, changing the “_x1” and “_x2” fields in the example below swaps which field is on the x-axis and which field is used as the dimension to split by.
Note that for custom SQL:
- The SQL typeahead shows fields and popular aggregations. It does not show all aggregations your underlying data source may support, but you can still use those in the custom SQL mode. For instance if you want to extract a JSON value and your data source is Google BigQuery, you’d use JSON_EXTRACT but if your dats source is Snowflake, you’d use JSON_EXTRACT_PATH.
- Only ‘select’ statements are supported. Insert / Update / Create / Drop are not.
- For Google BigQuery data sources, tables are referenced as ‘project_id.schema.tablename’ – for instance light-quest-122122.austin_bikeshare.bikeshare_trips
Live Results vs. Caching
By default, Zing live-queries your data as you ask questions, view queries, or deep-dive. This ensures that results are always up-to-date, and allows for real-time alerting.
However, you can also turn on results caching. This temporarily stores the result of a question so that if you view the question again in a short period of time, the question doesn’t need to re-run.
This has the advantage of reducing compute for questions which are accessed frequently. If you access a question after the cache duration, the question will live-run the question and store its result for the cache duration specified.
You can set the length of time to cache a question’s results and typically this should be aligned to the update frequency of your underlying data. For instance, if your underlying data is updated once every 30 minutes, a cache duration of 30 minutes would be appropriate.
Switch between live mode and cache mode for a saved question by tapping ‘cache settings’ from the three dots in the upper right.
Zing Advanced Voice Mode that allows you to talk directly to your data and get natural language spoken summaries in seconds. Zing is using your data source and computes the joins, calculations, and filters to get you reliable answers on the fly - with no need for a semantic model, or pre-computing aggregations or views.
Unlock unmatched performance on large datasets with Zing’s new Server-Side Processing. Instantly sort, filter, and paginate tables with millions of rows without freezing your browser. Experience true scalability and stability for your most demanding data analysis.

