Getting Started
Start Using Zing in 3 Easy Steps
-
Create an account by clicking ‘Sign up’ on getzingdata.com. Use your work email address to make it easier for you to collaborate with colleagues (by default you can only invite people with the same domain name, though this is changeable under organization settings).
If you’d like to be able to to ask questions and view analysis on the go, Zing is also available on iOS and Android.
-
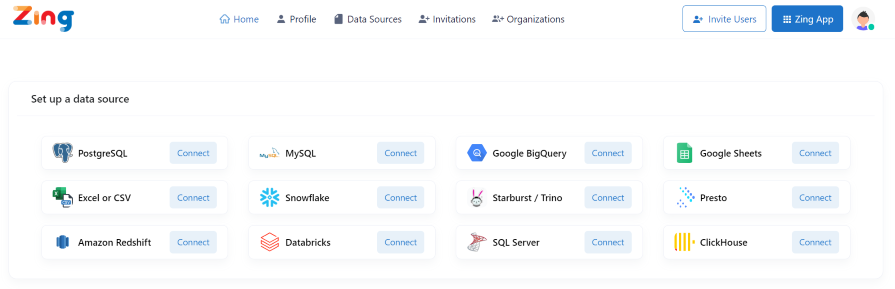
Add a data source. Zing supports Snowflake, Postgres, MySQL, Google BigQuery, Google Sheets, Excel and most databases you know of.
- Ask a question! There are three ways to do this:
- Natural language: From the Home screen, type in a question in natural language in the search bar which is located at the top right of the page. Relevant fields will pop up as you’re typing to guide you in completing the question. Hit ‘Enter’ and Zing generates an answer for you.
- Visual editor: From a table, drag and drop field names to the ‘y-axis’, ‘x-axis’, dimension, or filter areas of the chart. You can also select the type of chart you want (e.g. bar chart, line chart, scatter plot).
- SQL: From a table, tap the three dots in the upper right and select ‘SQL editor’ which will provide a SQL IDE with a typeahead for fields and aggregations.

