This the multi-page printable view of this section. Click here to print.
Docs
- 1: Overview
- 2: Getting Started
- 3: Set Up a Data Source
- 3.1: PostgreSQL
- 3.2: MySQL
- 3.3: Google BigQuery
- 3.4: Google Cloud SQL
- 3.5: Google Sheets
- 3.6: Excel, CSVs and JSONs
- 3.7: Snowflake
- 3.8: Trino / Starburst Enterprise / Starburst Galaxy
- 3.9: Databricks
- 3.10: Mozart Data
- 3.11: Supabase
- 3.12: Amazon Redshift
- 3.13: Microsoft SQL Server
- 3.14: Clickhouse
- 3.15: Amplitude
- 3.16: Google Analytics 4
- 4: Asking Questions & Querying
- 5: Chat
- 6: Guided Analysis
- 7: Modeling Layer
- 8: SSO Integrations
- 9: Charting & Data Tables
- 10: Dashboards
- 11: Creating Alerts
- 12: Location based querying
- 13: Accounts, Invites, & Collaboration
- 13.1: User Roles
- 14: External Sharing
- 15: Row Level Security (RLS)
- 15.1: Lookup Tables for RLS
- 15.2: Centralized RLS Setup
- 16: Embedded Analytics
- 16.1: Setup and Preparation
- 16.2: Integration
- 16.3: Row Level Security for Embedded Charts
- 17: Partner Integrations
- 18: Migrating from other SQL clients
- 19: Joins
- 20: Troubleshooting
- 20.1: Connnecting to AWS RDS
- 20.2: Natural Language Queries
- 20.3: Connnecting to Google Cloud SQL
- 21: Account Management & Billing
- 21.1: Personalization
1 - Overview
What is Zing?
Zing Data is a data analysis and collaboration platform, with native apps on iOS, Android, and the web. It lets you query data visually in seconds, use natural language to ask questions, and set up real-time alerts so you’d the first to know when data changes.
Why do I want it?
Zing makes it possible to empower everybody in your organization to do data analysis from anywhere – no SQL, desktop, or expensive license required.
Free for teams up to three people (on the basic plan), and collaborative by design, Zing automatically handles the hard stuff – like visualization settings, long running queries, joins on the fly, and more to make using data easier than ever.
What is it good for?
- Fast, intuitive, easy data analysis of any relational data.
- Visualizing data.
- Querying data with natural language or dictation using OpenAI
- Getting real-time push and email alerts when data meets a condition you specify.
- Creating live dashboards for internal use, to be shared with partners, or publicly
- Sorting and filtering data to glean insights.
- Asking questions using natural language, tapping visually, or custom SQL.
- Sharing data results with your team.
- Making a graph to drop into a Slack thread or presentation on the go.
- Exporting a CSV file for deeper analysis.
- Seeing the data questions your colleagues are asking.
- Checking the latest data about your customers or users.
What is it not good for?
- Extremely complex data-science use cases such as building machine learning models from your phone
- Cross data-source joins (you’ll want to unify these in your data warehouse first), though you can easily do same-source joins within Zing
Where should I go next?
Get started with Zing here - its free!
- Getting Started: Get started with Zing
2 - Getting Started
Start Using Zing in 3 Easy Steps
-
Create an account by clicking ‘Sign up’ on getzingdata.com. Use your work email address to make it easier for you to collaborate with colleagues (by default you can only invite people with the same domain name, though this is changeable under organization settings).
If you’d like to be able to to ask questions and view analysis on the go, Zing is also available on iOS and Android.
-
Add a data source. Zing supports Snowflake, Postgres, MySQL, Google BigQuery, Google Sheets, Excel and most databases you know of.
- Ask a question! There are three ways to do this:
- Natural language: From the Home screen, type in a question in natural language in the search bar which is located at the top right of the page. Relevant fields will pop up as you’re typing to guide you in completing the question. Hit ‘Enter’ and Zing generates an answer for you.
- Visual editor: From a table, drag and drop field names to the ‘y-axis’, ‘x-axis’, dimension, or filter areas of the chart. You can also select the type of chart you want (e.g. bar chart, line chart, scatter plot).
- SQL: From a table, tap the three dots in the upper right and select ‘SQL editor’ which will provide a SQL IDE with a typeahead for fields and aggregations.
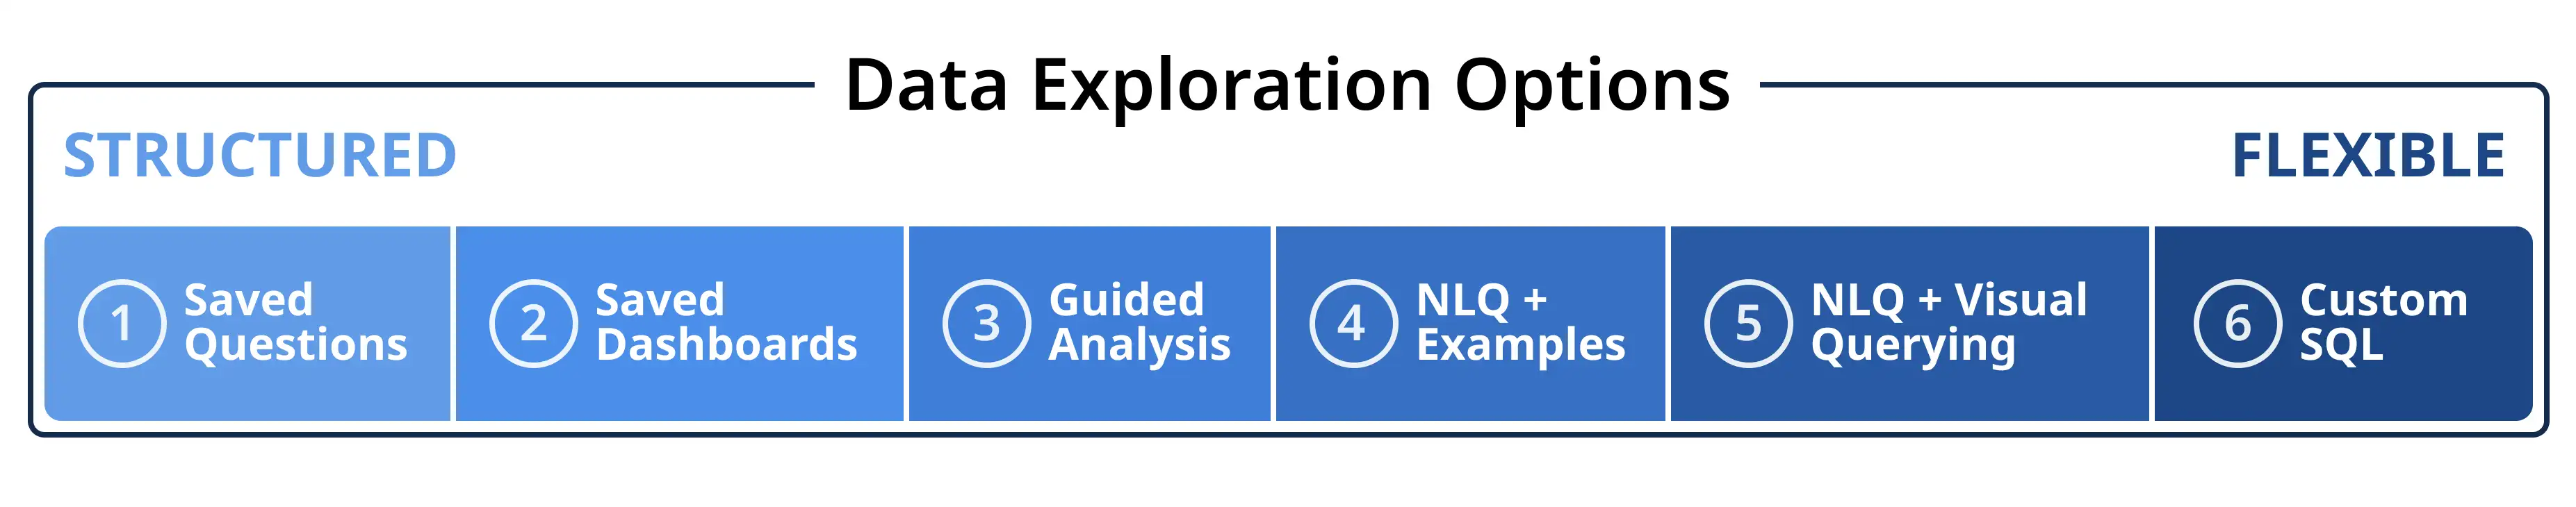
Next: Explore your data your way, with structured or flexible workflows
 Learn more here:
3 - Set Up a Data Source
Zing is built to query your own data, so you’ll want to set up a data source. While we provide a sample data set to help you get situated, adding your own data source (or sources) will make it possible to start asking questions of your company’s data from your phone or the web.
Adding a Data Source
The easiest way to set up a dataset is from the Zing web console,
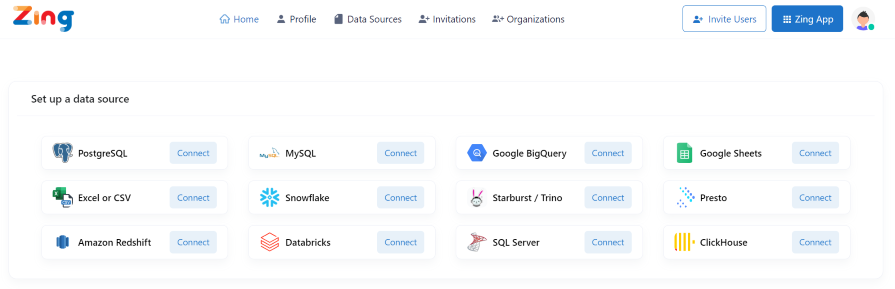
- Once you are logged in, tap data sources then the new data source button.
- In the modal, select the data source type (such as Postgres, BigQuery, etc.)

- Enter your database credentials, such as hostname, port, database name, username, and password
- Press save
- Zing will validate that your database credentials are valid once you press save and will add the source. It is then available immediately to query. If your credentials are invalid you’ll be prompted to check and resubmit.
You can also add database credentials directly from the Zing web, iOS, and Android apps by tapping the sources tab in the mobile app, then add new data source and following the steps above.
Once a data source as been added, it will immediately be available to all users that you have invited to your organization in the top of their Zing app in the tables section.
Note: You can set up multiple data sources with an organization, even across data source types. Zing will show the tables and views across data sources in the app.
Supported Data Sources
Database Type | Supported? | Notes |
|---|---|---|
PostgreSQL | Yes | Zing also supports cloud-hosted versions of this such as Amazon RDS and Google Cloud SQL |
mySQL | Yes | |
Snowflake | Yes | |
Google BigQuery | Yes | Setup only via web app (not mobile app) |
Google Sheets | Yes | |
Trino / Presto / Starburst | Yes | |
Amazon Redshift | Yes | |
Microsoft SQL Server | Yes | Setup only via web app |
Azure SQL | Yes | Setup only via web app |
Databricks | Yes | Setup only via web app |
Choosing what tables and views are visible
By default, all tables and views in your database are marked as ‘visible’ (including newly added tables), but you can exclude tables or views from visible and queryable in Zing if you’d like.
This is useful for excluding tables from other people in your organization which might be unnecessary for them (e.g. detailed server logs), or in simplifying the set of tables shown in Zing to be more streamlined.
To turn off tables or views:
-
First connect to your data source.
-
Then you’ll see a ’tables’ list and you can turn on/off all or individual tables/views.
-
Tap ‘Save’
Data Source Security
Two things you should to to ensure your database’s connection to Zing is secure:
-
Security best practices are to provide Zing read-only access (instead of full access) to your database. Zing doesn’t need write permissions and best security protocols dictate minimizing permissions. You see how to do this on StackOverflow for Postgres and mySQL.
-
When you make a data source accessible to the internet for Zing to be able to connect, it is best practice to limit the IP addresses that your database server will respond to.
This ensures that other IP addresses cannot access your database and only authorized IPs (such as Zing) are able to do so.
Zing’s IP address to whitelist is: 34.75.82.6
Additionally, if your database supports SSL, you should turn that on.
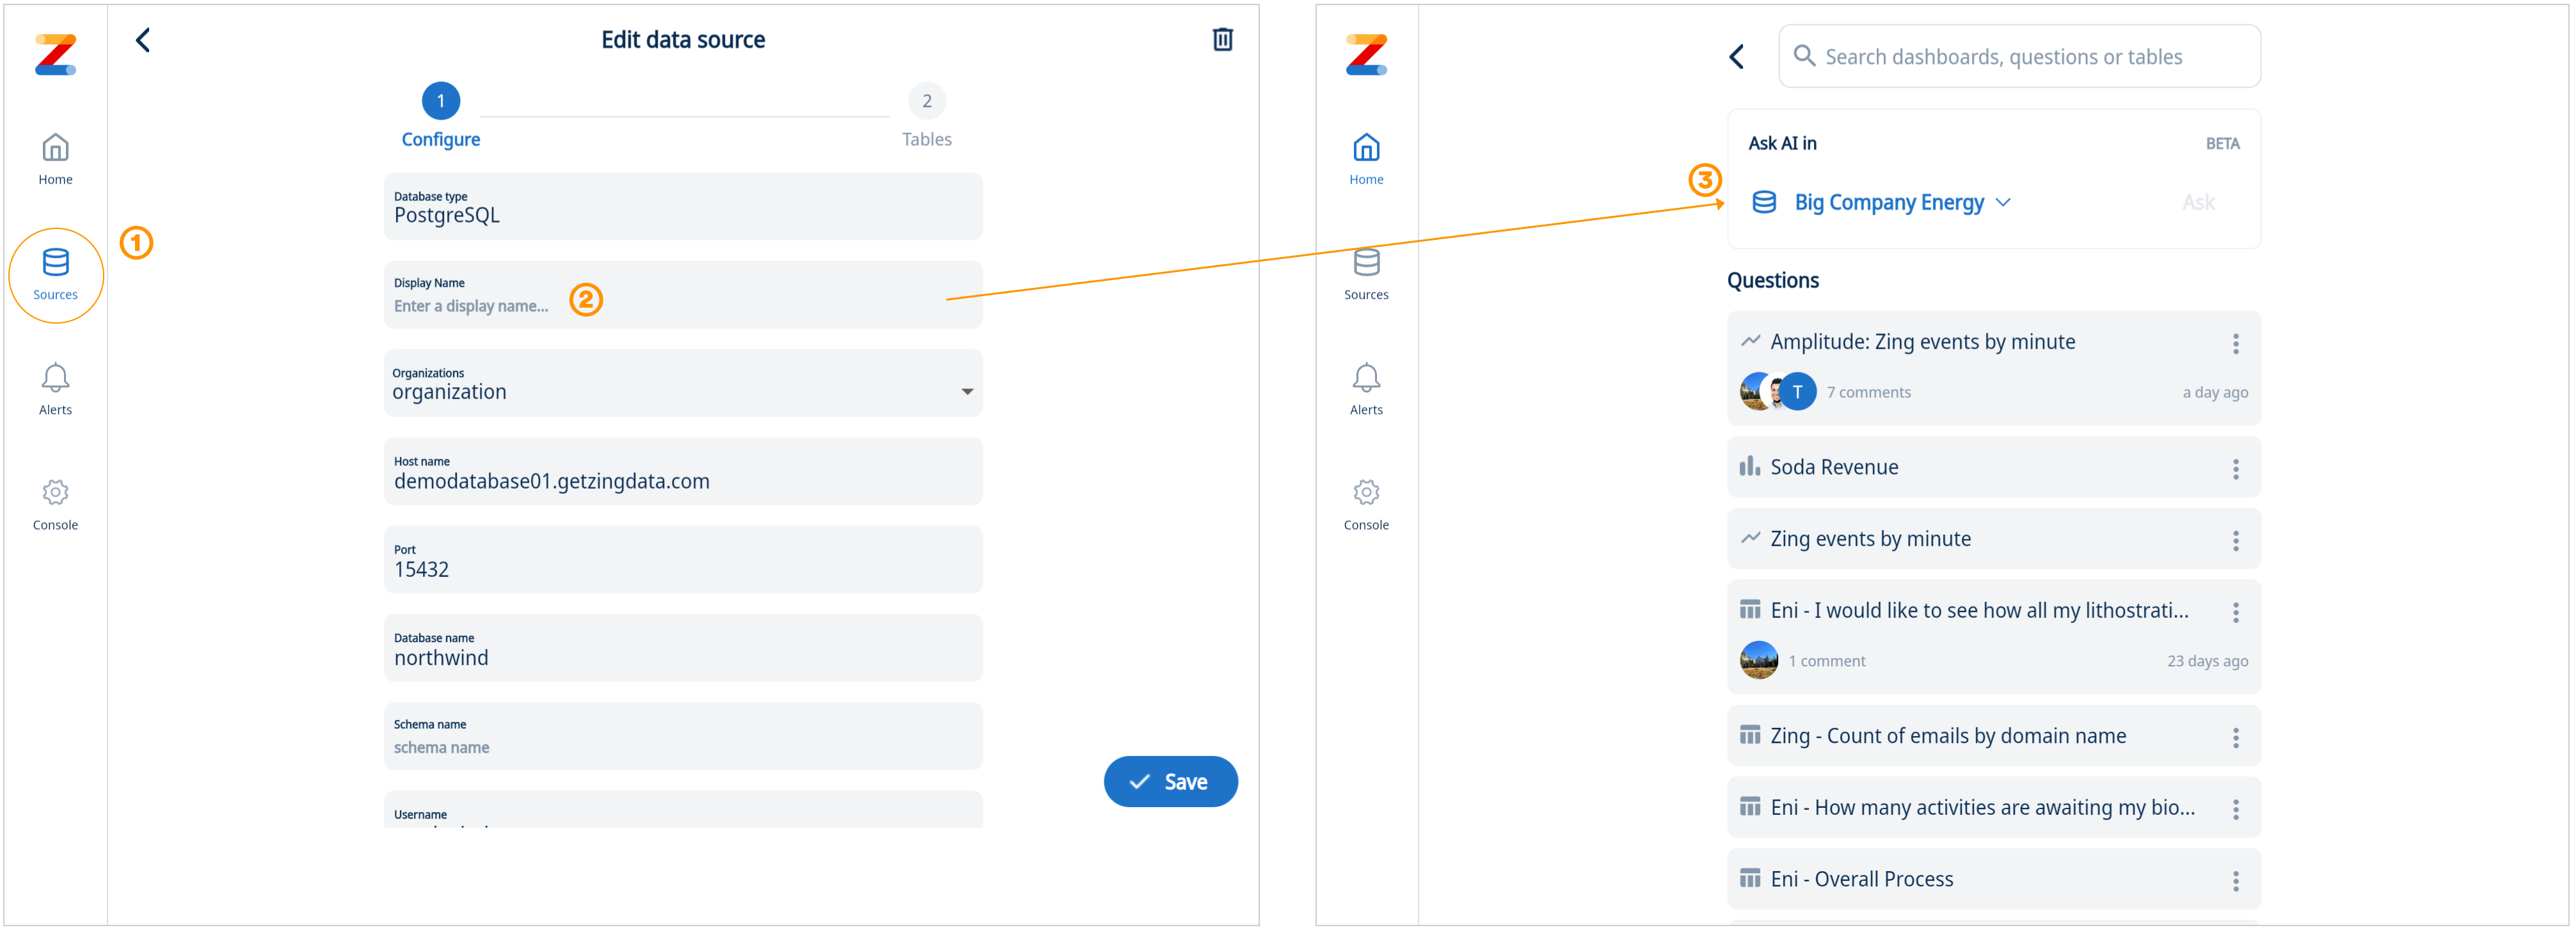
Data Source Aliasing
Database names often lack clarity and user-friendliness. Zing’s latest feature addresses this issue by allowing users to assign a simple display name, or alias, to their databases. This enhancement makes data exploration, querying, and chart creation more intuitive and efficient. With the ability to set short and descriptive data source names, users can easily navigate and interact with their data, ensuring a streamlined and user-centric experience. (1) Go to data sources (2) Enter your new display name (3) Go ask questions and see the new display name throughout the Zing platform
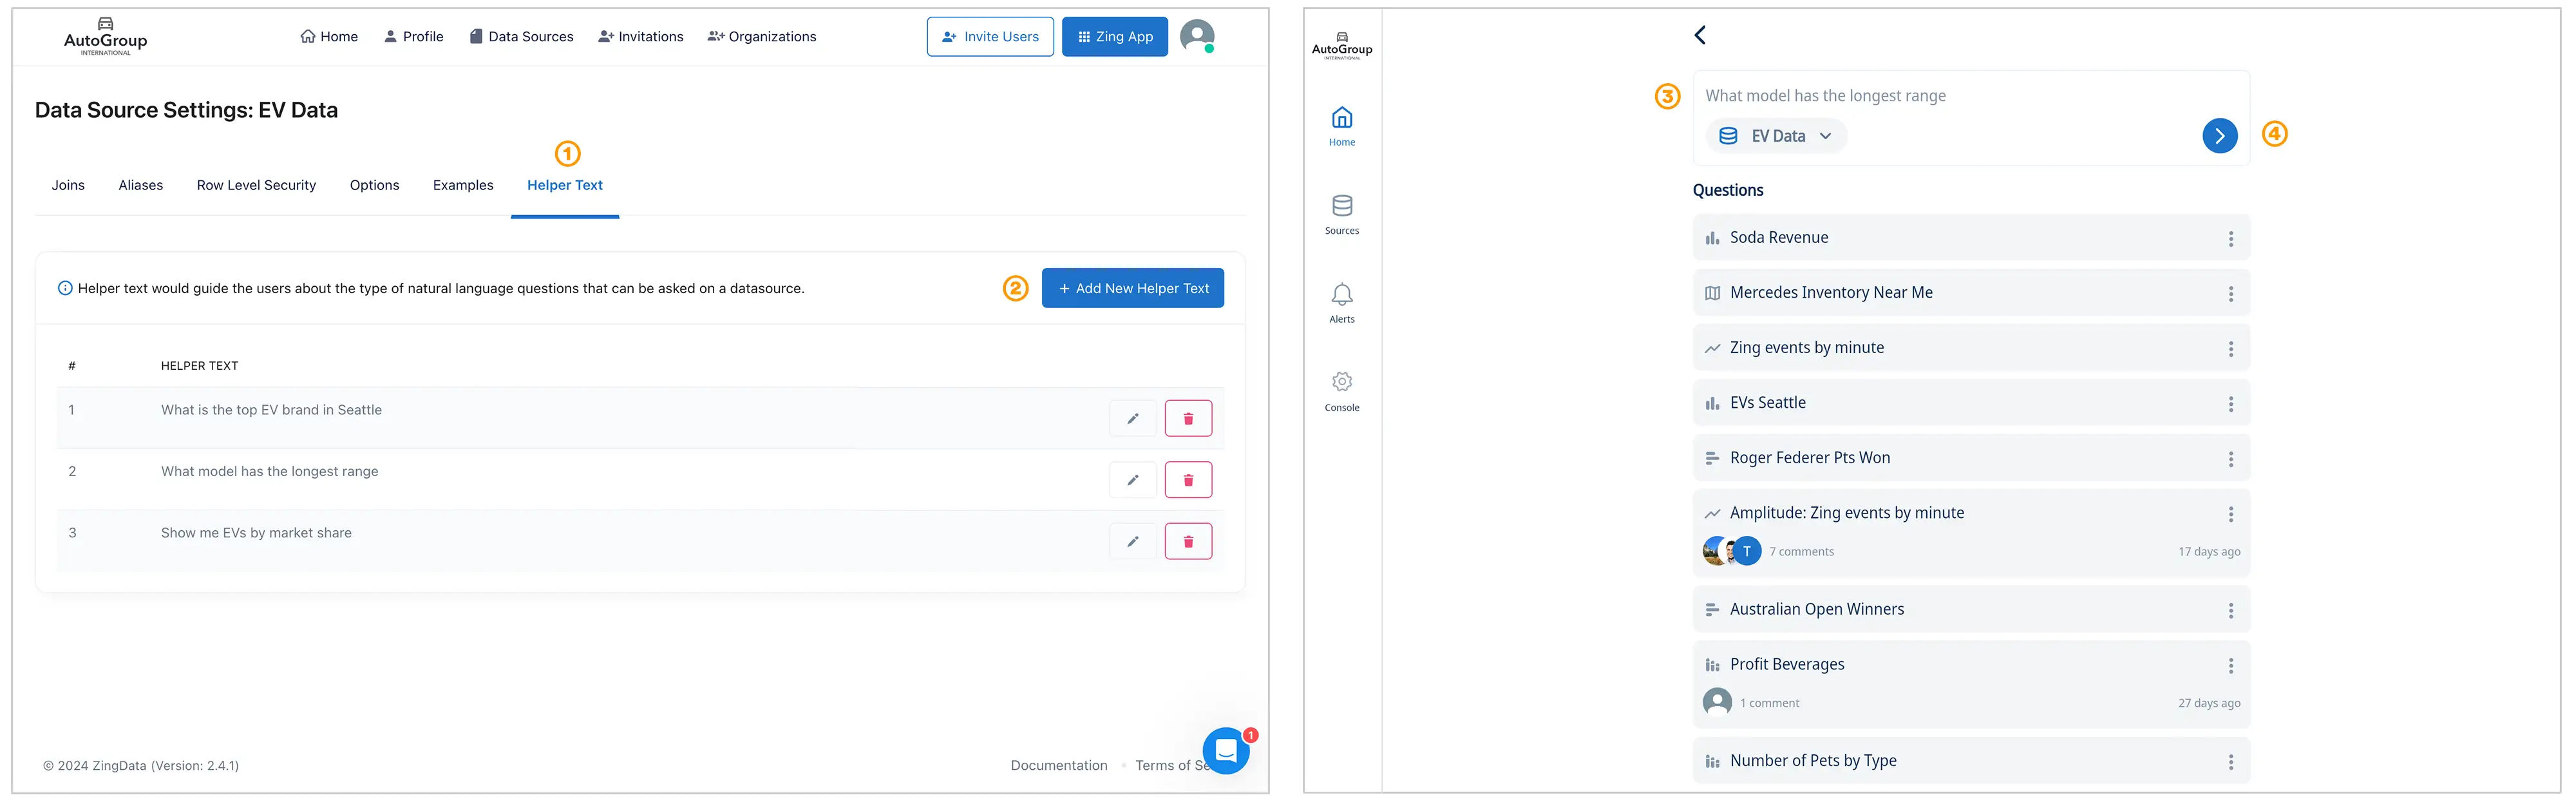
Adjust Helper Text in Search Box
To adjust the helper text in the Zing search box, go to the Zing Console, select a data source, and then click on [1] Helper Text. On the Helper Text page, you can create new helper text or edit existing entries [2]. If there is more than one helper text, Zing will automatically rotate the helper text in the search box [3]. The go button can be clicked at any time, and the helper text will be run as a query in the selected data source [4].
3.1 - PostgreSQL
PostgreSQL is one of the most widely used databases in the world, and its free! Everybody from developers writing their first line of code, to data scientists, to major corporations use PostgresSQL to store and query data.
You can connect Zing to your Postgres database from either the Zing web console, the Zing web app, the iOS app, or Android.
You’ll need:
- Hostname which is the URL or IP address of your database
- Port which is the port that your database is live on – typically 5432 by default for Postgres, but your port may differ
- Database Name which is the name on your hostname IP / URL you database is referenced by
- Username which is…your username. Best practice is to create a read only user
- Password which is…your password. Once you enter this, Zing will automatically encrypt this.
Web Console
Add a PostgreSQL database from the web console:
-
Go to your Zing Data Web Console and ensure you are logged in
-
Tap the ‘data sources’ tab

-
Enter your PostgreSQL credentials, as outlined above. If your database requires SSL to be enabled, turn on ‘Require SSL’ (not all Postgres configurations require this).

-
If your Postgres database is behind a firewall, you’ll need to configure your firewall to allow connections from Zing’s IP address: 34.75.82.6
-
Tap ‘Save’
-
The data source you just added will be available to everybody in your organization.
SSH Tunneling
Zing Data supports connecting to your postgres database via an SSH tunnel (sometimes referred to as SSH port forwarding). In an SSH tunnel, the entire network connection between your postgres database and the Zing Data platform is encrypted. This provides adequate security, even for databases that do not have SSL. In some cases, and for some databases, an SSH tunnel can provide better performance than connecting over SSL.

When seting up an SSH tunnel, you will need the following
-
SSH username
This is the username of the ssh tunnel.
-
SSH private key
Enter the SSH private key in RSA pem format in the text area. Make sure to not modify any of the newlines.
-
SSH password
This is usually not required, as an SSH tunnel can be set up without one.
-
SSH port
If no port is specified, Zing Data will attempt to initiate the tunnel connection over port 22.
App
To add a PostgreSQL database from your phone or the Zing Web App:
- Go to the sources tab
- Tap ‘Add a new data source’

- Enter your database credentials
- Tap ‘Confirm data source’
- Zing will verify that it can connect to your data source and if successful, add it as a source. If Zing cannot connect to your data source, you'll see a message asking your to check your credentials and retry. If even after checking your credentials and retrying you still experience issues, reach out to Zing support here
3.2 - MySQL
MySQL is one of the most widely used databases in the world, and its free! Everybody from developers writing their first line of code, to data scientists, to major corporations use MySQL to store and query data.
You can connect Zing to your MySQL database from either the Zing web console, the Zing web app, the iOS app, or Android.
You’ll need:
- Hostname which is the URL or IP address of your database
- Port which is the port that your database is live on – typically 3306 by default for mySQL, but your port may differ
- Database Name which is the name on your hostname IP / URL you database is referenced by
- Username which is…your username. Best practice is to create a read only user
- Password which is…your password. Once you enter this, Zing will automatically encrypt this.
Web Console
Add a MySQL database from the web:
-
Go to your Zing Data Web Console and ensure you are logged in
-
Tap the ‘data sources’ tab
-
Enter your mySQL credentials, as outlined above. If your database requires SSL to be enabled, turn on ‘Require SSL’ (not all MySQL configurations require this).
-
If your mySQL database is behind a firewall, you’ll need to allow connections from Zing’s IP address: 34.75.82.6
-
Tap ‘Save’
-
The data source you just added will be available to everybody in your organization.
App
To add a MySQL database from your phone or the Zing web app:
- Go to the sources tab
- Tap ‘Add a new data source’
- Enter your database credentials
- Tap ‘Confirm data source’
- Zing will verify that it can connect to your data source and if successful, add it as a source. If Zing cannot connect to your data source, you'll see a message asking your to check your credentials and retry. If even after checking your credentials and retrying you still experience issues, reach out to Zing support here
3.3 - Google BigQuery
You can connect Zing to Google BigQuery as a data source from the Zing web console. Zing Data is a trusted Google Cloud Partner.
You’ll need:
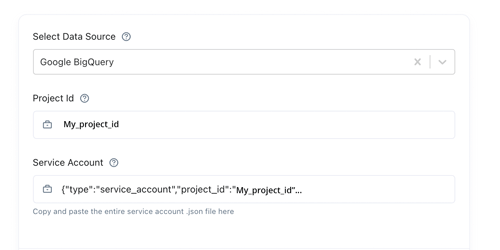
- Project ID which is the ID for your project in BigQuery
- Service Account JSON which is the file from your Google BigQuery account and allows Zing to authenticate into your BigQuery data source
You’ll also need to set up appropriate permissions, namely: Big Query Viewer rights and BigQuery Job User rights
Project ID
Just copy and paste your Project ID from your Google BigQuery account. You’ll get this from your Google Cloud Console.
Service Account
Your service account is set up by copying your credentials from your Google service account.
To access your BigQuery credentials required to connect Zing:
-
Log in to your Google Cloud Console
-
Click ‘IAM & Console’
-
Click ‘Service Accounts’

-
Add
Big Query Viewerrights andBigQuery Job Userrights
-
Select
Manage Keys
-
Select
Create Key
-
Select
JSON
-
From here, download the JSON file containing your Service Account information. Copy and paste the file’s contents into the Zing Data setup screen in the ‘Service Account’ box.

Note:
Setting up Google BigQuery with Zing must be done using the Zing Web Console.
3.4 - Google Cloud SQL
![]()
Google Cloud SQL is a fully managed relational database service for MySQL, PostgreSQL, and SQL Server with rich extension collections, configuration flags, and developer ecosystems. It automatically ensures your databases are reliable, secure, and scalable so that your business continues to run without disruption. Cloud SQL automates all your backups, replication, encryption patches, and capacity increases.
You can connect Zing to your MySQL database from either the Zing web console, the Zing web app, the iOS app, or Android.
Gathering the required information
Hostname
From the Navigation Menu on your Google SQL Cloud Console, click on “Connections”:

Find the Hostname from the Public IP address under “Networking section”

Port
The default port for your database engine type:
- MySQL: 3306
- PostgreSQL: 5432
- Microsoft SQL Server: N.A
Database Name
From the Navigation Menu on your Google SQL Cloud Console, click on “Databases”:

The table lists all the databases hosted on your Cloud SQL instance, identify the name of the database you wish to connect to.
Username
From the Navigation Menu on your Google SQL Cloud Console, click on “Users”:

Identify the name of your user under “User name”
Password
Retrieve the password corresponding to the user identified. Once you enter this, Zing will automatically encrypt this.
Whitelisting Zing Data’s IP on your Cloud SQL Instance
For Zing Data to connect to your Cloud SQL instance, you must authorize Zing’s network on the Cloud SQL console.
From the Navigation Menu on your Google SQL Cloud Console, click on “Connections” and then the “Networking” tab on the page,
Under the “Authorized networks” section, click on “ADD A NETWORK” to whitelist a network for the Cloud SQL instance.

Give a name for this network, i.e. “zingdata” and paste Zing’s IP address: 34.75.82.6/32 under “Network*”.

Scroll down and hit “Save” to update your changes.
Adding the data source on Zing Data
You are now ready to add in your data source on Zing!
Follow these guides on adding a new data source on Zing, based on your database engine:
Connecting via SSL
Downloading your certificates and keys
To connect Zing Data to your Cloud SQL instance via the SSL protocol, you need to download the following authentication documents from Google Cloud:
- Server Root Certificate
- Client Certificate
- Client Private Key
Only the server root certificate is required for Microsoft SQL Server.
You can do so by clicking on “Connections”, then the “Security” tab on the page, and then “CREATE CLIENT CERTIFICATE”:

Create a name for the SSL client and download all of the files or copy the texts on to somewhere secure:

Using your certificates and keys:
On Zing’s adding a data source page, click on “Require SSL” and paste the corresponding text into each text box, removing any trailing whitespace:

3.5 - Google Sheets
Google Sheets is a widely used cloud spreadsheet. Setting up Zing with Google Sheets is the easiest way to get started, as it requires no database connection. You can simply authenticate in with your Google credentials, or provide the URL to your Sheets.
This is also the best way to import CSVs (assuming they are within Sheets’ size limitations).
You can also connect to a Microsoft Excel file by importing it into Google Sheets, then connecting that sheet to Zing.
You can connect Zing to Google Sheets from either the Zing web console, the Zing web app, the iOS app, or Android.
Connection Modes
There are two ways to connect to Google Sheets:
- Live Connection mode, which will always run questions on the latest version of a sheet, and works with multiple tabs (you can choose which to make visible in Zing).
- Snapshot mode, which will run questions on the version of the sheet when you first connected it to Zing, and subsequent updates to the sheet will not be updated in Zing. This mode supports a single tab.
Setup Steps
For both modes, you’ll need:
-
A correctly formatted Google Sheet with field names in the header row. Your sheet should contain only the data you wish to import. Only one table per sheet (for now). Field names should not include special characters.

-
Permissions to that sheet - meaning that your Google Account has at least ‘view’ rights to the sheet, OR the sheet has ‘available to anybody with the link’ access
Web Console
Add a Google Sheet as a data source from the web:
-
Go to your Zing Data Web Console and ensure you are logged in
-
Tap the ‘data sources’ tab
-
Tap ‘Google Sheets’
-
To connect Zing to Google Sheets that are not public, authenticate into your Google account by clicking ‘Access your Google Sheets’ and enabling both Zing read access to your Sheets, and Google Drive read permissions when prompted. Both of these permissions must be granted for Zing to list your sheets and connect to your sheets as a data source.
From there you’ll see a list of your Google Sheets. Select one you’d like to import or search by name and click the name of the sheet, then click ‘Select’
-
To connect Zing to a publicly shared (available to anybody with the link) Google Sheet, you don’t need to authenticate into a Google account and can simply enter your Google Sheet URL.

-
Tap ‘Save’
-
Check for any warning messages which might indicate the sheet was incorrectly formatted.
-
Optionally choose if you want a live connection or a one-time snapshot. If you selected ’live connection’, choose which tabs you want to make visible to Zing.
-
The data source you just added will be available to everybody in your organization.
App
To add a Google Sheet as a data source from the Zing iOS or Android apps:
- Go to the sources tab
- Tap ‘Add a new data source’
- To connect Zing to Google Sheets that are not public, authenticate into your Google account by clicking ‘Access your Google Sheets’ and enabling Zing read access to your Sheets when prompted. From there you’ll see a list of your Google Sheets. Select one you’d like to import or search by name and click the name of the sheet, then click ‘Select’
- To connect Zing to a publicly shared (available to anybody with the link) Google Sheet, you don’t need to authenticate into a Google account and can simply enter your Google Sheet URL.
- Optionally choose if you want a live connection or a one-time snapshot. If you selected ’live connection’, choose which tabs you want to make visible to Zing.
- Tap ‘Confirm data source’. After a few seconds, Zing will show you if the sheet was successfully connected.
Notes
If you use the ‘Live Connection’ option to link Zing and the Google Sheet, be aware that modifying the sheet in a way that makes it improperly formatted (see above) will result in questions / graphs not loading correctly.
3.6 - Excel, CSVs and JSONs
Excel (XLS, XLSX) and CSV files can be read into Zing Data directly OR can be imported into a Google Sheet:
- Direct Import is fast, good for small files, and useful if you don’t have a Google account or can’t use Google Sheets at your organization.
- Google Sheets connection allows for dynamic alerts and updates to the data which will be immediately reflected in Zing.
Direct Import
Directly import CSVs and Excel files in Zing’s mobile apps (iOS, Android) and the web.
File types supported are:
- csv
- dbf
- geojson
- json
- ndjson
- xls
- xlsx
Files up to 10 megabytes can be uploaded on the basic (free) plan, and larger upload sizes are available on the Standard, Pro and Enterprise plans.
To import a file, select the Excel or CSV option under ‘Add Datasource’ tab on mobile + web, or from the data sources tab on the Zing web console.
Formatting the file
In order to successfully import a file, the correct formatting should be applied to the data in the file before uploading.
Excel Files:
- The first row must contain field names
- Field names should not include special characters such as
()./\[\]\{\}?!@#$%^&\*()\_+-=. - There should not be any extra empty columns as these can result in the import to not work correctly.
JSON Files:
- The file should contain a list of objects.
- The property name should be enclosed in double quotes.
- If the value is a string or a date, that should be enclosed in double quotes too.
An example of a correctly formatted JSON file would be as follows:
[
  { "Mean": 315.97, "Uncertainty": 0.12, "Year": "1959-11-01" },
  { "Mean": 316.91, "Uncertainty": 0.12, "Year": "1960-11-01" },
  { "Mean": 317.64, "Uncertainty": 0.12, "Year": "1961-11-01" },
  { "Mean": 318.45, "Uncertainty": 0.12, "Year": "1962-11-01" },
  { "Mean": 318.99, "Uncertainty": 0.12, "Year": "1963-11-01" },
  { "Mean": 319.62, "Uncertainty": 0.12, "Year": "1964-11-01" },
  { "Mean": 320.04, "Uncertainty": 0.12, "Year": "1965-11-01" }
]
We’ve added the ability to use Zing with an unlimited number of CSV files, join across them, and add/replace/delete them in much more flexible ways:
Append: Add new data to an existing table
- Add new rows to an existing table
- If the new CSV has columns that aren’t present in the existing table, those new columns will be added
- This is the equivalent of UNION ALL in SQL
Overwrite: Keep the same table name, but replace the data
- All existing questions and dashboards connected to that table will work how you expect, but use the newly-uploaded data.
- The previous data in the table is deleted
Multi-file upload: Add multiple CSV or Excel files at once
- Upload up to 10 MB per file (free plan) or 100 MB per file (paid plans)
- Optionally define join relationships between them to create a full queryable, multi-table data environment without needing to stand up a database
CSV and Excel files can co-exist and all live within a single data source
- Previously, each CSV or Excel file imported was its own ‘data source’
- Now, you can choose if you want to add a new file to an EXISTING data source, or instead create a NEW data source. Adding a file to an existing data source can make joining tables and appending / updating data easier.
Google Sheets Connection
Excel and comma separated value files are common ways to store data. You can import these files to Zing via the Google Sheet importer.
All of these file types are supported:
- .xls (if newer than Microsoft® Office 95)
- .xlsx
- .xlsm
- .xlt
- .xltx
- .xltm
- .ods
- .csv
- .txt
- .tsv
- .tab
Import Steps
-
First, import your (non-password-protected) file to Google Sheets:

- Ensure the first row contains headers.
- Every column to be imported must contain a header
- Header names must be unique within your sheet
- Exclude images, macros, tick-boxes, etc from your sheets prior to import
-
Tap ‘share’ and set link visiblity set to ‘anyone with the link’. Once the sheet is imported you can revoke this permission if you wish.
Note that unlike all other data sources in Zing, Google Sheets imports are not ’live’ connections. That is, Zing takes a ‘snapshot’ of the sheet at the time of import but subsequent changes to the sheet will not automatically update in Zing. If you’d really like it to be a live connection, let us know.
-
Then follow the steps in the next section to add the Google Sheet to Zing.
Web Console
Add a Google Sheet as a data source from the web:
-
Go to your Zing Data Web Console and ensure you are logged in
-
Tap the ‘data sources’ tab
-
Tap ‘Google Sheets’
-
Enter your Google Sheet URL. Your sheet’s link visiblity must be set to ‘anyone with the link’. Once the sheet is imported, you can revoke this permission if you wish.
-
Add the name of the table you’d like your sheet to appear as in Zing. This will be searchable in Zing so making this reflect what the table is about will make it easier to find and use.
-
Tap ‘Save’
-
Check for any warning messages which might indicate the sheet was incorrectly formatted
-
The data source you just added will be available to everybody in your organization.
Note that Google Sheets has some size limitations on imports.
3.7 - Snowflake
Snowflake is one of the most commonly used cloud data warehouses, capable of ingesting data from a variety of sources, supporting robust permissioning, and allowing seamless scaling to large data sets.
You can connect Zing to Snowflake as a data source from the Zing web console or from the Zing Data mobile / web apps.
You’ll need:
- An active Snowflake account
- An active Zing Data account
Setup Steps
-
Login to the Zing web console, and click on the ‘data sources’ tab
-
Click ‘New source’
-
Select ‘Snowflake’ as the data source.

-
Enter your Snowflake credentials:
- Hostname is required. If your snowflake URL is https://aa11111.us-central1.gcp.snowflakecomputing.com, enter the portion following https:// but before .snowflakecomputing.com. So in this example the hostname to enter would be: aa11111.us-central1.gcp
- Database is required
- Username is required
- Password is required unless you are using a private key
- Schema is optional
- Private Key is optional. This is the contents of your .p8 downloaded from Snowflake if you have key-pair authentication turned on for this username.
-
Tap ‘Save’, and Zing will confirm that a connection to the database can be established. A list of all tables in that database will then be shown.

-
By default, all the tables in your database will be made visible, but you can optionally turn off certain tables from being displayed by turning the switch for an individual table off, then hitting ‘save’.

-
The data source you just added will be available to everybody in your organization.
Note: Setting up Snowflake with Zing can be done both via the Zing Web Console (as outlined above), or from the Zing Data app, by clicking on the ‘sources’ tab then ‘add a new source’.
3.8 - Trino / Starburst Enterprise / Starburst Galaxy
Trino is an open source, highly performant, distributed query engine (formerly PrestoSQL). Starburst Enterprise is the enterprise offering of Trino and Starburst Galaxy is the cloud native and fully managed service of the Trino query engine offered by Starburst. Zing Data works with Trino, Starburst Enterprise and Starburst Galaxy.
Connect Zing to your Trino database from the Zing web console.
You’ll need:
-
Hostname is the hostname of Trino / Starburst Enterprise / Starburst Galaxy cluster. In Starburst Galaxy it’s in View Clusters » More Details » Get Connection; in Trino it depends on setup; in Starburst Enterprise Product it’s in EKS configurations

-
Port is the port that your cluster is live on - typically 443 by default for Trino / Starburst Enterprise / Starburst Galaxy, but your port may differ.
-
Username is…your username. Best practice is to create a read only user.
-
Password is…your password. If you are using Starburst Galaxy, this will be the password you use to login to Starburst’s web portal. Zing will encrypt this.
-
Catalog is the data source within your Trino/Starburst cluster you would like to connect to. Read more here.
-
Schema defines a set of tables that can be queried. Read more here.
-
Database Name can be any value - it is just how the name data source appears in Zing but isn’t used to connect to your cluster
Right now, Trino data sources must be set up on web (but are accessible across both Zing Web and Zing Mobile apps).
To add a Trino data source:
-
Go to your Zing Data Web Console and ensure you are logged in
-
Tap the ‘data sources’ tab
-
Enter your Trino credentials, as outlined above.

-
Choose if you’d like to make all tables in your schema visible, or if you’d like to select only certain tables to be visible.
-
Tap ‘Save’
- The data source you just added will be available to everybody in your organization.
3.9 - Databricks
Databricks is cloud data platform and is an outgrowth of Apache Spark. It can run on Amazon Web Services, Microsoft Azure, or Google Cloud Platform.
You can connect Zing to Databricks as a data source from the Zing web console (and from the Zing mobile / web apps soon!).
You’ll need:
- An active Databricks environment
- An active Zing Data account
Setup Steps
-
Login to your Databricks web console and go to ‘User Settings’ at the top right
-
Under ‘Access Tokens’, click on ‘Generate new token’. Make sure you save it somewhere safe.

-
In the left-hand menu, switch to the ‘SQL’ context and click on ‘SQL Warehouses’.

-
From the list of warehouses, choose the one you want to query in ZingData and click on it.
-
Switch to the ‘Connection details’ tab and save the displayed info, we will be using it shortly.

-
Login to the Zing web console, and click on the ‘data sources’ tab.

-
Click ‘New datasource’.
-
Select ‘Databricks’ as the data source.
-
Enter your Databricks host, port, path and token gathered in steps 2 and 5 above.

-
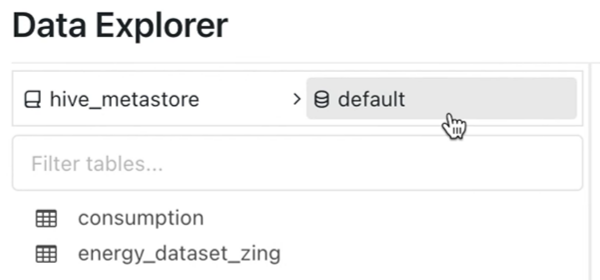
Your Databricks schema can be found in Databricks by clicking ‘Data’ on the lefthand navigation and then looking under ‘Data Explorer’. Enter this into Zing.
-
Tap ‘Save’, and Zing will confirm that a connection can be established. A list of all tables in that database will then be shown.
11. By default, all the tables in your database will be made visible, but you can optionally turn off certain tables from being displayed by turning the switch for an individual table off, then hitting ‘save’.
12. The data source you just added will be available to everybody in your organization.
A step by step video is here:
3.10 - Mozart Data
While Zing supports common databases, if you want to connect Zing to CRM, ERP, and ads reporting systems you’ll likely want to use a third party that pulls in data from each source, standardizes it, and makes it easily queryable.
Mozart Data supports more than 300 data sources and allows for join operations across data sources, making the transformed data available to Zing as a Snowflake data source. Mozart Data supports:
- Sendgrid
- Square
- Stripe
- Amplitude
- Quickbooks
- Workday
- Google Analytics
- Facebook Ads
- Hundreds of others
To connect Zing Data to Mozart Data, you’ll need:
- A Mozart Data Account which is free for a 14 day trial period
- A Zing Data Account
Once you’ve created both accounts
-
Go to the Zing web console and click the ‘Data Sources’ tab then ‘Add Datasource’
-
Select ‘Snowflake’ as the data source type:

-
Login to your Mozart Data dashboard
-
Go to the ‘Integrations’ tab, then click ‘Zing Data’

-
This will display your connection information to copy + paste into Zing Data using the a ‘Snowflake’ data type
- Hostname
- Database Name
- User Name
- Password

-
Once you’ve entered all credentials into Zing, tap check connection and you’ll see a list of all tables from Mozart. If you want to limit which tables are visible, you can ’turn off’ some of the tables and they’ll not be visible to you or other users in your organization in the Zing UI.

-
Click ‘Save’ in the bottom right and the data source will be added. It will now appear in the ‘sources’ tab in the Zing app, and on the homescreen of the Zing app.
3.11 - Supabase
Supabase is an open-source Firebase alternative that provides a Postgres database, Authentication, instant APIs, Edge Functions, and more. It allows developers to build scalable backends quickly.
You can connect Zing to Supabase as a data source from the Zing web console.
You’ll need:
- An active Supabase project
- An active Zing Data account
Setup Steps
-
Login to your Supabase project dashboard.
-
In the top navigation bar, click on Connect.

-
Under the “Connection String” section, select
PSQLas the “Type”. Locate theConnection stringfor your database. You’ll typically find options for direct connection, session pooler, and transaction pooler. For general data visualization, theSession poolerconnection string is often recommended.
-
Copy and save this connection string somewhere safe. It will contain your host, port, database name and username.

-
Login to the Zing web console, and click on the ‘data sources’ tab.

-
Click ‘New Data Source’.

-
Select ‘PostgreSQL’ as the data source.

-
Enter the Host, Port, User, Password, and Database Name gathered from your Supabase connection string in step 4. Take note: Database Password is the password used on creation of the Project.

Steps to Reset Database Password - head to Project Settings, under Database tab, select Reset database password in the Database password section.

-
Tap ‘Check Connection’, and Zing will confirm that a connection can be established. A list of all tables in that database will then be shown.

-
By default, all the tables in your database will be made visible, but you can optionally turn off certain tables from being displayed by turning the switch for an individual table off, then hitting ‘save’.

-
The data source you just added will be available to everybody in your organization.

A step by step video is here:
3.12 - Amazon Redshift
Amazon Redshift is a widely used cloud data warehouse, hosted on AWS and configurable as either a cluster where you define setup parameters, or a ‘serverless’ set-up.
You can connect Zing to your Redshift cluster from either the Zing web console, and then can access it via the Zing web app, iOS app, or Android.
You’ll need:
- Hostname which is the publicly accessible IP or URL for your Redshift database. Note that you’ll need to set your database to be publicly accessible.
- Port which is the port that your database is live on – typically 5439 by default for Redshift, but your port may differ
- Database Name which is the name on your hostname IP / URL you database is referenced by
- Username which is…your database (NOT AWS!) username. Best practice is to create a read only user
- Password which is…your password. Once you enter this, Zing will automatically encrypt this.
If you’ve not already created a Redshift cluster and made it accessible to a data querying tool outside youur VPC, you’ll need to:
-
Create a Virtual Private Cloud (VPC) – the default VPC is fine.
-
Create a subnet group
-
Expose a public IP (often using ElasticIP), allocate it, and connect it to your Redshift instance
-
Set your Redshift cluster to ‘publicly accessible’ and connect it to the IP you’ll expose to the internet via a routing table
-
Ensure your security group allows connections from IPv4 connections from the internet (or better, just from Zing’s IP specifically: 34.75.82.6 )
Web Console
-
Go to your Zing Data Web Console and ensure you are logged in
-
Tap the ‘data sources’ tab
-
Enter your Redshift credentials, as outlined above.
-
If your Redshift instance database is behind a firewall (which it always always will be), you’ll need to allow connections from Zing’s IP address: 34.75.82.6
-
Tap ‘Check Connection’
-
You’ll see a list of tables and views which you can allow Zing to access. By default ‘Include All’ is turned on which means all database tables will be visible to Zing. But if you’d like you can select a subset of tables to make visible to Zing.
-
Tap ‘Save’
-
Once you see that your connection has been successfully saved, tap ‘Close’
-
The data source you just added will be available to everybody in your organization.
Zing will verify that it can connect to your data source and if successful, add it as a source. If Zing cannot connect to your data source, you'll see a message asking your to check your credentials and retry. If even after checking your credentials and retrying you still experience issues, reach out to Zing support here
3.13 - Microsoft SQL Server
Microsoft SQL Server is one of the most widely used databases for enterprise deployments, developed by Microsoft. MS SQL is scalable and includes ETL (Extract, Transform and Load) tools and reporting services.
You can connect Zing to your MS SQL database from the Zing web console.
You’ll need:
-
Hostname, which is the URL or IP address of your database
-
Database Name, which is the name on your hostname IP / URL, your database is referenced by
-
Username, which is your username. Best practice is to create a read only user
-
Password, which is your password. Once you enter this, Zing will automatically encrypt this.
Web Console
Add a MS SQL database from the web:
-
Go to your Zing Data Web Console and ensure you are logged in
-
Tap the ‘Data Sources’ tab

-
Enter your MS SQL credentials, as outlined above.

-
If your SQL Server / Azure database is behind a firewall (which it typically will be), you’ll need to allow connections from Zing’s IP address: 34.75.82.6
Depending on your setup, you may need to set up port port forwarding on your router for port 1433 (assuming you are using the SQL Server default port) to the server your database resides on -
Ensure that TCP/IP protocol is enabled on SQL server (instructions here)
-
Tap ‘Check Connection’
- Zing will verify that it can connect to your data source and if successful, add it as a source. If Zing cannot connect to your data source, you'll see a message asking your to check your credentials and retry. If even after checking your credentials and retrying you still experience issues, reach out to Zing support here
-
Choose the tables you want to include and tap ‘Save’.

-
The data source you just added will be available to everybody in your organization.
3.14 - Clickhouse
Clickhouse is an open-source database management system (DBMS) for online analytical processing (OLAP). It uses a column-based structure. Clickhouse was designed to be fast and highly-scalable. Clickhouse stands out for high performance because it gives attention to low level details when performing queries.
You can connect Zing to your Clickhouse database from the Zing web console.
You’ll need:
- Hostname, which is the URL or IP address of your database
- Database Name, which is the name on your hostname IP / URL, your database is referenced by
- Username, which is your username. Best practice is to create a read only user
- Password, which is your password. Once you enter this, Zing will automatically encrypt this.
If you require the connection to be secure, three additional fields would be required:
- Server Root Certificate
- Client Key
- Client Certificate
The Clickhouse documentation provides more information about generating certificates to connect via SSL.
Web Console
Add a Clickhouse database from the web:
-
Go to your Zing Data Web Console and ensure you are logged in
-
Tap the ‘Data Sources’ tab
-
Enter your Clickhouse credentials, as outlined above.
If you are connecting to Clickhouse Cloud, you’ll typically want to use port 8443 and ‘use SSL’. Your connection host will be something like https://xxxxx123.us-east-1.aws.clickhouse.cloud
-
If your Clickhouse database is behind a firewall (which it typically will be), you’ll need to allow connections from Zing’s IP address: 34.75.82.6
-
Tap ‘Check Connection’
-
Zing will verify that it can connect to your data source and if successful, add it as a source. If Zing cannot connect to your data source, you'll see a message asking your to check your credentials and retry. If even after checking your credentials and retrying you still experience issues, reach out to Zing support here
Unknown Shortcode
contact

Unknown Shortcode
contact
-
Choose the tables you want to include and tap ‘Save’.

-
The data source you just added will be available to everybody in your organization.

3.15 - Amplitude
Amplitude Analytics is one of the broadly used tools for storing user events, generating cohorts, and taking a deeper look into user journeys throughout your app or website.
But having this data live only in Amplitude, visible and queryable only from a computer limits your team’s ability to understand what is happening with users in real-time.
There are three main steps:
- Sync Amplitude Data to Google BigQuery to regularly (even 10 minutes in our case) push all user events in near real-time to your cloud data warehouse
- Set up Google BigQuery as a data source for Zing Data, including how to handle service accounts and permissions
- Query Amplitude analytics events from Zing’s iOS, Android, and web apps in just a few taps, and save analysis for easy re-use
Step 1: Syncing Amplitude Data to Google BigQuery (or Snowflake / Redshift)
- Login to Amplitude, then click the Data tab, then Destinations tab.

- Click new destination and select BigQuery, Snowflake, or Redshift

- Select the data you’d like to export export frequency
- Review the schema and click Next.
- Specify the dataset in the cloud data warehouse to receive your Amplitude data. If you’re connecting to Google BigQuery, upload the service account key file. This file must be in JSON format. Instructions for creating a service account in BigQuery with the appropriate permissions are here.

- Click Next. Amplitude connects to your warehouse upload is successful, click Finish to complete the process.
Step 2: Set up BigQuery (or Snowflake / Redshift) with Zing Data
3.16 - Google Analytics 4
Google Analytics 4 (GA4) is a supported data source for Zing Data, via a BigQuery connection. This lets you leverage Zing Data for streamlined query generation, mobile access, dashboard creation, and real-time alerts on top of your GA4 data.
Zing Data is a trusted Google Cloud Partner.
Step 1: Set Up Google Analytics 4
First ensure that your website has Google Analytics 4 properly configured. GA4 offers a wealth of user behavior data that you’ll be tapping into. Once your GA4 account is in place, proceed to the Google Analytics dashboard at analytics.google.com.
Step 2: Create a BigQuery Project
- If you don’t have a BigQuery project, head over to cloud.google.com and create one (free tier available).
- Enable the BigQuery API for your project.
Step 3: Link Google Analytics 4 to BigQuery
- Navigate to the Admin section in Google Analytics.
- Scroll down and locate “BigQuery Link” under “Data Streams.”
- Click “Link” to establish a connection between your GA4 account and BigQuery.
Step 4: Wait 24-48 hours
GA4 data does not immediately sync to BigQuery and it can take even a few days (more than 24 hours from our testing) before you start seeing GA4 tables and events in BigQuery.
Step 5: Set up a view with data from all individual days of events
-
Within the BigQuery section of cloud.google.com, click **new query **from one of the event tables which has been populated by GA4. It will look something like events_20230817 or events_intraday_20230817
-
Create a query with the following text, then save and save as view
SELECT * FROM ‘<PROJECT_ID>.<DATASOURCE_ID>.events_*`
This combines all daily events tables to make them queryable as a single table, similar to a UNION ALL of the events_day1, events_day2, etc.
Step 6: Configure a Service Account for BigQuery
- Access the “Credentials” section under “APIs & Services” in Google Cloud.
- Create a new service account, granting it necessary permissions (e.g., BigQuery Data Viewer, BigQuery Job User).
- Download the service account JSON file containing credentials.
Step 7: Connect Zing Data to BigQuery
- Log in to Zing Data.
- Connect Zing Data to your Google BigQuery project using the service account details.
- Select the desired datasets and tables
Step 8: Craft Data Queries with Zing Data
- From the Zing Data home screen, click on the events view you created in step 5
- Leverage natural language to generate queries for your GA4 data by typing in the search bar at the top.
- Access these queries via your mobile device for on-the-go insights.
- Combine queried data to create meaningful dashboards and visualizations by adding questions to a dashboard.
- Set up real-time alerts based on specific data thresholds by tapping the top right three dots on any question with a time series.
Conclusion
By connecting Google Analytics 4 with BigQuery and Zing Data, you’ve unlocked a powerful mechanism for harnessing insights from user behavior with the flexible power of natural language querying, SQL, or easy visual querying with SwiftQuery.
This integration empowers you to analyze trends, track performance, and make informed decisions for your business, all while enjoying the convenience of natural language query generation, mobile access, and real-time alerts. Best of all, the free tiers offered by BigQuery and Zing Data make this powerful capability accessible to businesses of all sizes.
Note:
Setting up Google BigQuery with Zing must be done using the Zing Web Console.
4 - Asking Questions & Querying
Asking Questions
From the Zing App you’ll see three sections:
- Dashboards are collections of questions laid out on a canvas. Any question can be added to a dashboard.
- Questions displays questions you save or that other people in your organization have shared with you. Tap a question to view the graph or table of results, or to clone an existing question to make it your own. You can also comment on questions to participate in a conversation, and anybody who is part of that conversation will be notified by email of your comment.
- Tables displays all visible tables and views of any of your database(s). If you have multiple data sources configured in Zing, you’ll see all visible tables and views from all data sources you have set up or which have been shared with you. If you only made certain tables available to Zing in your connection settings, only the tables / views you ’turned on’ will show here.
Ask questions from a table by tapping on the table name, then dragging fields to the x, y, or filter areas of the SwiftQuery canvas.
Ask questions from a dashboard by tapping on a question card in a dashboard then clicking on an individual data point to deep dive or see values, or click on the three dots in the upper right to duplicate a question and modify it.
You can also create queries using natural language by just tapping the search bar, and selecting the a data source from the drop-down.
Organizing with Question Categories
As your organization creates more questions, keeping them organized is key to helping team members find the insights they need. With Categories, you can group related questions by project, department, or topic.
Creating a New Category
You can create a category at any time from the ‘Questions’ list.
- From the Questions tab on the home screen, tap the three-dot menu (…) next to any question.
- Select Assign category from the dropdown menu.
- If this is your first one, you will see a prompt to Create First Category. Otherwise, you can select an existing category or tap Create New Category.
- In the creation screen, provide the following details:
- Category Name: A descriptive name for the group (e.g., “Q4 Marketing Funnel,” “Sales Team KPIs”).
- Organization: Select the organization this category belongs to.
- Icon & Color: Choose a unique icon and color for easy visual identification.
- Tap Create Category to save it.
Assigning Questions to a Category
Once a category is created, you can assign any question to it.
- Tap the three-dot menu (…) next to the question you wish to categorize.
- Select Assign category.
- Choose the desired category from the list. The question will now appear grouped under that category name in your Questions list.
Managing Categories
- Unassigning: To remove a question from a category, follow the assignment steps and select ‘Uncategorized’.
- Editing/Deleting: Category management (editing names, icons, or deleting) is handled by organization administrators in the account settings.
Selecting Fields
- Drag a field from the filter section (the top of the SwiftQuery canvas)
- Set the filter comparison values and filter groups as desired.
Aggregations and Filters
-
Tap and hold a field to see available aggregations and filters, including. Available aggregations and filters are:
-
SUM displays the sum of all numeric values
-
COUNT displays the number of rows in the database (which meet all the filter conditions across fields in your query)
-
AVERAGE displays the mean value across all rows in the database
-
MIN displays the minimum value across all rows in the database
-
MAX displays the maximum value across all rows in the database
-
PERCENTILE displays the selected percentile of the numeric values in the dataset
-
GROUP BY groups rows that have the same value – useful for summarizing results by a category (e.g. “Sales by City” if those cities are represented multiple times in a table)
-
SHOW TOTALS shows subtotals for Sum, Count, and Count Distinct under ‘Group By’ fields
New Features:
- Window Size: Specify the window size to control the data scope within your tables. This lets you manage how many groups are displayed and consolidate less common values into an “other” category for better clarity.
- Grouping: By default, you’ll see 10 groups with 9 main groups and the rest categorized as “other.” You can change the number of groups by updating the value.
- ‘Partition By’: Enhanced support for the ‘partition by’ clause enables more efficient data partitioning and the ability to handle more complex calculations in calculated fields on the Y-axis when displaying charts.
- When a Condition is Met lets you filter rows:
- Equals only returns results which match the value you input (e.g. “City equals ‘New York’” will return results only where the city field for that row equals New York)
- Does Not Equal returns results which do not match the value you input (e.g. “City does NOT equal ‘New York’” would return all cities except New York)
- Greater than returns results which are greater than the value you input
- Greater than or equal returns results which are greater than or equal to the value you input
- Less than returns results which are less than the value you input
- Less than or equal returns results which are less than or equal to the value you input
- Between returns results which are between the two values you specify. For date fields this will be two dates and Zing will display a date selector to easily select dates.
- Includes returns results which include part or all of the value you input. For instance “City includes ‘San’” would return “San Francisco” and “San Diego” if those values are present in the data.
- Excludes returns results which do not include any of the value you input. For instance “City excludes ‘San’” would return all cities which do not contain “San” in their name so “New York” and “Boston” would be part of the result set, but “San Diego” and “San Francisco” would not
-
NEW: Filters now support up to 6 layers of nesting within filter groups. This feature is compatible with both natural language and visual query inputs.
Note that not all fields will show all of the aggregations mentioned above because Zing only shows the aggregations which are relevant – for instance a string field won’t show “greater than” or “less than” as an option because those are only relevant for dates and numeric fields.
If you are using the visual query editor, up to 50 data points will be shown with one group-by selected, and up to 1,000 data points will be shown with two group-bys selected. This will be indicated at the top of the screen as ‘partial results’ and if you’d like you can modify your question or tap ‘full results’.
Dates and Date Operators
If your database has a date, time, or timestamp field, Zing will show date-specific functionality for filtering and will give you options for grouping by different time scales.
Timestamp fields will by default be shown by day. This means if you GROUP BY a timestamp field, Zing will consider all the timestamps in a given day to be part of that day. You can specify the time scale you’d like – with options for second, minute, hour, day, week, month, and year.
To choose the time scale for a given field, first drag the time field to the SwiftQuery canvas, then tap the field for date aggregation options:
To limit the date range of your query you can simply select the date range you want on the pop-up calendar using the following conditions for dates:
- Before lets you specify a date and time with results limited to records before that date/time.
- After lets you specify a date and time with results limited to records after that date/time.
- Between lets you tap between two dates on a calendar to limit the results to that date range
- Not Between lets you tap between two dates on a calendar to exclude results from that time range. This can be useful if, for instance, data was incorrect for a given time range.
- Week to date / Month to date / Quarter to date / Year to date display the dates up to today for the period you’ve specified and that date is always evaluated at run-time, so if you were to run this next year you’d see data relevant for next year.
- Current week / current month / current quarter / current year display all the dates within the current period referenced.
If the date/time options outlined above are not showing up for a given field, that field is likely not classified as a date, time, or timestamp.
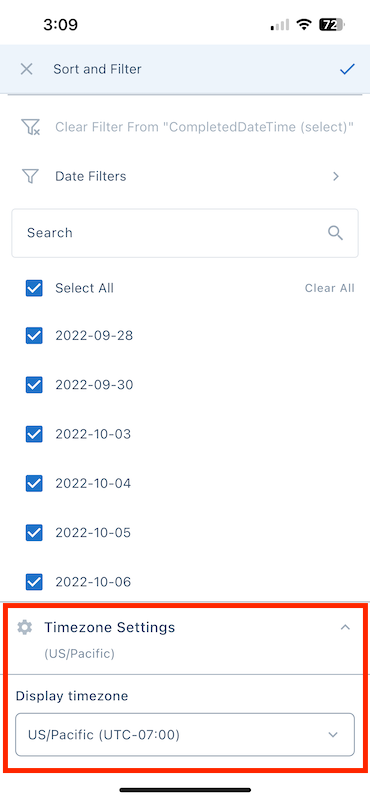
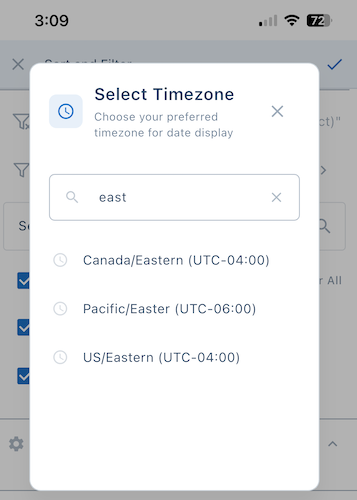
Time Zones
If you have fields that contain a time zone, Zing supports showing any time filters or comparisons for any time zone you wish, and defaults to the time zone you are accessing the question from (though this is changeable from a drop-down) . This lets you see - for instance - the operational logs in a specific time range based on where you are.
Of course, many situations don’t require using a time zone attribute on a date - for example simple day-level rollups are common with DATE fields. You can also have TIMESTAMP or DATETIME fields without time zones (in which case Zing just does everything in a no-timezone space).
But when you have a time zone indicator on your fields, operating in UTC versus a relevant time zone leads to different results.
TIMESTAMPTZ (in PostgreSQL) and TIMESTAMP (in mySQL), and DATETIMEOFFSET (SQL Server) are timezone aware and will now show a time zone selector in Zing.
Time zone selection is available when you apply a filter on a timestamp / date time field from filter settings, or from the filter at the top of a data table.
Calculated Fields
Create calculated fields by tapping ‘Calculated Field’ below the field names on the question screen.
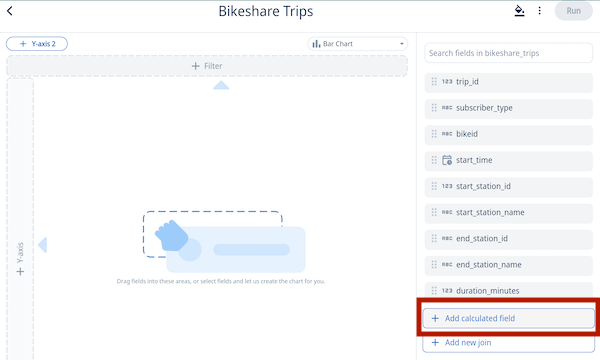
You’ll then name the field (avoiding the use of spaces), and the calculation. As you type, a autocomplete typeahead will display aggregations and fields.
You can mix and match fields and aggregations in a calculated field. For example, use calculated fields to compute a weighted average, a percentage, or CASE logic.
A question can have multiple calculated fields. To remove a calculated field, tap the ‘X’ on that field, and to edit it, tap ’edit’.
Search
From the main screen, you can search any table names using the search bar at the top of the app.
Once you’ve tapped on a table, you’ll see all fields in that database. You can search across all fields using the search bar at the top of the screen.
SwiftQuery Interactive Question Builder
Once you’ve tapped on a table, tap the three dot overflow menu in the top right and select ‘drag and top editor’. Then simply hold and drag field names (shown in the bottom sheet) to the x-axis, y-axis, filter, or dimension drop targets.
The chart will update as you make changes and drag new fields onto the chart.
Natural language querying (text-to-question)
From iOS, Android, and the Web simply:
- Create a Zing Data account
- Add a data source from iOS, Android or web versions of Zing
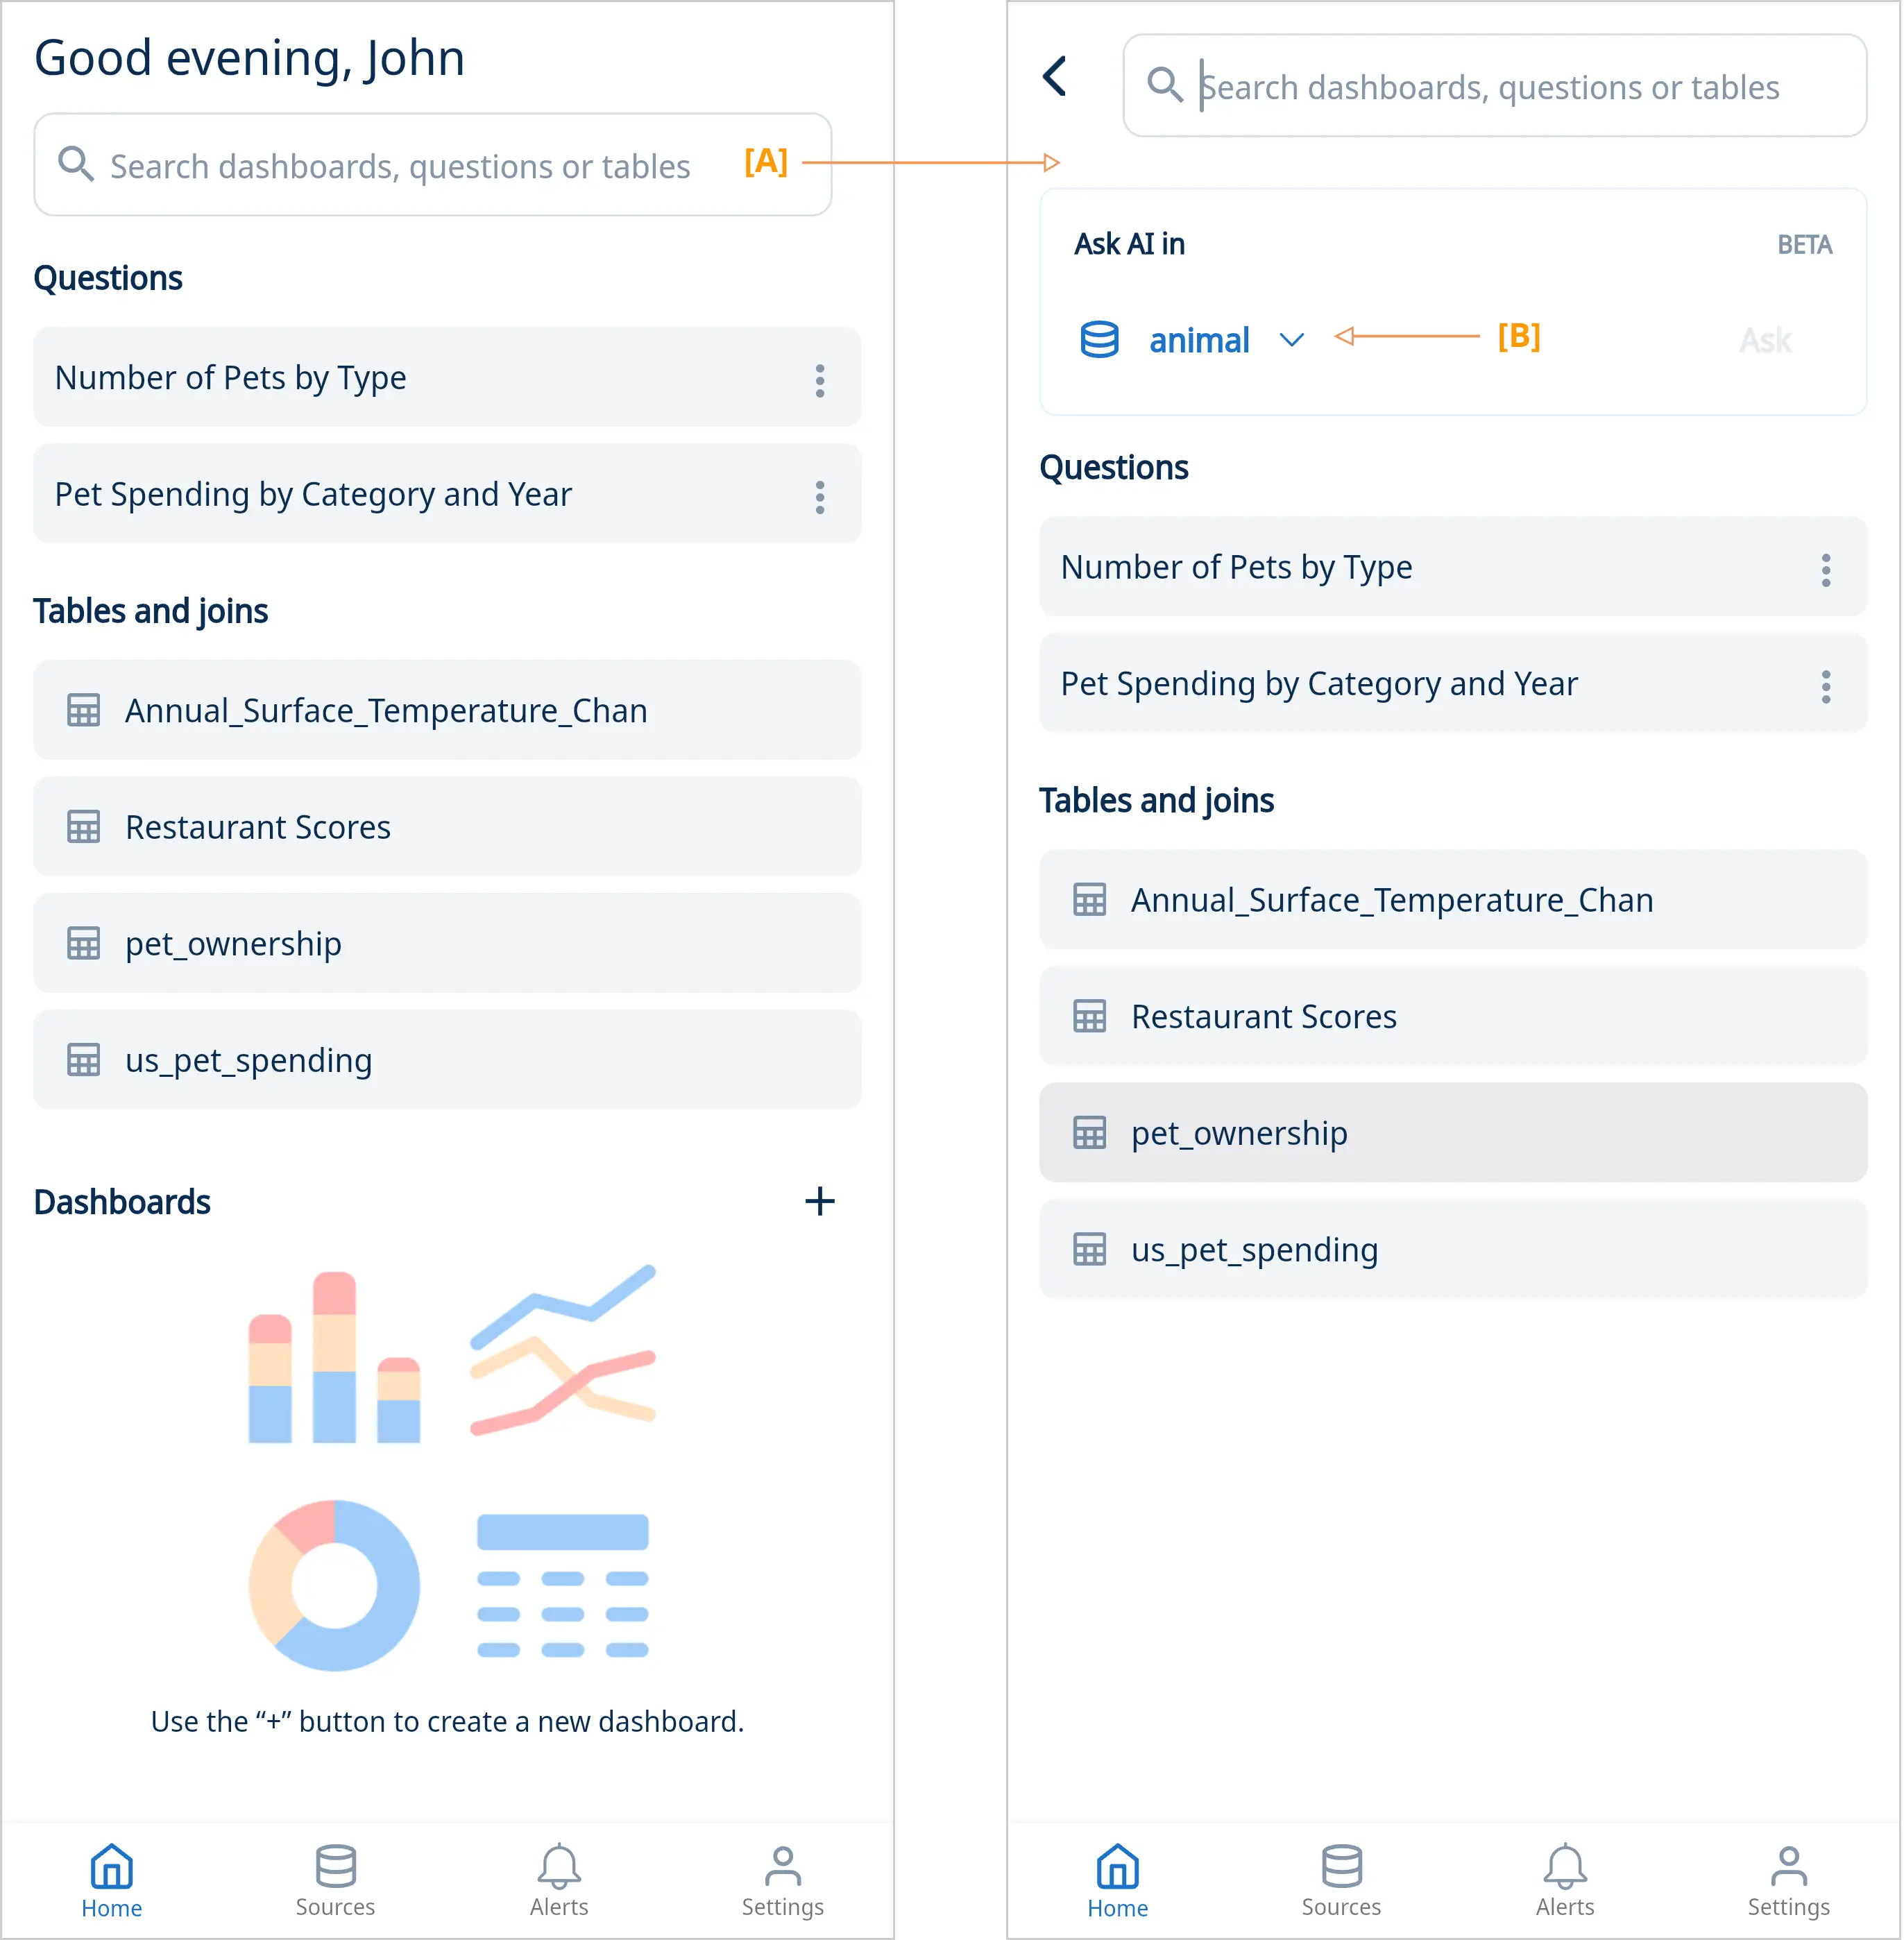
- On the home screen tap the search box [A] to get started. Select the data source you want to ask questions in [B] and enter your query. Tap “Ask” or “Done” on your mobile keyboard to submit your question.
- Your question will run using a large language model trained on english to query contruction against your data source.
- You’ll see a visualization or table of your question. If AI can’t understand your question, you’ll want to ask it in a different way or use the visual query editor, or custom SQL editor. Questions can join data from across tables within a data source but joins across multiple data sources are not supported.
- From here, you can save down chart images as PNGs, export query results as CSVs, mention or invite colleagues, or set up real-time push notifications and emails so you’re alerted when data changes or hits a threshold.
Helper text
Helper text guides your team members in knowing what type of questions they can ask about a data set.
To add helper text:
- Go to ‘Data Sources’ and click on ‘Settings’.
- Tap on the ‘Helper Text’ tab and select ‘Add New Helper Text’.
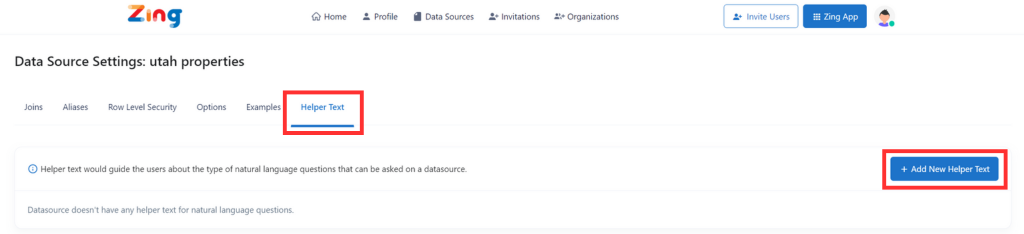
- Type in a question and save it. You can add as many sample questions as you’d like! This will help your team members know what kind of questions they can ask about the data set.
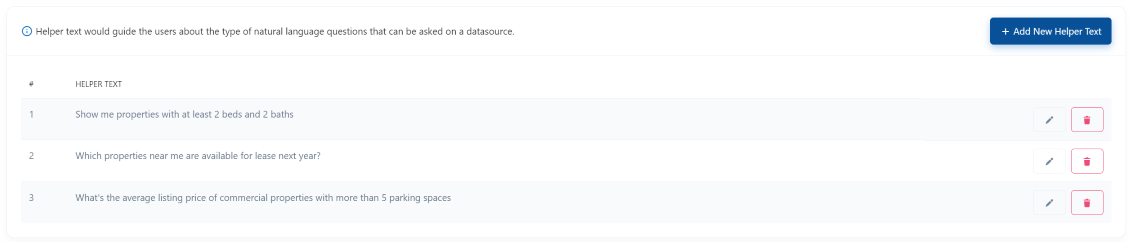
The helper text you’ve added will loop through the search bar as you’re about to key in a question.
Value typeahead
Value typeahead disambiguates values, fields and tables, enabling you to complete your question in a straightforward manner.
For instance, if you’re trying to find customer addresses, do you want the billing address or shipping address? Zing’s typeahead will prompt you with these suggestions, letting you decide the exact value you need.
Here’s how it works:
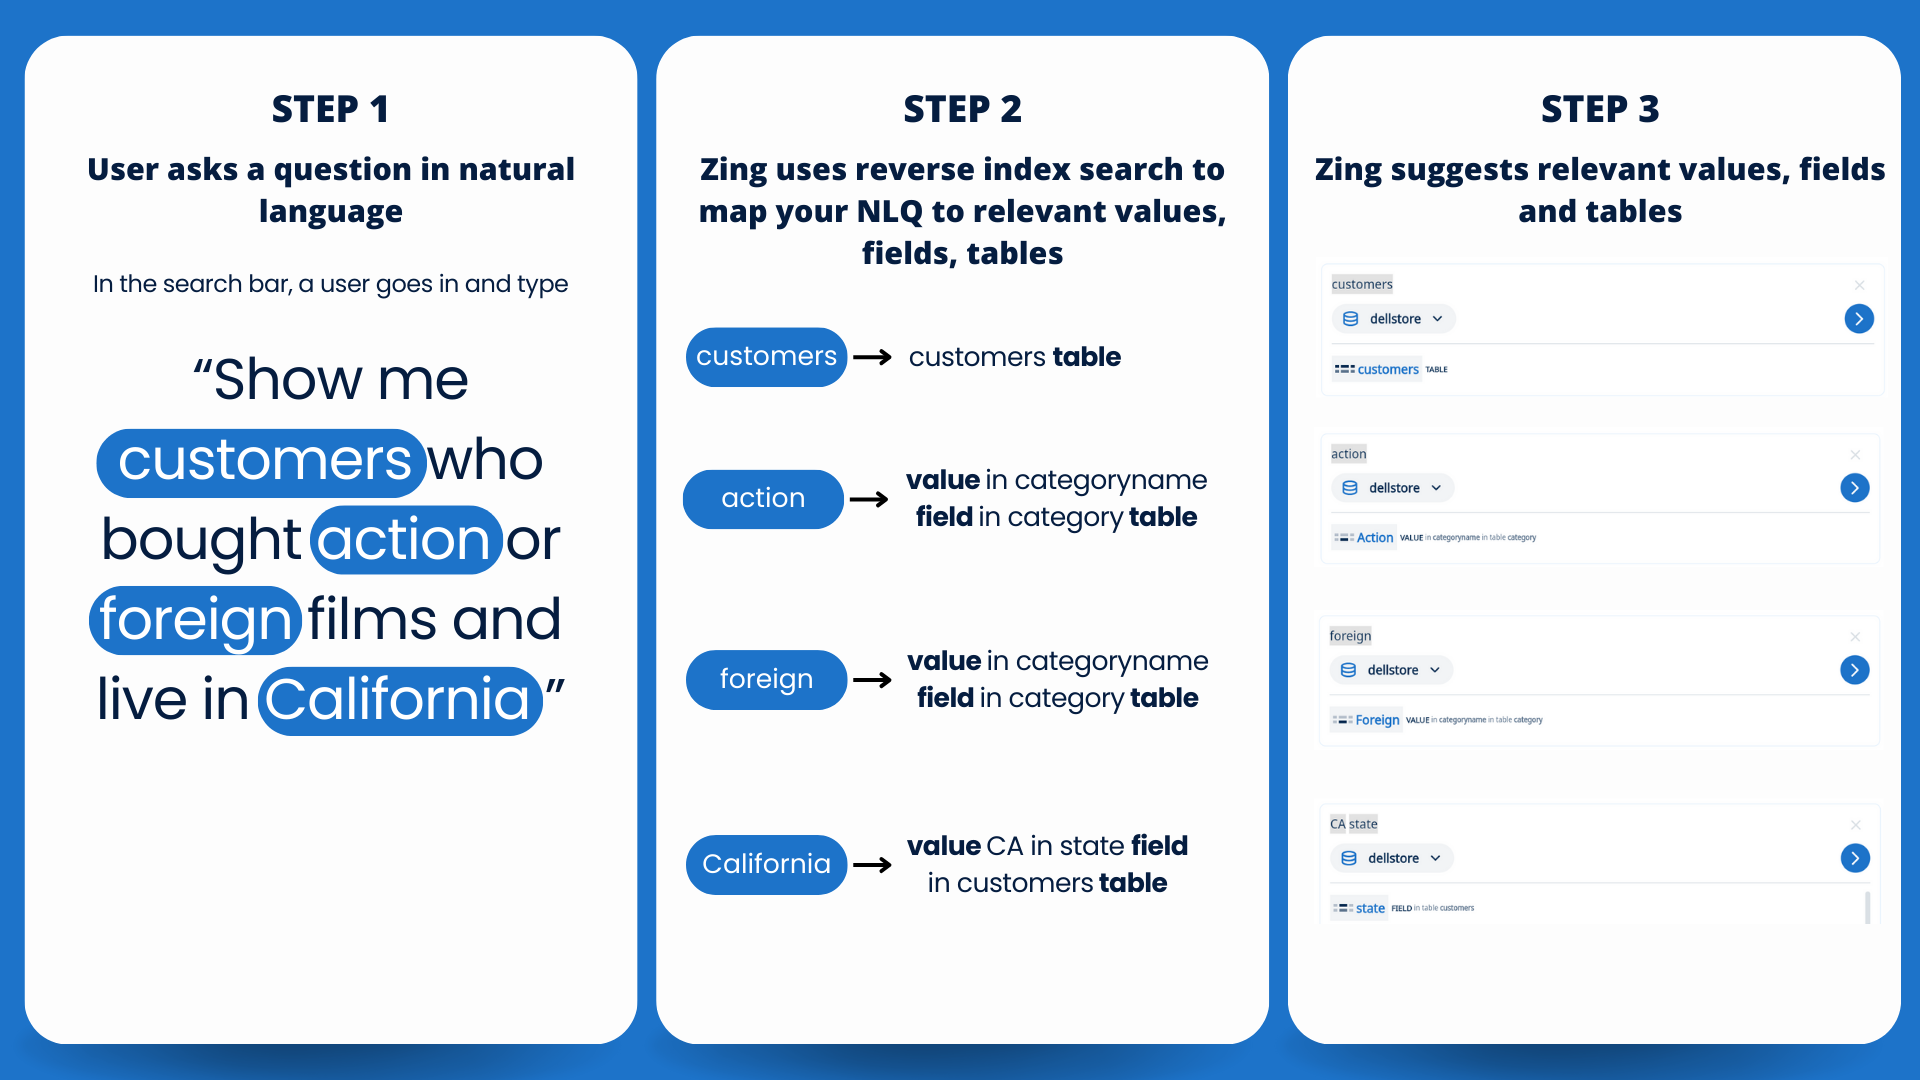
As you’re typing a question, Zing automatically suggests relevant values, fields and tables by doing a reverse index search.
We could ask, “Show me customers who bought action or foreign films and live in California.”
As you’re typing, Zing shows you:
- ‘action’ is a value in the field ‘categoryname’ in the table ‘category’
- ‘foreign’ is a value in the field ‘categoryname’ in the table ‘category’
- ‘CA’ is a value in the field ‘state’ in the table ‘customers’
And if you decide to switch categories from ‘action’ to ‘horror’ mid-query, Zing will update its suggestions, now showing you:
- ‘horror’ is a value in the field ‘categoryname’ in the table ‘category’
This helps you select the exact value you need without recalling its location. It helps avoid confusion and ensures you’re querying the right data, even in large datasets with overlapping values.
Note: value typeahead is only available on Zing’s Enterprise plan.
Notes specific to charts created from the visual question builder
If you run a question that returns a lot of results, sometimes Zing can’t display all the results (nobody wants a billion of individual rows sent to their phone). A things happen behind the scenes for questions asked using the visual question builder:
- When the number of data points on the X-axis is greater than 50, Zing samples results:
- For chronological data, the most recent 50 data points are shown
- For everything else, the top 50 data points with the highest chart values are shown
- When 2 GROUP BY columns are selected, Zing limits the number of categories shown for one of the GROUP BY columns:
- If one of the GROUP BY columns is a date/time type, we use it for the X-axis and limit the values for the other GROUP BY column. These values are currently limited to the top 20 with highest Y-axis values for each X-axis value.
- A maximum of 1,000 data points is shown if two GROUP BYs are specified.
To view all results, you can tap the drop-down on the top left and select ‘Full Results’ to see a data table view of the full results set.
Custom SQL
You can also use the Zing Custom SQL editor for more sophisticated use cases. A helpful typeahead that auto-completes popular aggregations like (SUM, COUNT, MIN, MAX, GROUP BY, etc.), and field names.
Using the custom SQL creation mode, you can also join across tables from the same data source as well.
To access the custom SQL typeahead:
- Select a table from the home screen
- Tap the three dots in the upper left and then ‘Write custom SQL’
- Write your query and then tap ‘Run’ Note: If the administrator of your organization’s account has disabled custom SQL, you won’t see this option.
You can control which fields from your custom SQL query are graphed on the X-axis or Y-axis by using a special aliasing in Zing.
- To ensure a field is graphed on the X-axis, add the “_x1” alias to your field in custom SQL. If you also specify “_x2” that _x2 field will be used as the ‘cut’ or ‘split’ for the x-axis field.
- To ensure a field is graphed on the Y-axis, add the “_y1”, “_y2”, “y3”, alias to your field name in custom SQL. The underscore and axis designation in your alias won’t show up in your graph titles, but are used to indicate which axis you want a field graphed on.
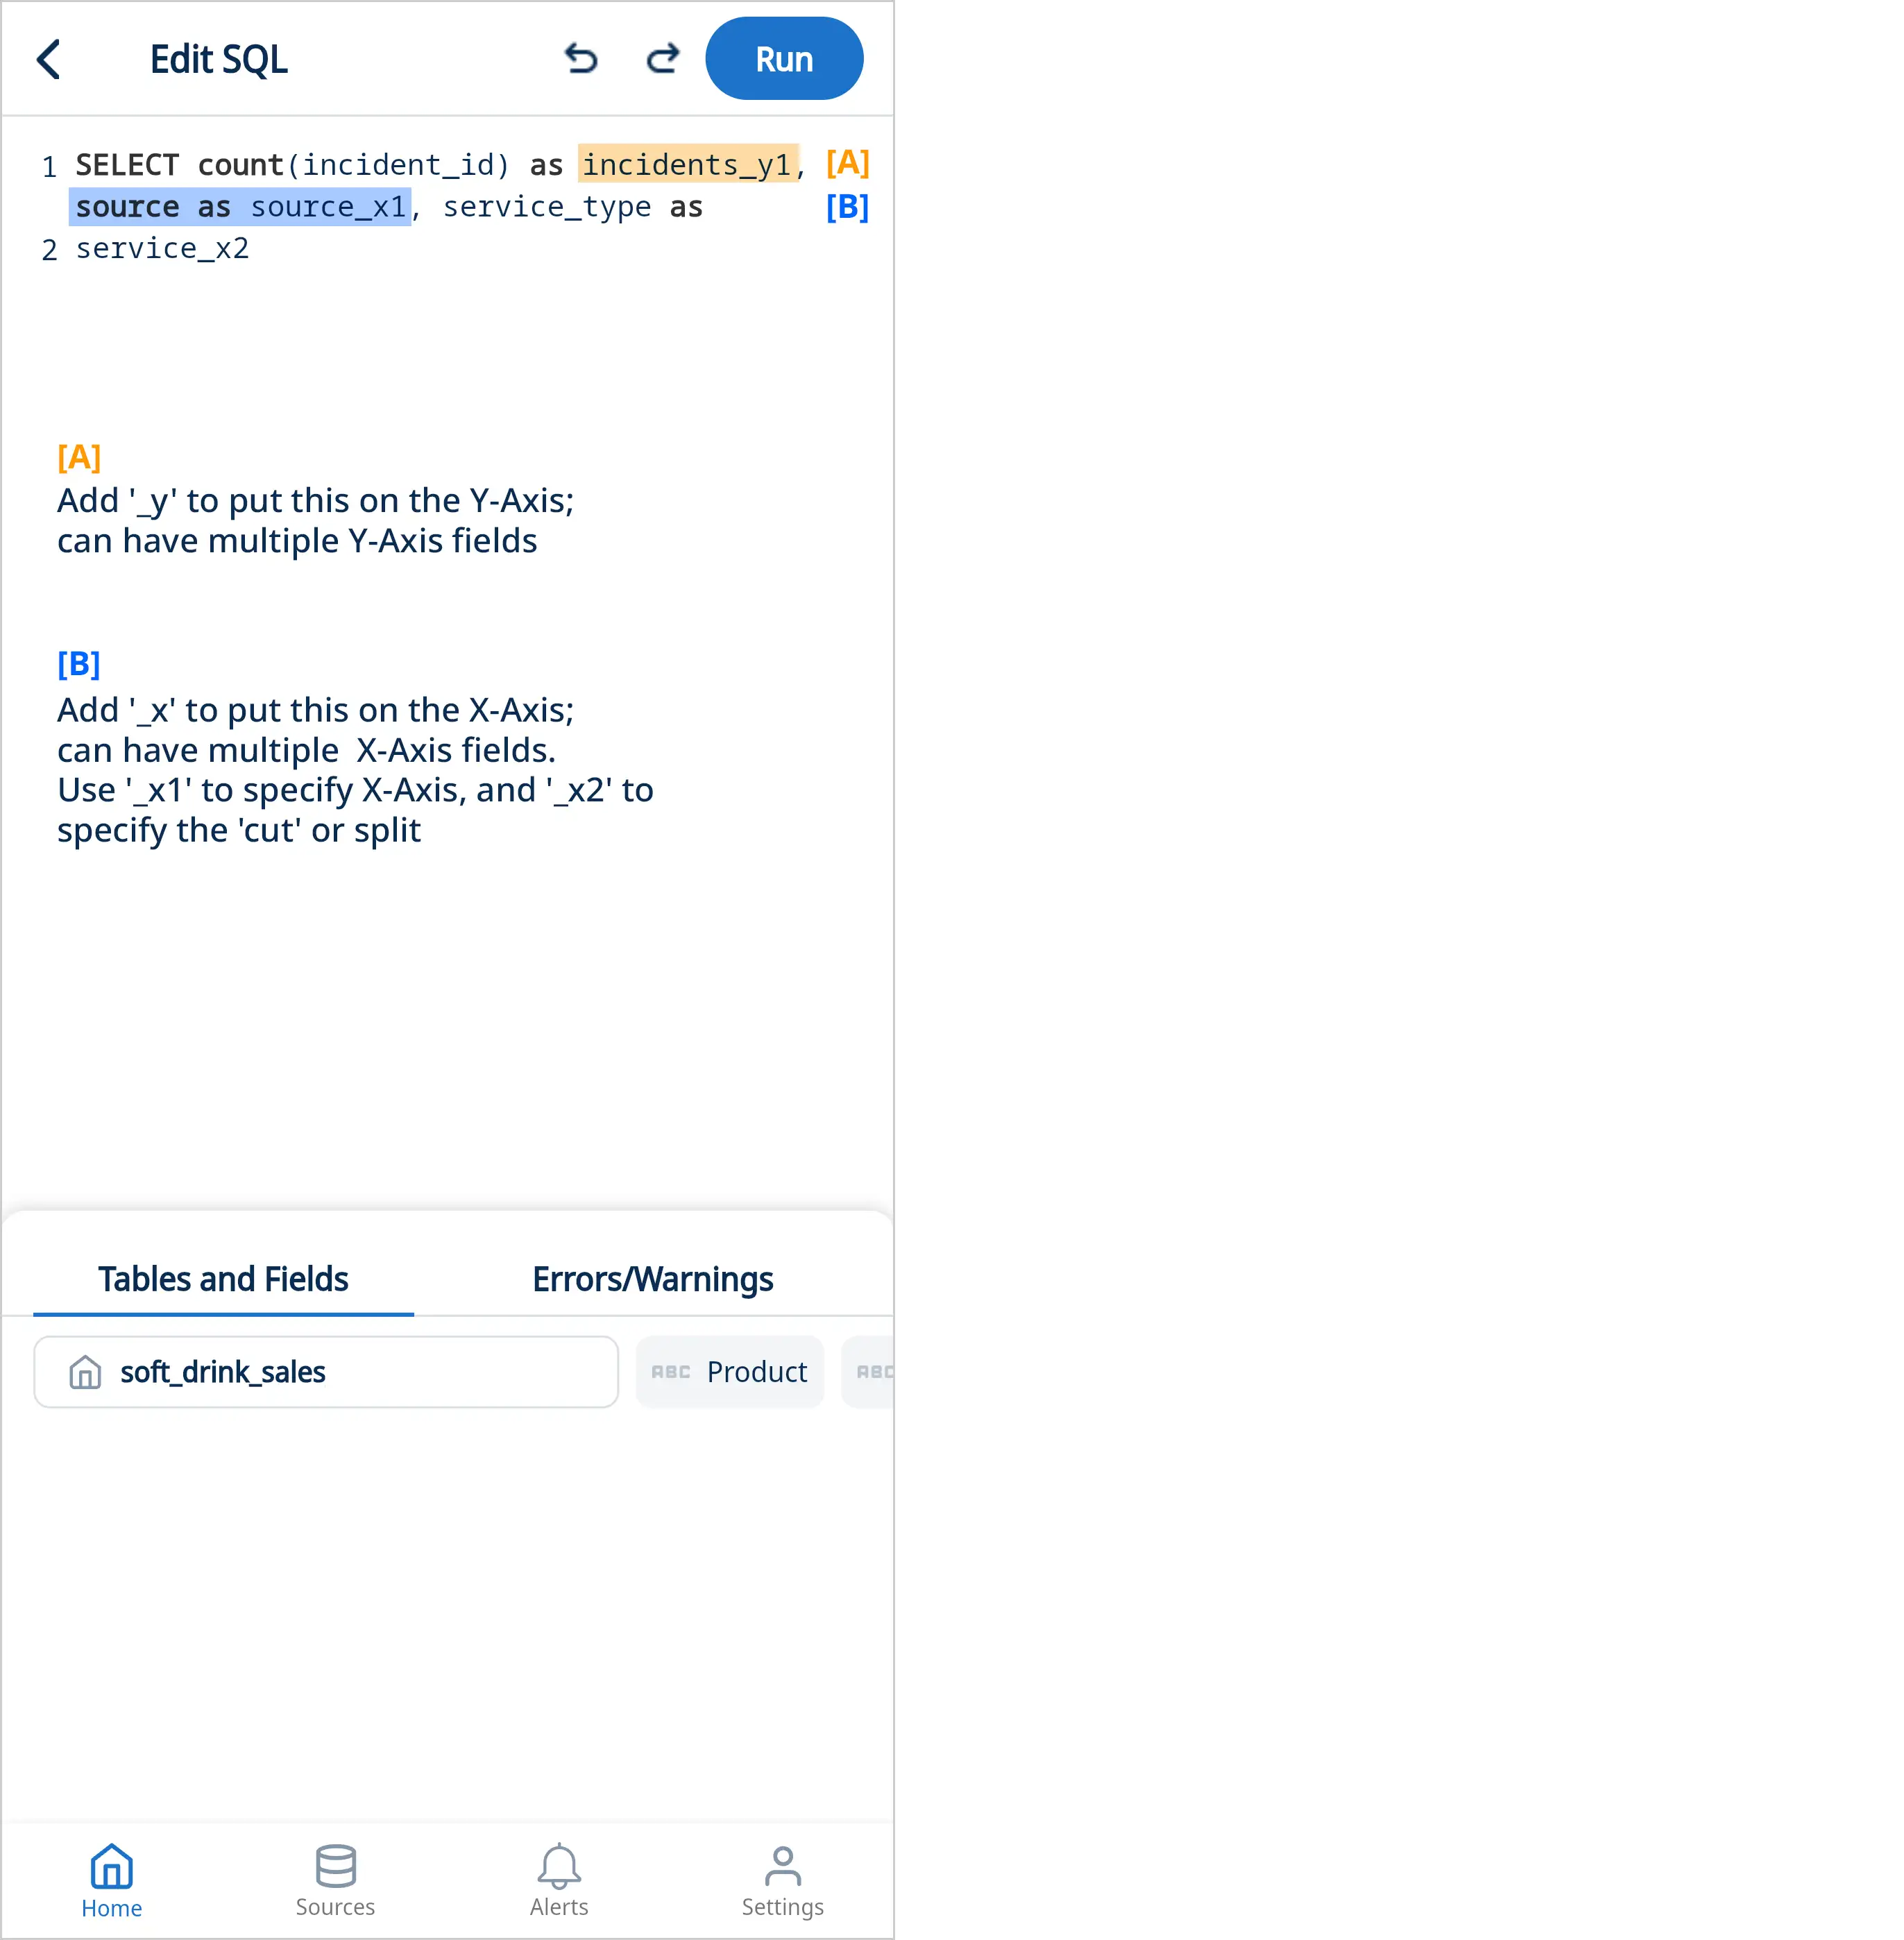
For example, changing the “_x1” and “_x2” fields in the example below swaps which field is on the x-axis and which field is used as the dimension to split by.
Note that for custom SQL:
- The SQL typeahead shows fields and popular aggregations. It does not show all aggregations your underlying data source may support, but you can still use those in the custom SQL mode. For instance if you want to extract a JSON value and your data source is Google BigQuery, you’d use JSON_EXTRACT but if your dats source is Snowflake, you’d use JSON_EXTRACT_PATH.
- Only ‘select’ statements are supported. Insert / Update / Create / Drop are not.
- For Google BigQuery data sources, tables are referenced as ‘project_id.schema.tablename’ – for instance light-quest-122122.austin_bikeshare.bikeshare_trips
Live Results vs. Caching
By default, Zing live-queries your data as you ask questions, view queries, or deep-dive. This ensures that results are always up-to-date, and allows for real-time alerting.
However, you can also turn on results caching. This temporarily stores the result of a question so that if you view the question again in a short period of time, the question doesn’t need to re-run.
This has the advantage of reducing compute for questions which are accessed frequently. If you access a question after the cache duration, the question will live-run the question and store its result for the cache duration specified.
You can set the length of time to cache a question’s results and typically this should be aligned to the update frequency of your underlying data. For instance, if your underlying data is updated once every 30 minutes, a cache duration of 30 minutes would be appropriate.
Switch between live mode and cache mode for a saved question by tapping ‘cache settings’ from the three dots in the upper right.
4.1 - Advanced Voice Mode
You can simply ask:
- What’s our sales growth in the last quarter?
- Show me the top-performing regions by energy efficiency?
- What’s the year-over-year revenue change?
Tour
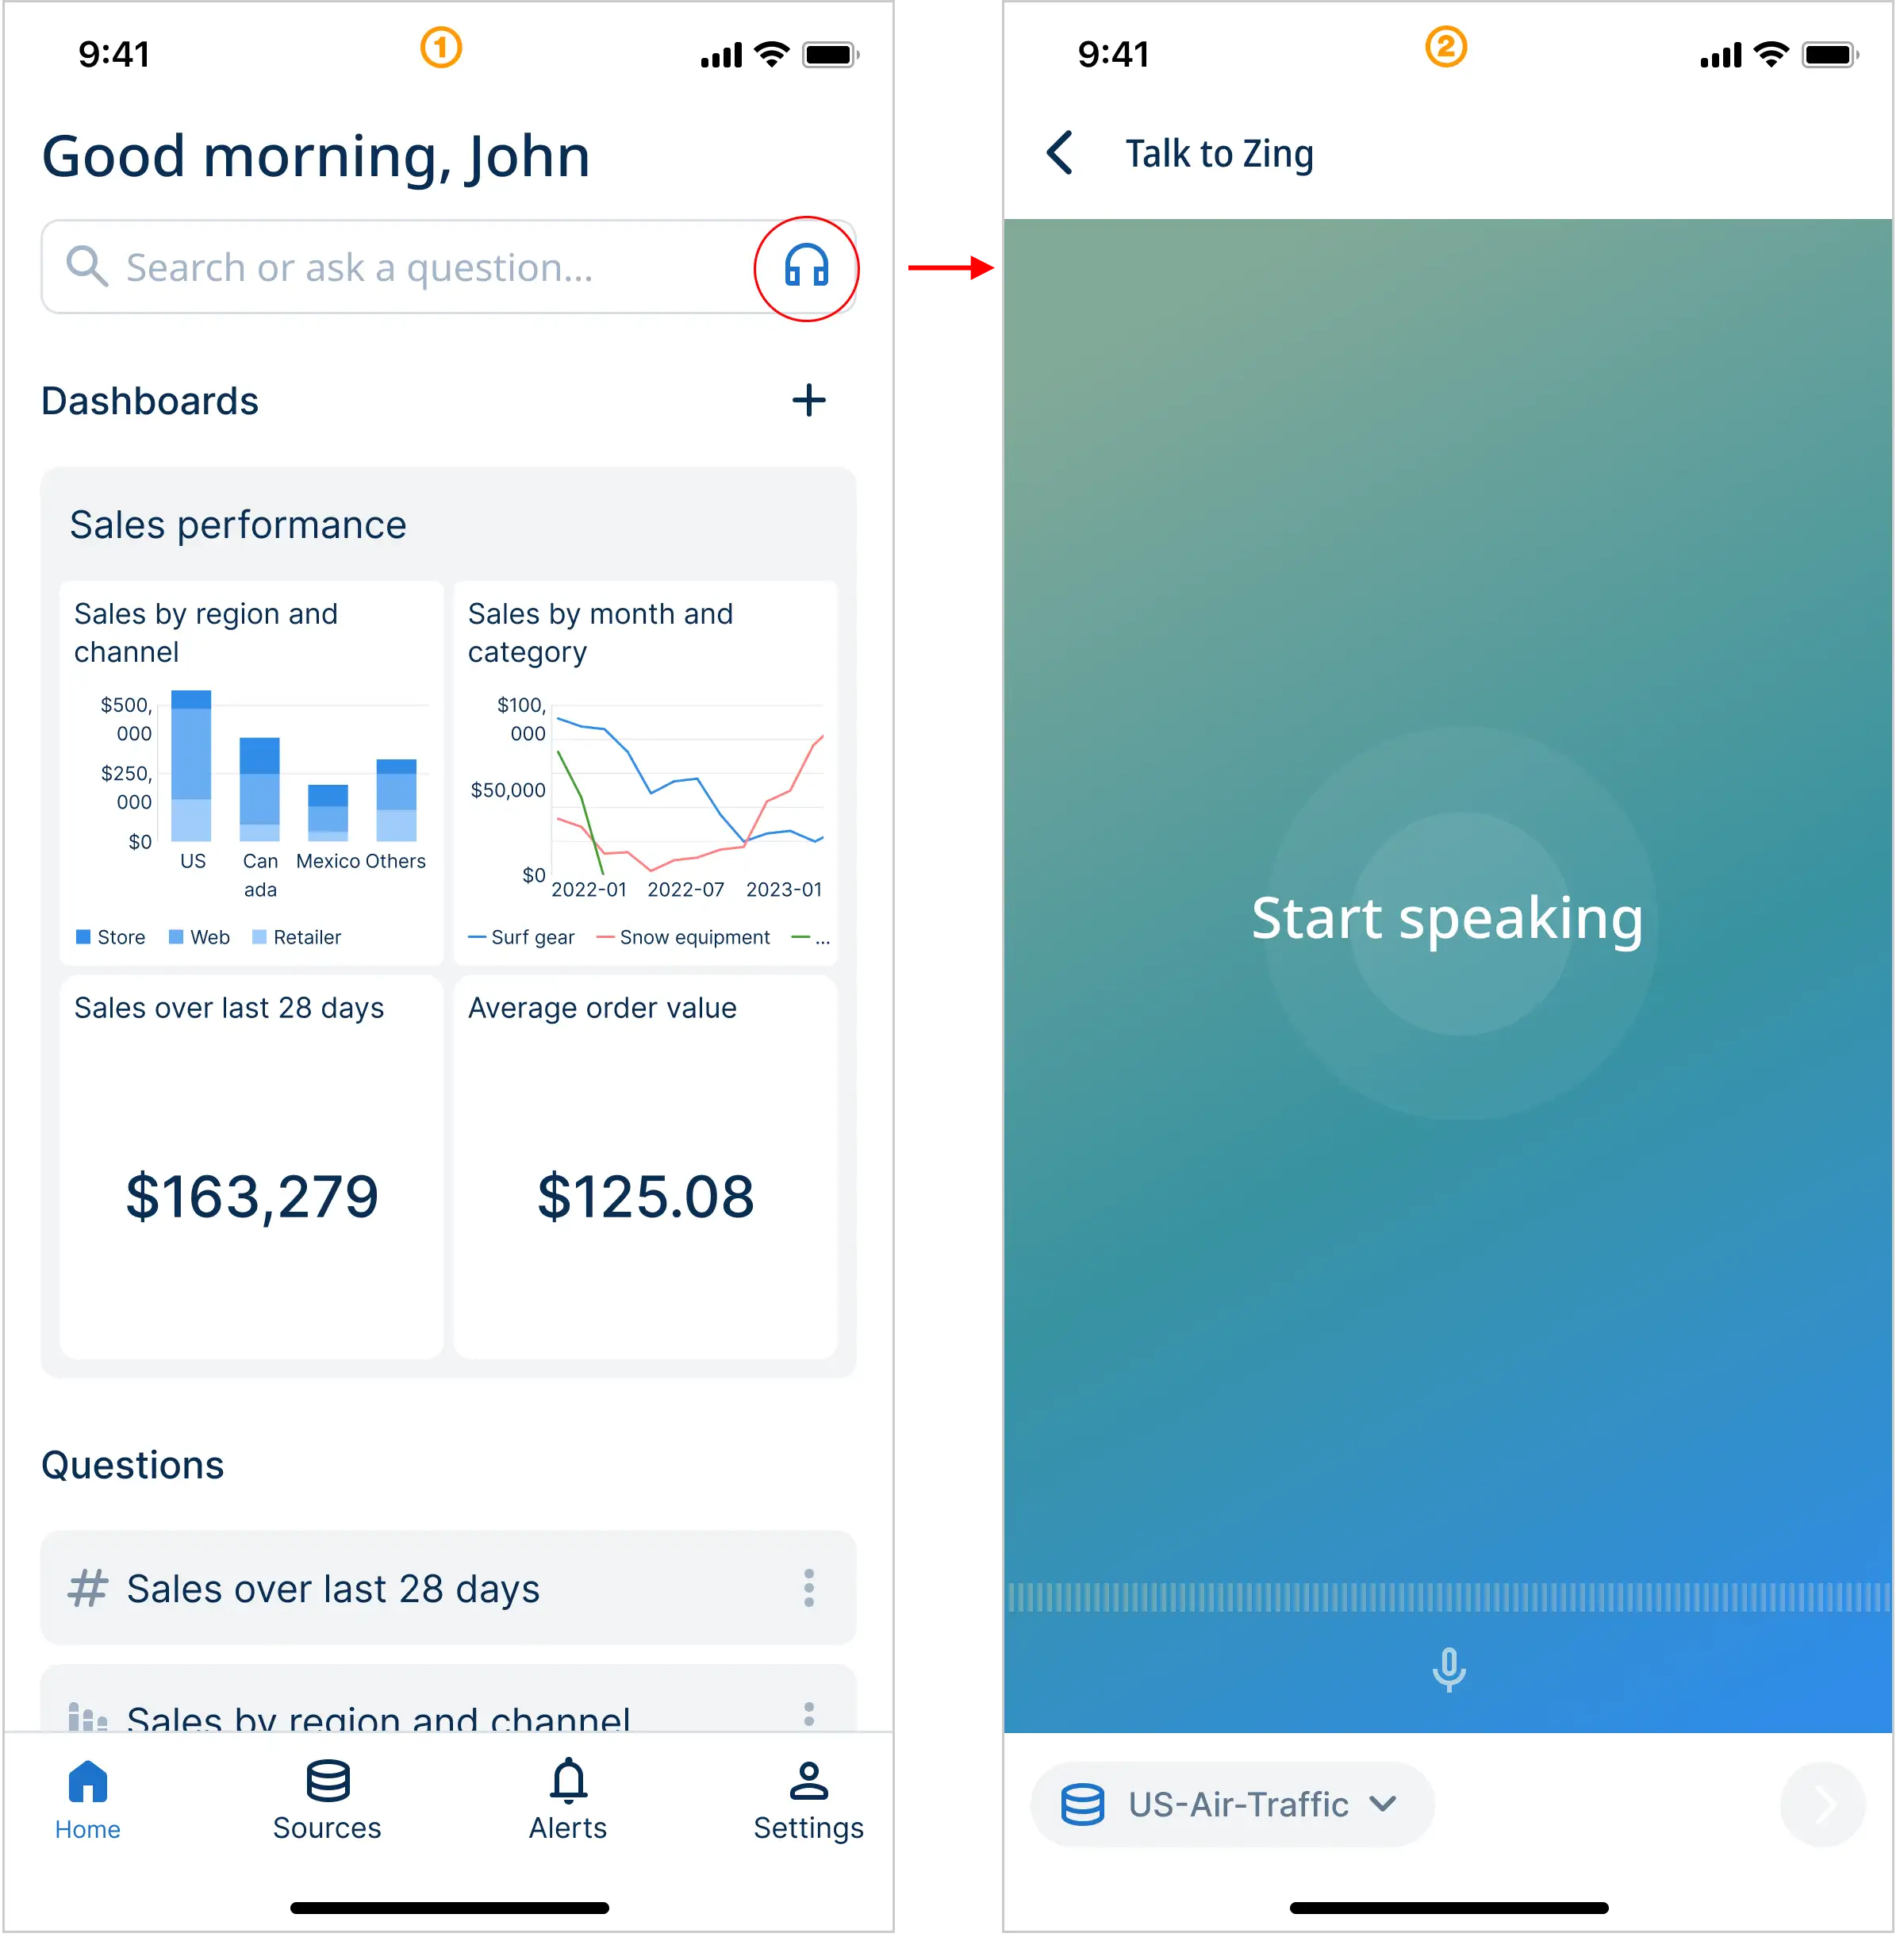
Step 1: Tap the headphone icon on the home screen [1] and speak your question [2]. Change the data source if needed in the lower left hand corner menu.
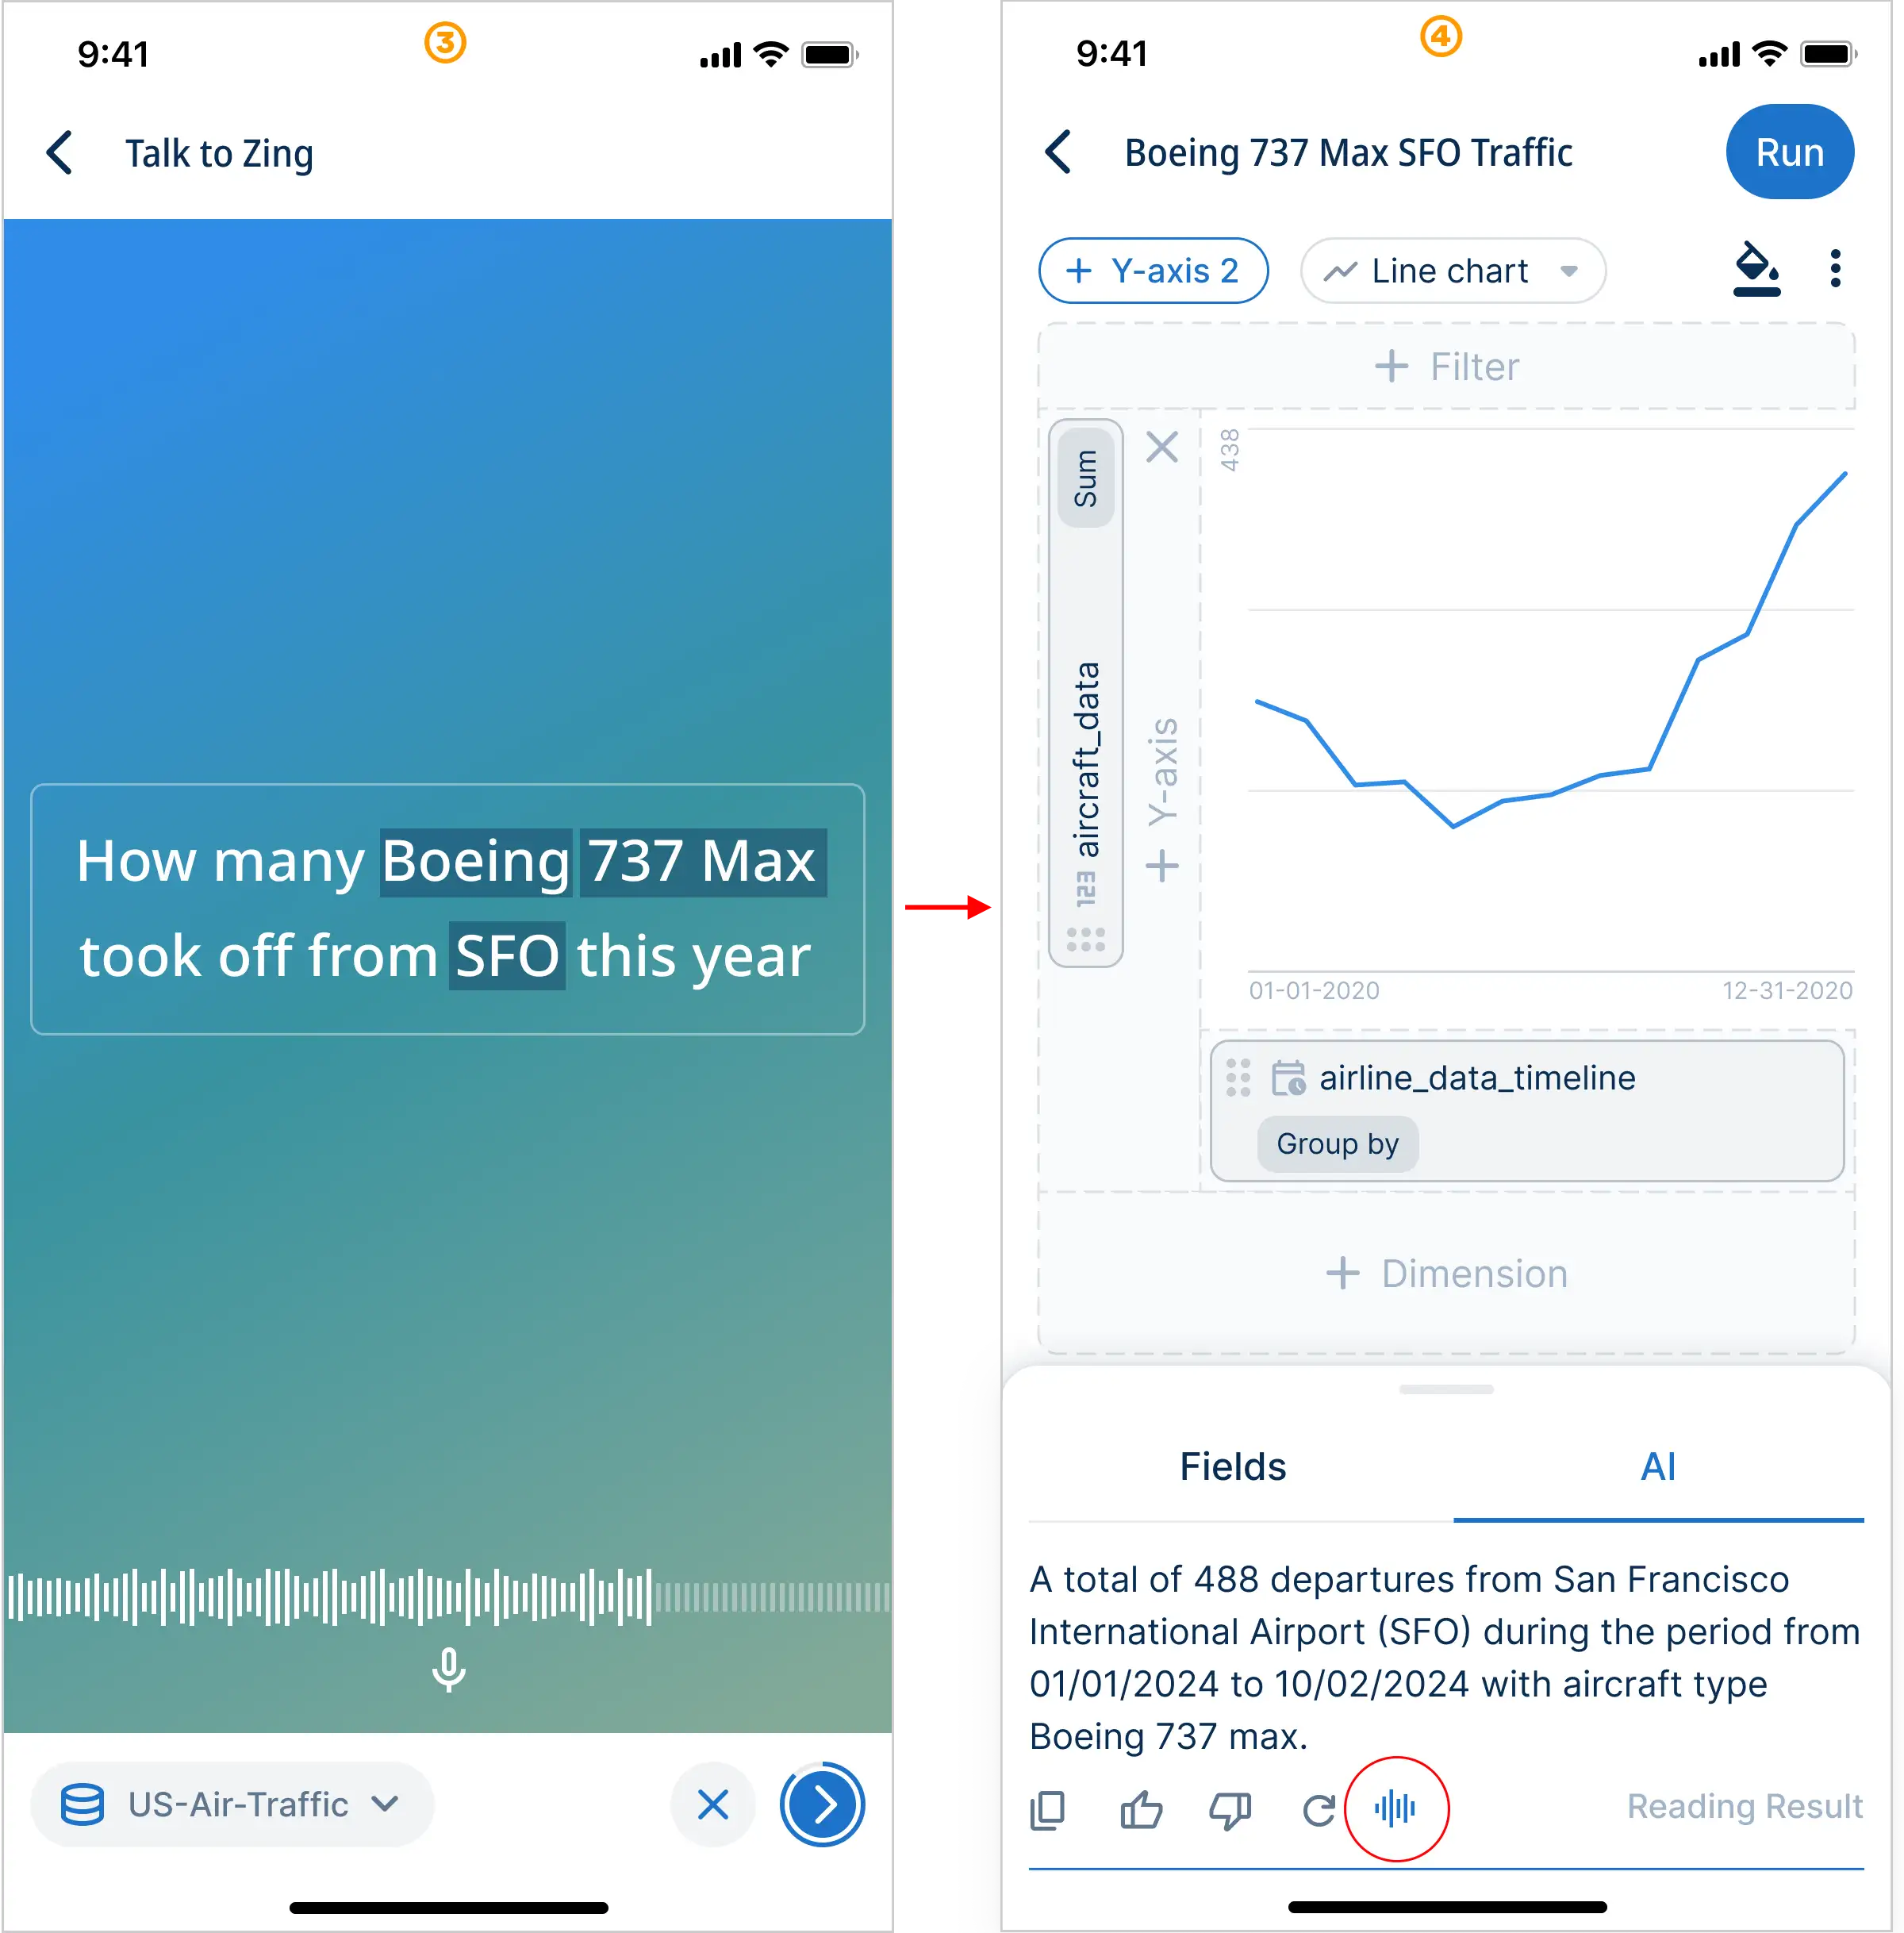
Step 2: Your spoken text will appear on the screen [3] and after 2 seconds will automatically submit and start running. Or, you can hit play to run it immediately. Tap “X” to start over at any time.
Step 3: Zing will return with an answer and read it out loud automatically [4]. Stop/Start reading out loud by touching the voice icon (highlighted with a red circle). Add or refine filters effortlessly using the intuitive drag-and-drop interface.
Next step: Touch “Run”, save your new question and share with co-workers
Demo Video
4.2 - Working with Large Data Tables
Faster Performance with Server-Side Processing
Zing Data is optimized to handle large datasets containing millions of rows without freezing your browser or degrading performance. For any query result that contains more than 2,000 rows, Zing automatically enables server-side processing.
This means that instead of loading the entire dataset into your browser at once, Zing intelligently fetches only the data you need to see. When you sort, filter, or move to the next page of results, Zing sends a new, efficient query to the database server to retrieve just the specific subset of data required.
Key Benefits:
- Speed: View, sort, and filter massive tables almost instantly
- Stability: Prevents browser crashes or slowdowns typically associated with large data loads
- Scalability: Allows for effective interaction with datasets that are far too large for traditional client-side processing
Key Features
When working with a large data table (over 2,000 rows), you will see the following controls:
1. Server-Side Pagination
At the bottom of the data table, you will find pagination controls. These allow you to navigate through your data page by page.
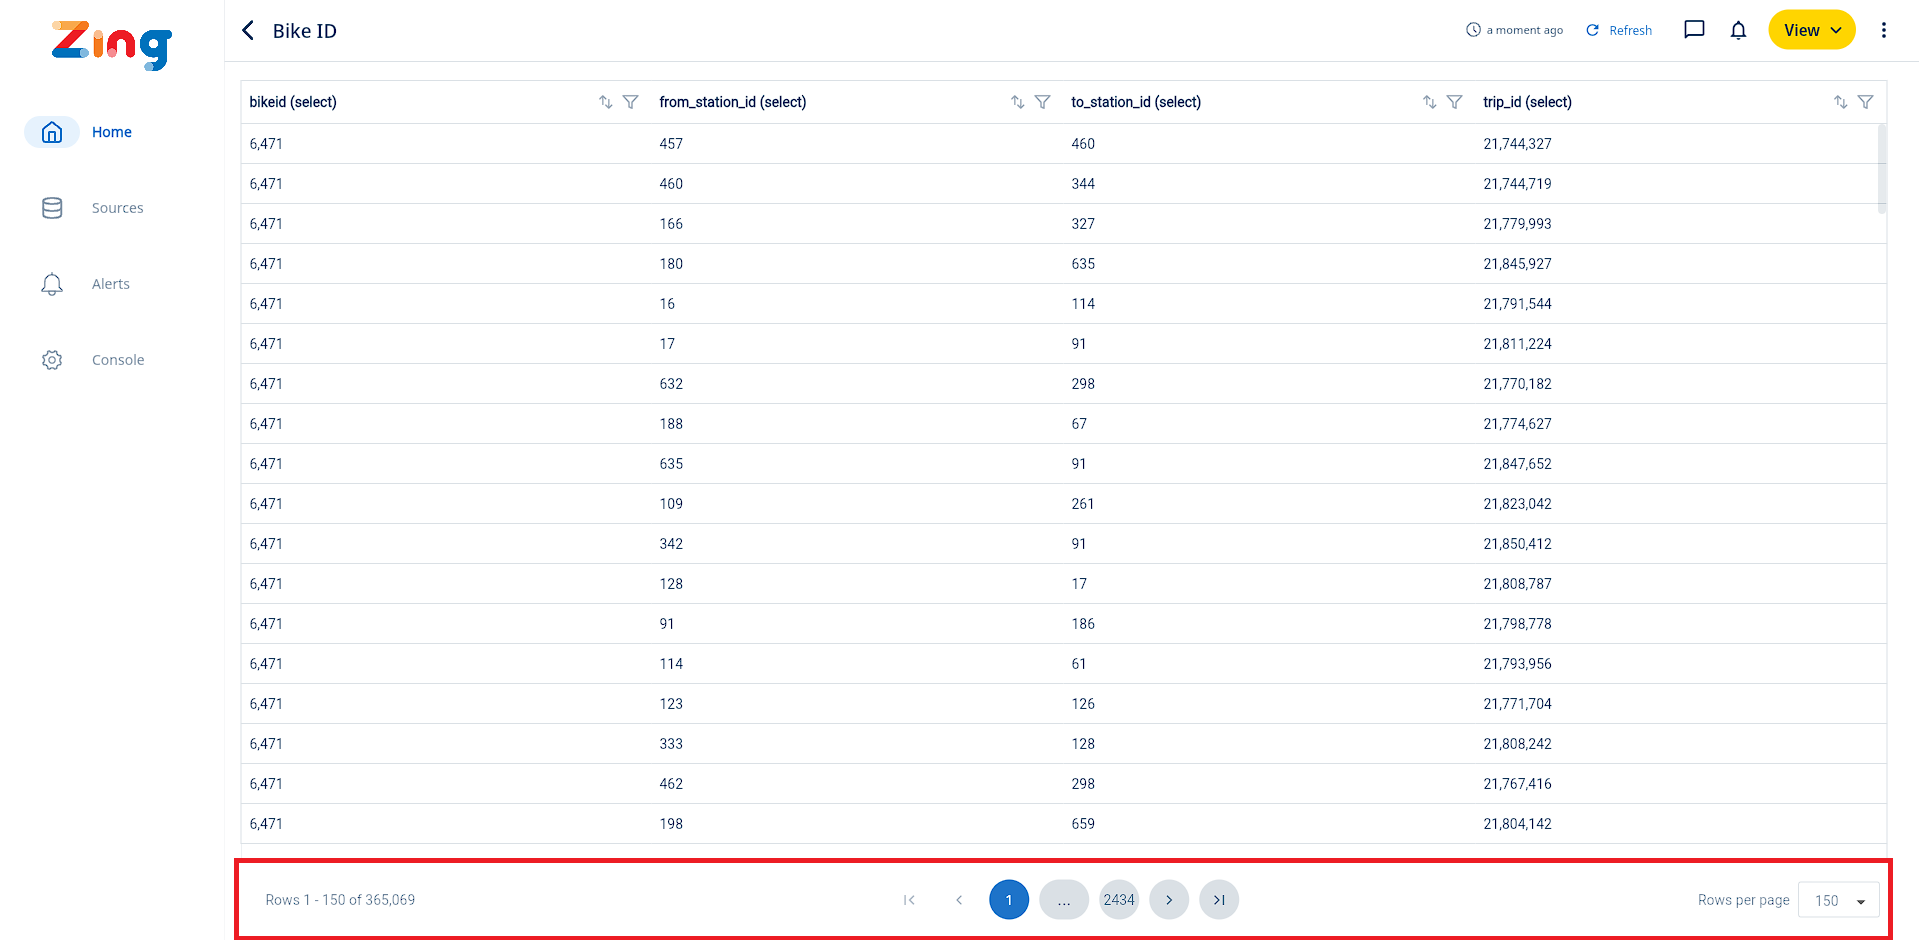
- The interface shows the current page number and the total number of pages (e.g., “Page 1 of 50”)
- You can see the range of rows currently displayed (e.g., “Rows 1-1000 of 50000”)
- Use the Next and Previous buttons to navigate between pages
2. Server-Side Sorting
You can sort the entire dataset, not just the rows you see on the current page, by clicking on any column header.
- Click a column header once to sort in ascending order
- Click the same header again to sort in descending order
- An arrow icon will appear next to the column name to indicate the current sort direction
3. Server-Side Filtering
You can apply filters to one or more columns to quickly find the data you need.
- Click the filter icon in the column header you wish to filter
- Enter your search criteria in the text box that appears
- The table will update to show only the rows from the entire dataset that match your filter criteria
5 - Chat
Key capabilities
- Ask questions in natural language, including follow-ups
- Instant chart suggestions
- Text and chart responses, which are fully visually editable
Walkthrough
Get started
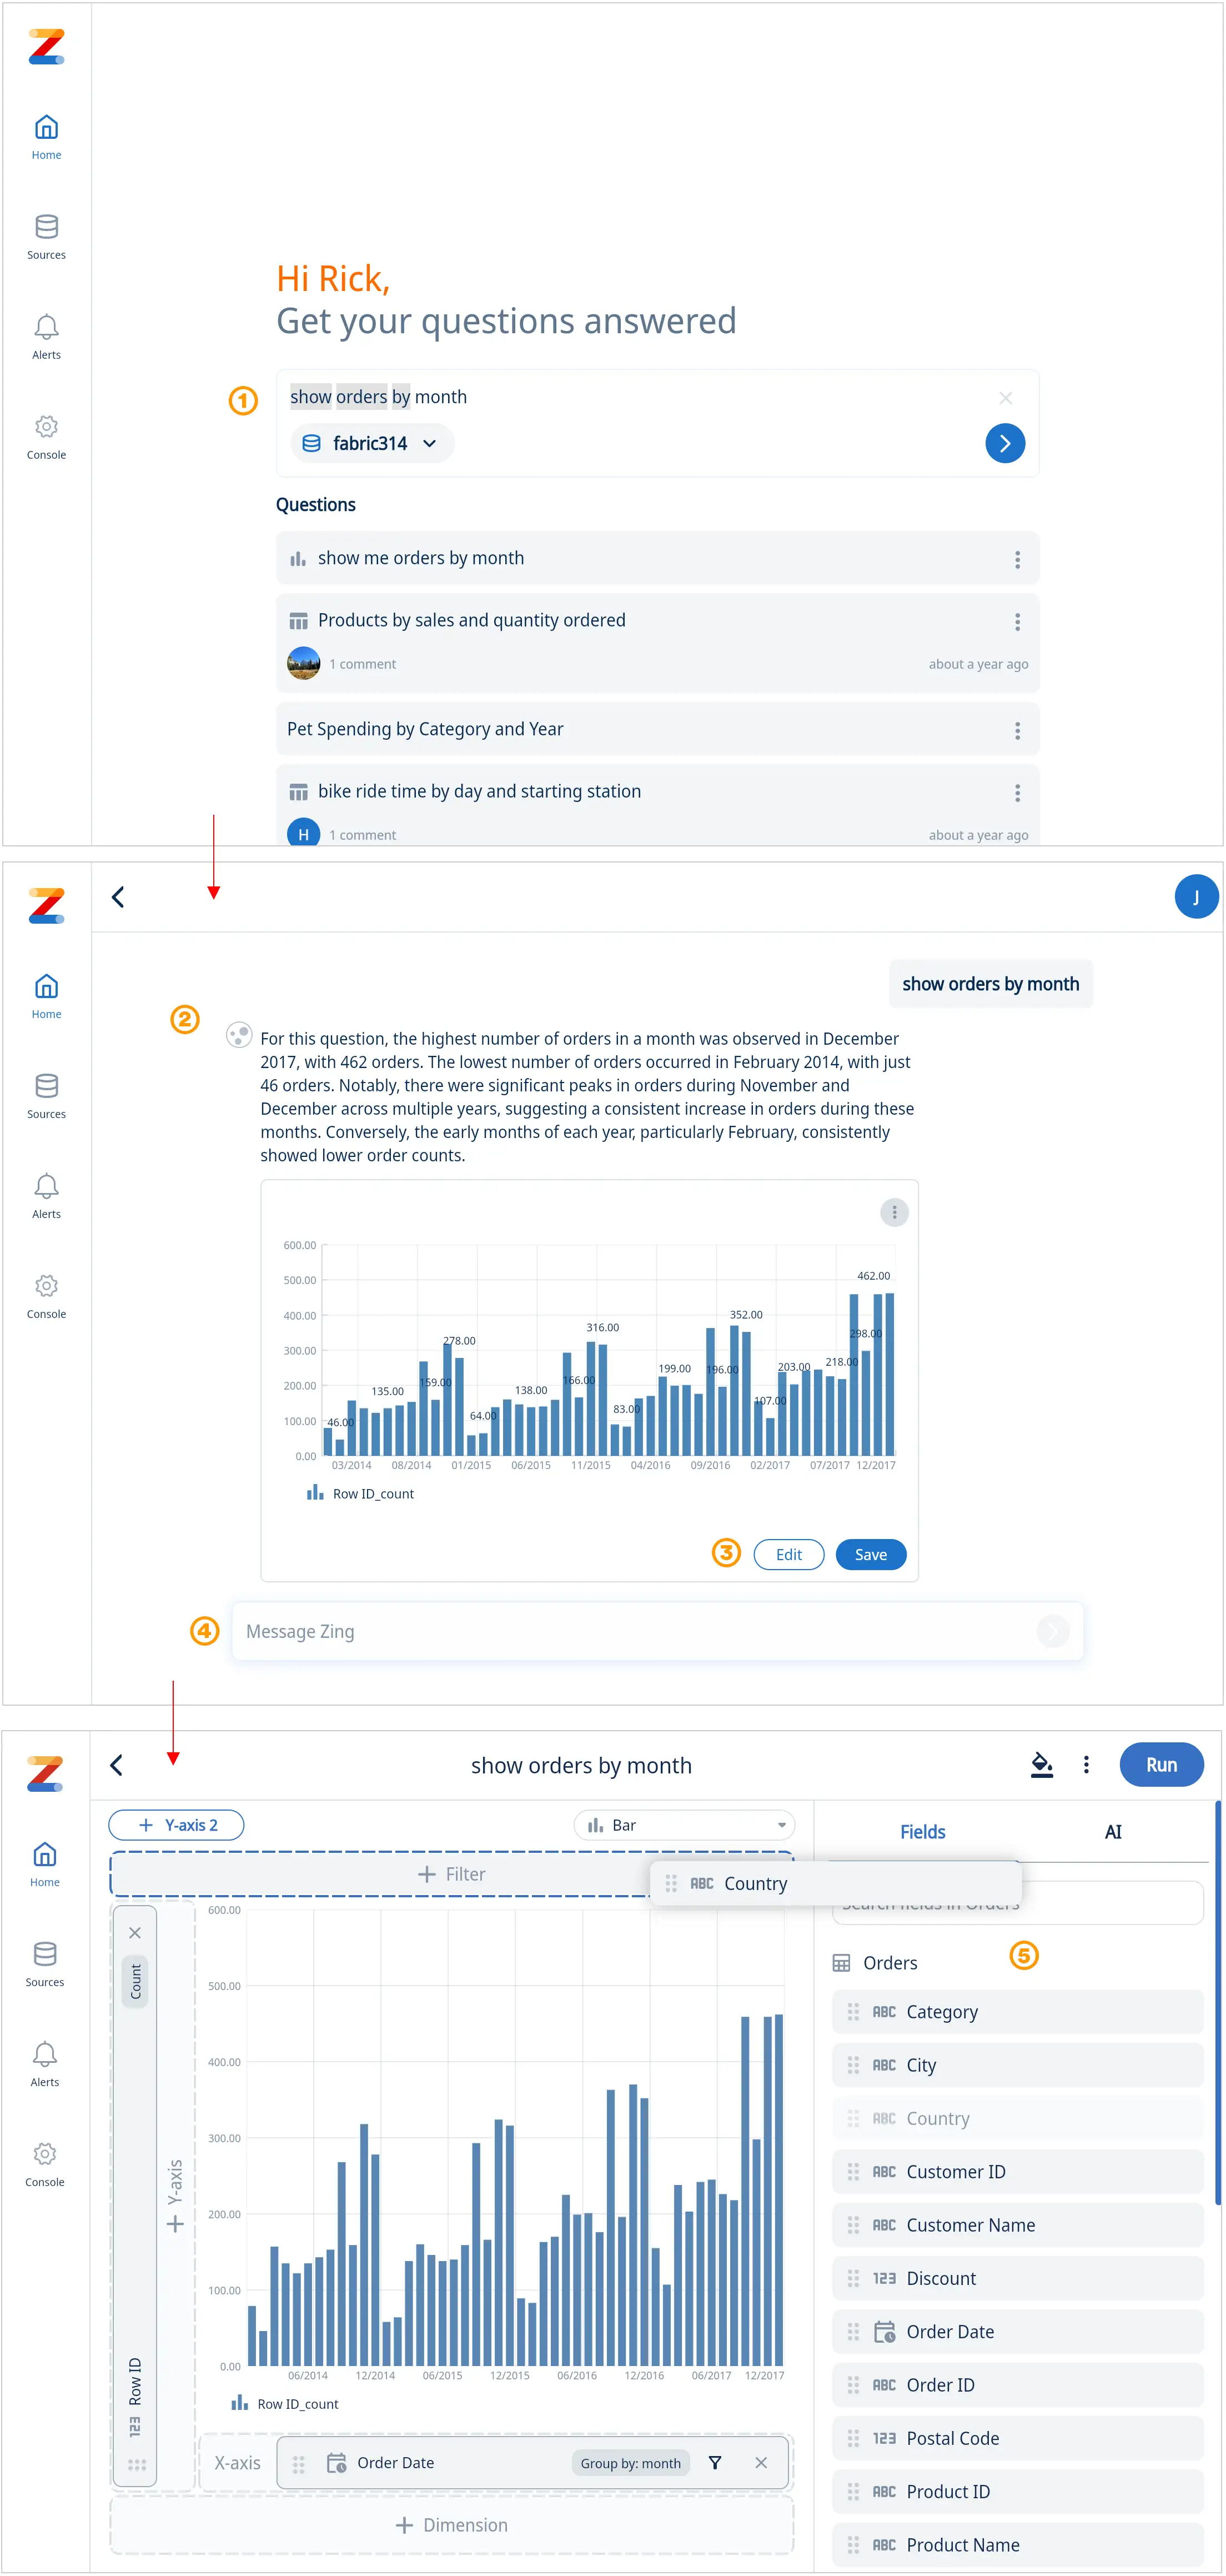
- From the home screen, tap the search bar and enter your question. If desired change the data source
- Zing will respond a familiar chat interface with an answer. If the AI is unable to answer your question it might ask you for a clarification based on the available data (e.g. if there are ambiguous fields or you as a question there is insufficient data to answer)
- If filters have been applied they will appear above the chart or table
- Select the ••• menu to regenerate the answer, export an image, CSV file, or provide feedback if this was a bad or good response
- Click Edit to manipulate the answer in the Zing chart editor (see (7) for details), click Save to keep the answer for adding to a dashboard, appearing on the home screen, and appearing in search
- Type any follow up questions directly in the Chat interface and Zing will respond with an updated answer that considers the context of the whole chat
Note: The chat interface is accessed by asking a question in the search bar. Guided analysis questions can be asked via the search bar but currently only as the initial question in a chat.
6 - Guided Analysis
Step 1: Add an example to your data source in console
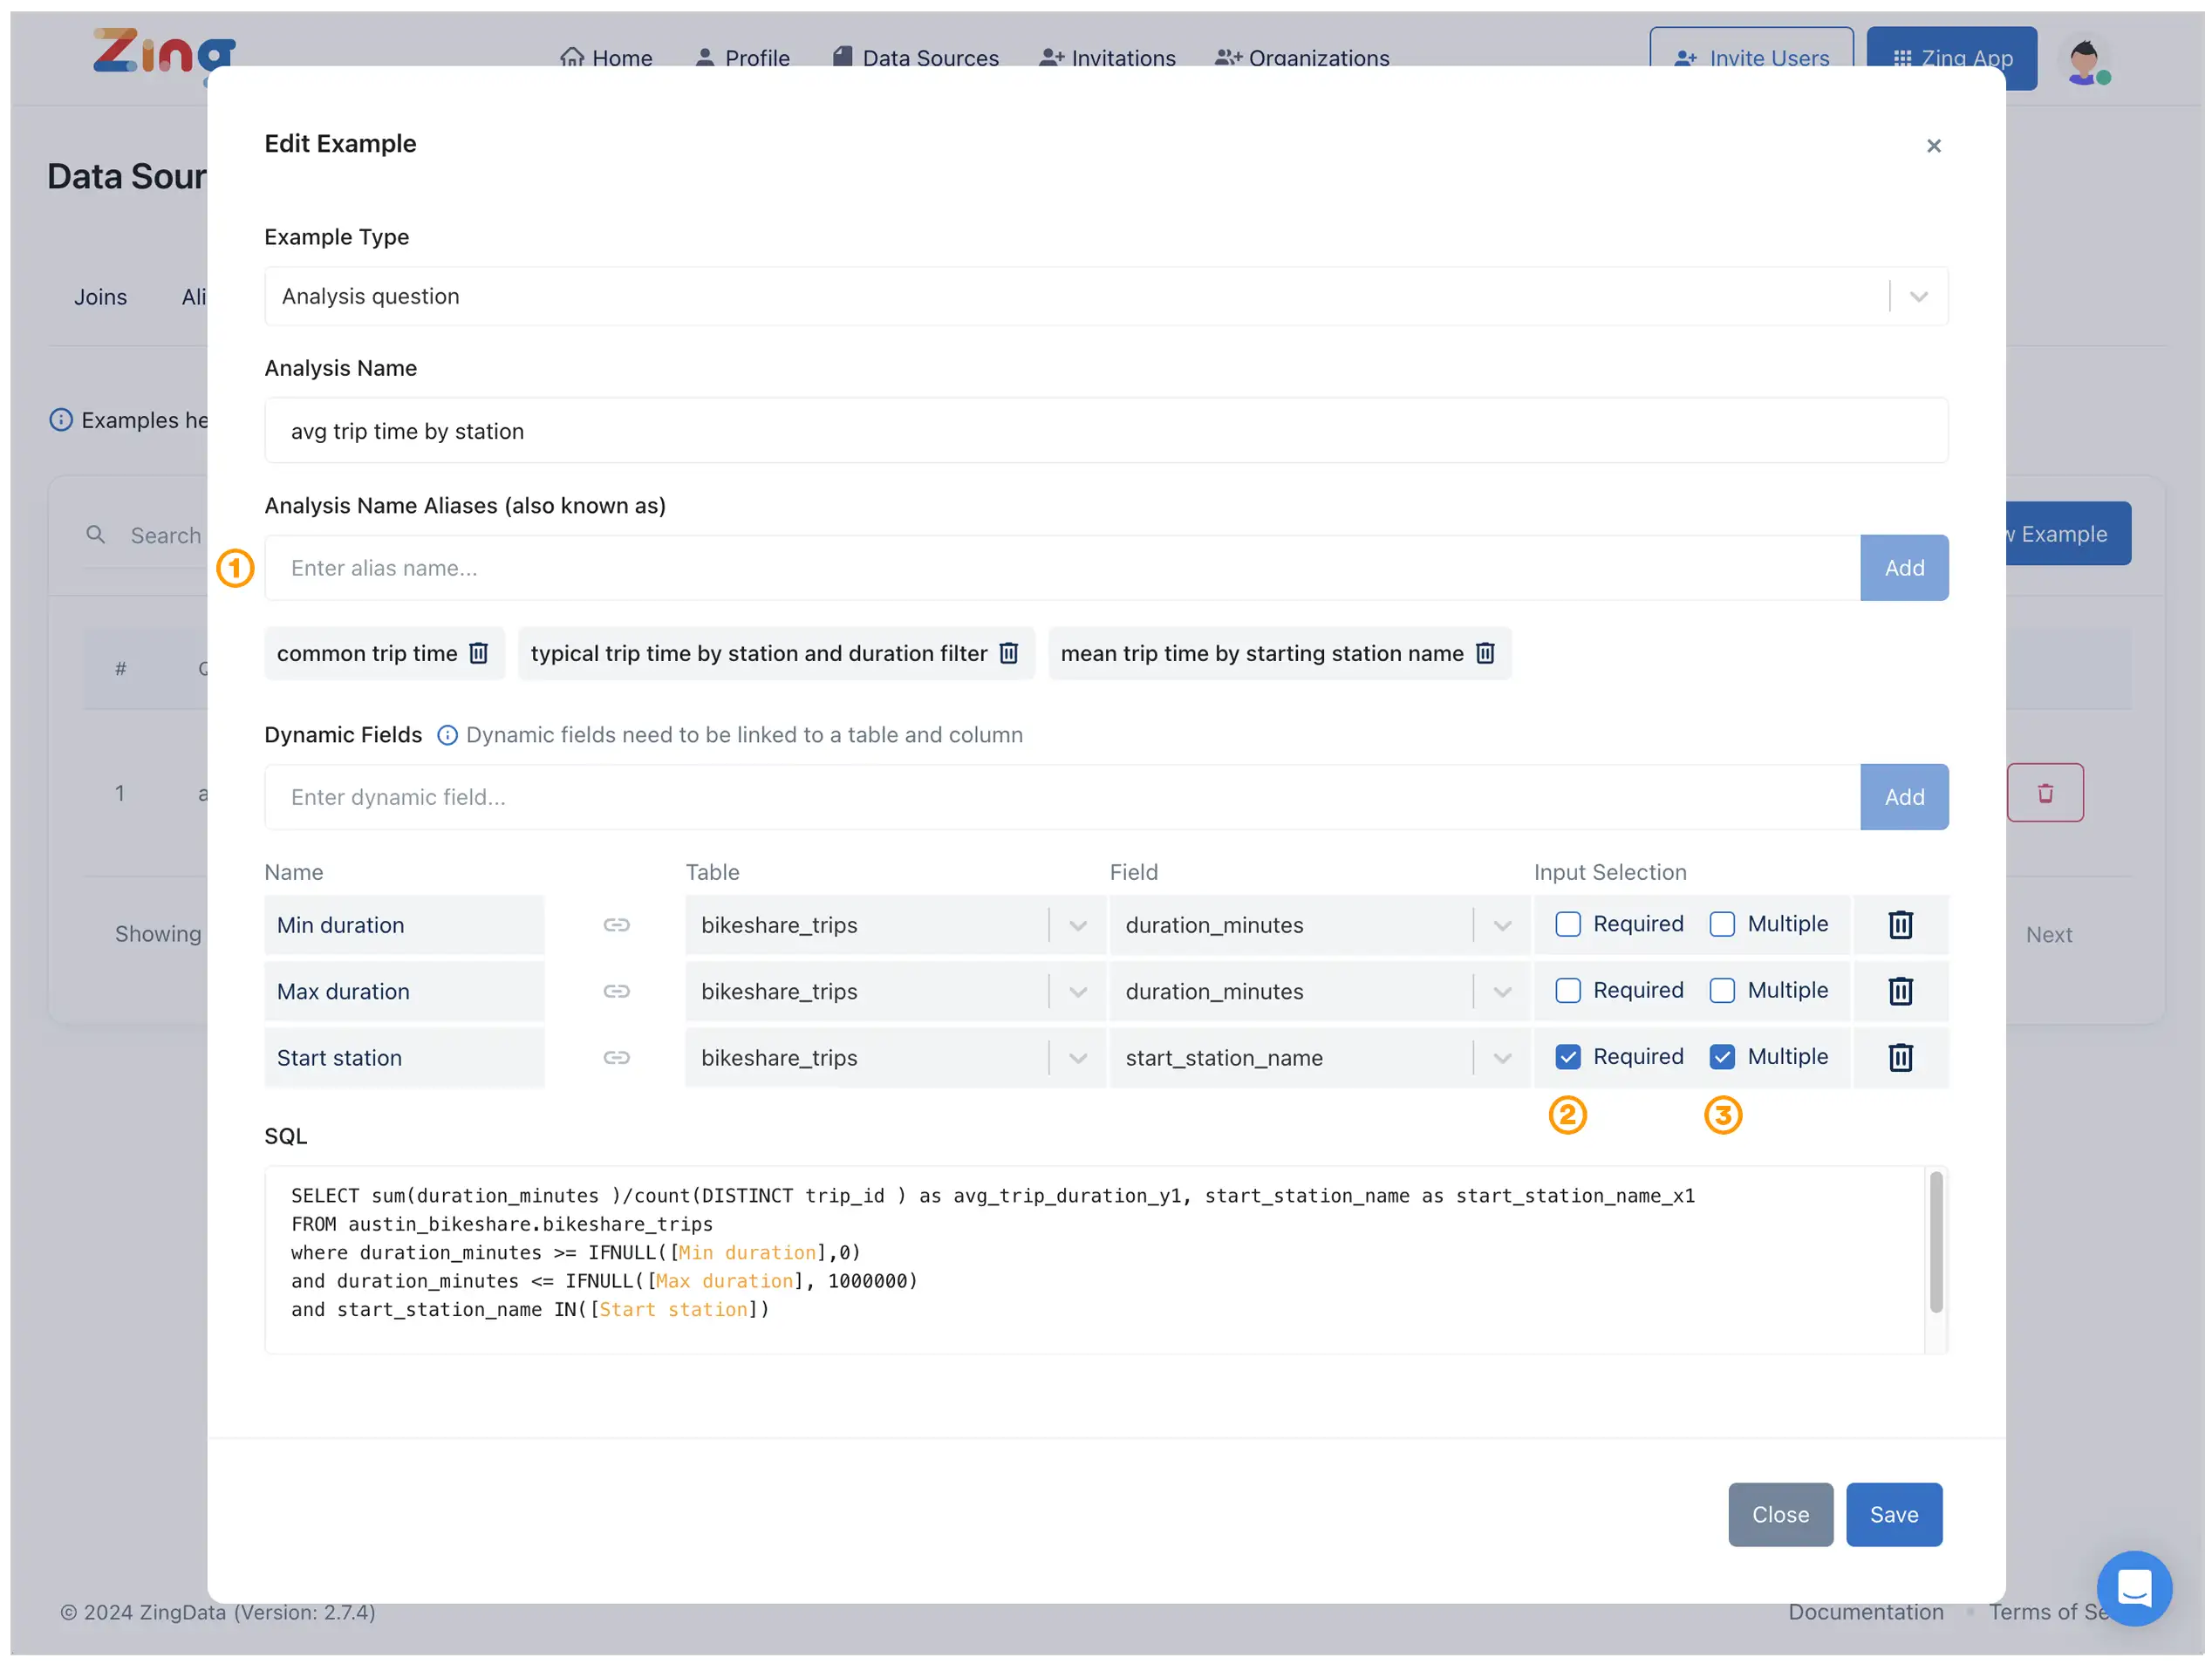
In the console modal window (see video below), change the Example Type to ‘Analysis Question.’ Then, complete the requested forms as seen in the UI, and click ‘Save’ when you’re done.
Customize your guided analysis with
- “Aliases” (also known as) » helps with discoverability for end-users since search queries are searched against all these aliases
- Optional fields vs required » control what user input is needed
- Single select vs multi select » control the data selection options
Keeping Parameter Data Fresh with “Update Sample Values”
As your underlying data changes (e.g., new customers are added, product names are updated), you need to ensure your guided analysis parameters reflect this new information.
- Purpose: The Update Sample Values button re-queries your data source to fetch the latest values for any single-select or multi-select parameters used in your guided analysis examples. This ensures that dropdown lists presented to users are always accurate and up-to-date.
- When to Use: Click this button periodically, especially after significant updates to your data, to keep your guided analysis options current.
- How to Use: From the examples management screen, simply click the Update Sample Values button. The system will automatically refresh the parameter options for all guided analysis examples associated with that data source.
Step 2: Experience search with a guided analysis workflow
- In the Zing app, start your search from the home screen (see video above)
- Your guided analysis will be available once a trigger word has been entered or select directly in the UI
- Follow the guided workflow and complete requested forms. Click on X to cancel guided analysis at any time and return to standard search
7 - Modeling Layer
Data modeling (semantic layer)
A semantic layer acts as a translation layer between your raw data and business definitions. It provides a business-friendly interface to your data warehouse, allowing you to define metrics, relationships, and access controls in a single place. Think of it as your organization’s single source of truth for metric definitions, and a way to ensure only certain metrics and columns are used for analysis to keep things focused for end users.
While Zing already offers capabilities to define metrics examples, create aliases, and define join relationships, a semantic layer goes beyond this to let you to specify:
- Which fields you want to expose from your tables / views
- Metrics calculations and descriptions
- Dimensions which must co-occur with metrics (for instance, only show order_count by city but never by customer_name)
- Table / view join relationships
- Field and table aliases
- Row level security requirements
Zing’s Implementation
We’ve taken a straightforward approach to semantic layer implementation, offering a JSON-based configuration that makes it easy to define your metrics and their relationships.
Importantly, Zing does not require you to have a data model to work, and a semantic model can be added later as your organization’s needs for consistency in metrics, guardrails, and governance increase.
Columns, Metrics and Relationships
A data model is defined at the data source level.
Columns and Tables
You can choose which tables/views, columns, and metrics are used to answer questions by defining a model. This allows you to put guardrails on natural language questions that users may ask within Zing, and ensures data users have a consistent, governed experience.
Specifying tables/views and columns is not required. If no tables/views are specified in your modeling layer, then by default, all tables/views within data source will be made available to answer questions.
If no columns are specified, then all columns within a given table/view will be made available.
Metrics
Metrics are defined by a:
- A description describing the metric (and used as context to map user questions to this metric)
- An expression which is the calculation for the metric
- A Group bys section which lets you indicate is a metric can be aggregated by various columns (‘allowed’), must be aggregated by one or more columns (‘required’), or cannot be aggregated by one or more columns (‘forbidden’)
- Allowed
- Required
- Forbidden
- Note: that these group by attributes are optional and if they are not specified then a metric can be aggregated by any column in the columns part of the date model
A sample data model file for Zing is shown below:
{
  "tables": [
    {
    "name": "Orders",
      "columns": [
        {
          "name": "OrderID",
          "description": "Unique identifier for the order"
        },
        {
          "name": "CustomerID",
          "description": "Unique identifier for the customer"
        },
        {
          "name": "Item_Amount",
          "description": "Total revenue excluding taxes of all items in the order"
        },
        {
          "name": "Tax_Amount",
          "description": "Tax amount paid on the order"
        },
        {
          "name": "Total_Amount",
          "description": "Total order amount including tax"
        }
      ]
    },
    {
      "name": "Customers",
      "columns": [
        {
          "name": "CustomerID",
          "description": "Unique identifier for the customer"
        },
        {
          "name": "Name",
          "description": "Name of the customer"
        },
        {
          "name": "City",
          "description": "City of the customer"
        },
        {
          "name": "State",
          "description": "State of the customer"
        }
      ]
      }
  ],
  "metrics": [
    {
      "description": "Tax_Percentage",
      "expr": "sum(Tax_Amount)/sum(Item_Amount)",
      "groupBy": {
        "allowed": [
          "City",
          "State"
        ],
        "required": [],
        "forbidden":[]
      }
    },
    {
      "description": "Order_Amount",
      "expr": "sum(Total_Amount)",
      "groupBy": {
        "allowed": [
        ],
        "required": [],
        "forbidden": ["CustomerID", "Name"]
      }
    }
  ]
}
This would ensure that:
-
Order amount can’t be shown by Customer Name or Customer ID
-
Tax rate is only shown at a City or State level
-
Only the Orders and Customers tables/views are available to answer questions, and only with the specific columns outlined.
Template Variables in Metric expressions
Template variables let you create flexible metric definitions that adapt to different user questions while maintaining data governance. When you include a variable like {{variable_name}} in your metric expression, Zing will intelligently match it against relevant parts of users’ natural language questions.
Here’s an example metric definition using template variables:
{
  "description": "Revenue growth % by period",
  "expr": "((SUM(case when categories.categoryname = '{{category}}' then orderlines.quantity * products.price else 0 end) - LAG(SUM(case when categories.categoryname = '{{category}}' then orderlines.quantity * products.price else 0 end), 1) OVER (ORDER BY date_trunc({{period}}, orders.orderdate))) / LAG(SUM(case when categories.categoryname = '{{category}}' then orderlines.quantity * products.price else 0 end), 1) OVER (ORDER BY date_trunc({{period}}, orders.orderdate))) * 100",
  "groupBy": {
    "allowed": ["orders.orderdate"],
    "required": ["orders.orderdate"],
    "forbidden": []
  },
  "vars": {
    "period": {
      "allowedValues": ["month", "quarter", "year"]
    }
  }
}
The SQL expression above calculates revenue growth using this formula:
$$ \text{Growth} = \frac{\text{Current Period Revenue} - \text{Previous Period Revenue}}{\text{Previous Period Revenue}} \times 100 $$
Where:
- Revenue is summed for a specific category (filtered by
{{category}}) - Periods are defined by
{{period}}(month/quarter/year) - Result is shown as a percentage
In this example:
- The metric calculates period-over-period revenue growth percentage
{{period}}variable lets users analyze growth by month, quarter, or year{{category}}variable allows filtering for specific product categories- The optional
varsobject lets you restrict variables to specific values for governance
When users ask natural language questions, Zing automatically matches their intent to your metric definitions. For example, the same metric definition above can answer questions like:
- “What’s the YoY revenue growth for Electronics?”
- “Show me Books revenue growth month over month”
- “How much did Clothing revenue grow last quarter?”
A key advantage of template variables is that they let you define a single metric that represents an entire “family” of related metrics. Instead of creating separate metrics for each category or time period (like “Electronics Revenue Growth MoM”, “Electronics Revenue Growth YoY”, “Books Revenue Growth QoQ”, etc.), you define one flexible metric that handles all cases. This keeps your semantic layer clean and maintainable while giving users the freedom to ask questions naturally.
Getting Started
- Log in to the Zing Data Console, then click on ‘data sources’ and select the data source you’d like to create (or update) a modeling layer for
- Click the ‘semantic layer’ tab
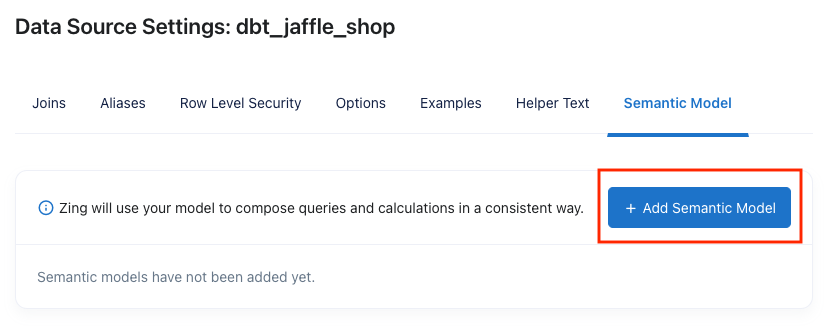
- Upload a semantic model .json file in the format outlined above
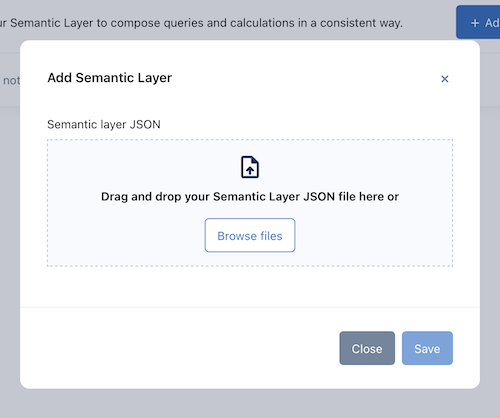
- Any questions that a user asks with natural language, will adhere to the modeling layer you have uploaded.
Questions asked with the visual editor, or using the SQL editor do not adhere to the data modeling layer you’ve uploaded because those interfaces are typically used for more customized or ad-hoc analysis. - Note that users with an editor or admin role can optionally ask natural language questions which are not bound to the semantic layer by clicking on the options drop-down within the natural language composer and selecting ‘Expert mode’ instead of ‘Semantic model mode’
8 - SSO Integrations
The Zing Data platform supports the following single sign on providers. Please reach out to us at hello@getzingdata.com to get support for an SSO provider that is not yet listed, and we’d be happy to assist.
8.1 - Microsoft Entra ID / Active Directory
Microsoft Entra ID (formerly Azure Active Directory) is a comprehensive identity and access management (IAM) solution providing:
- Single sign-on (SSO): Access multiple applications with one set of credentials.
- Multi-factor authentication (MFA): Add an extra layer of security.
- Conditional access: Grant access based on specific conditions.
- Directory synchronization: Easily manage user identities across systems.
Integration Setup
- Go to the Azure Portal
- Navigate to Microsoft Entra or Azure Active Directory.
- Click on App Registrations.
- Then click on New Registration.
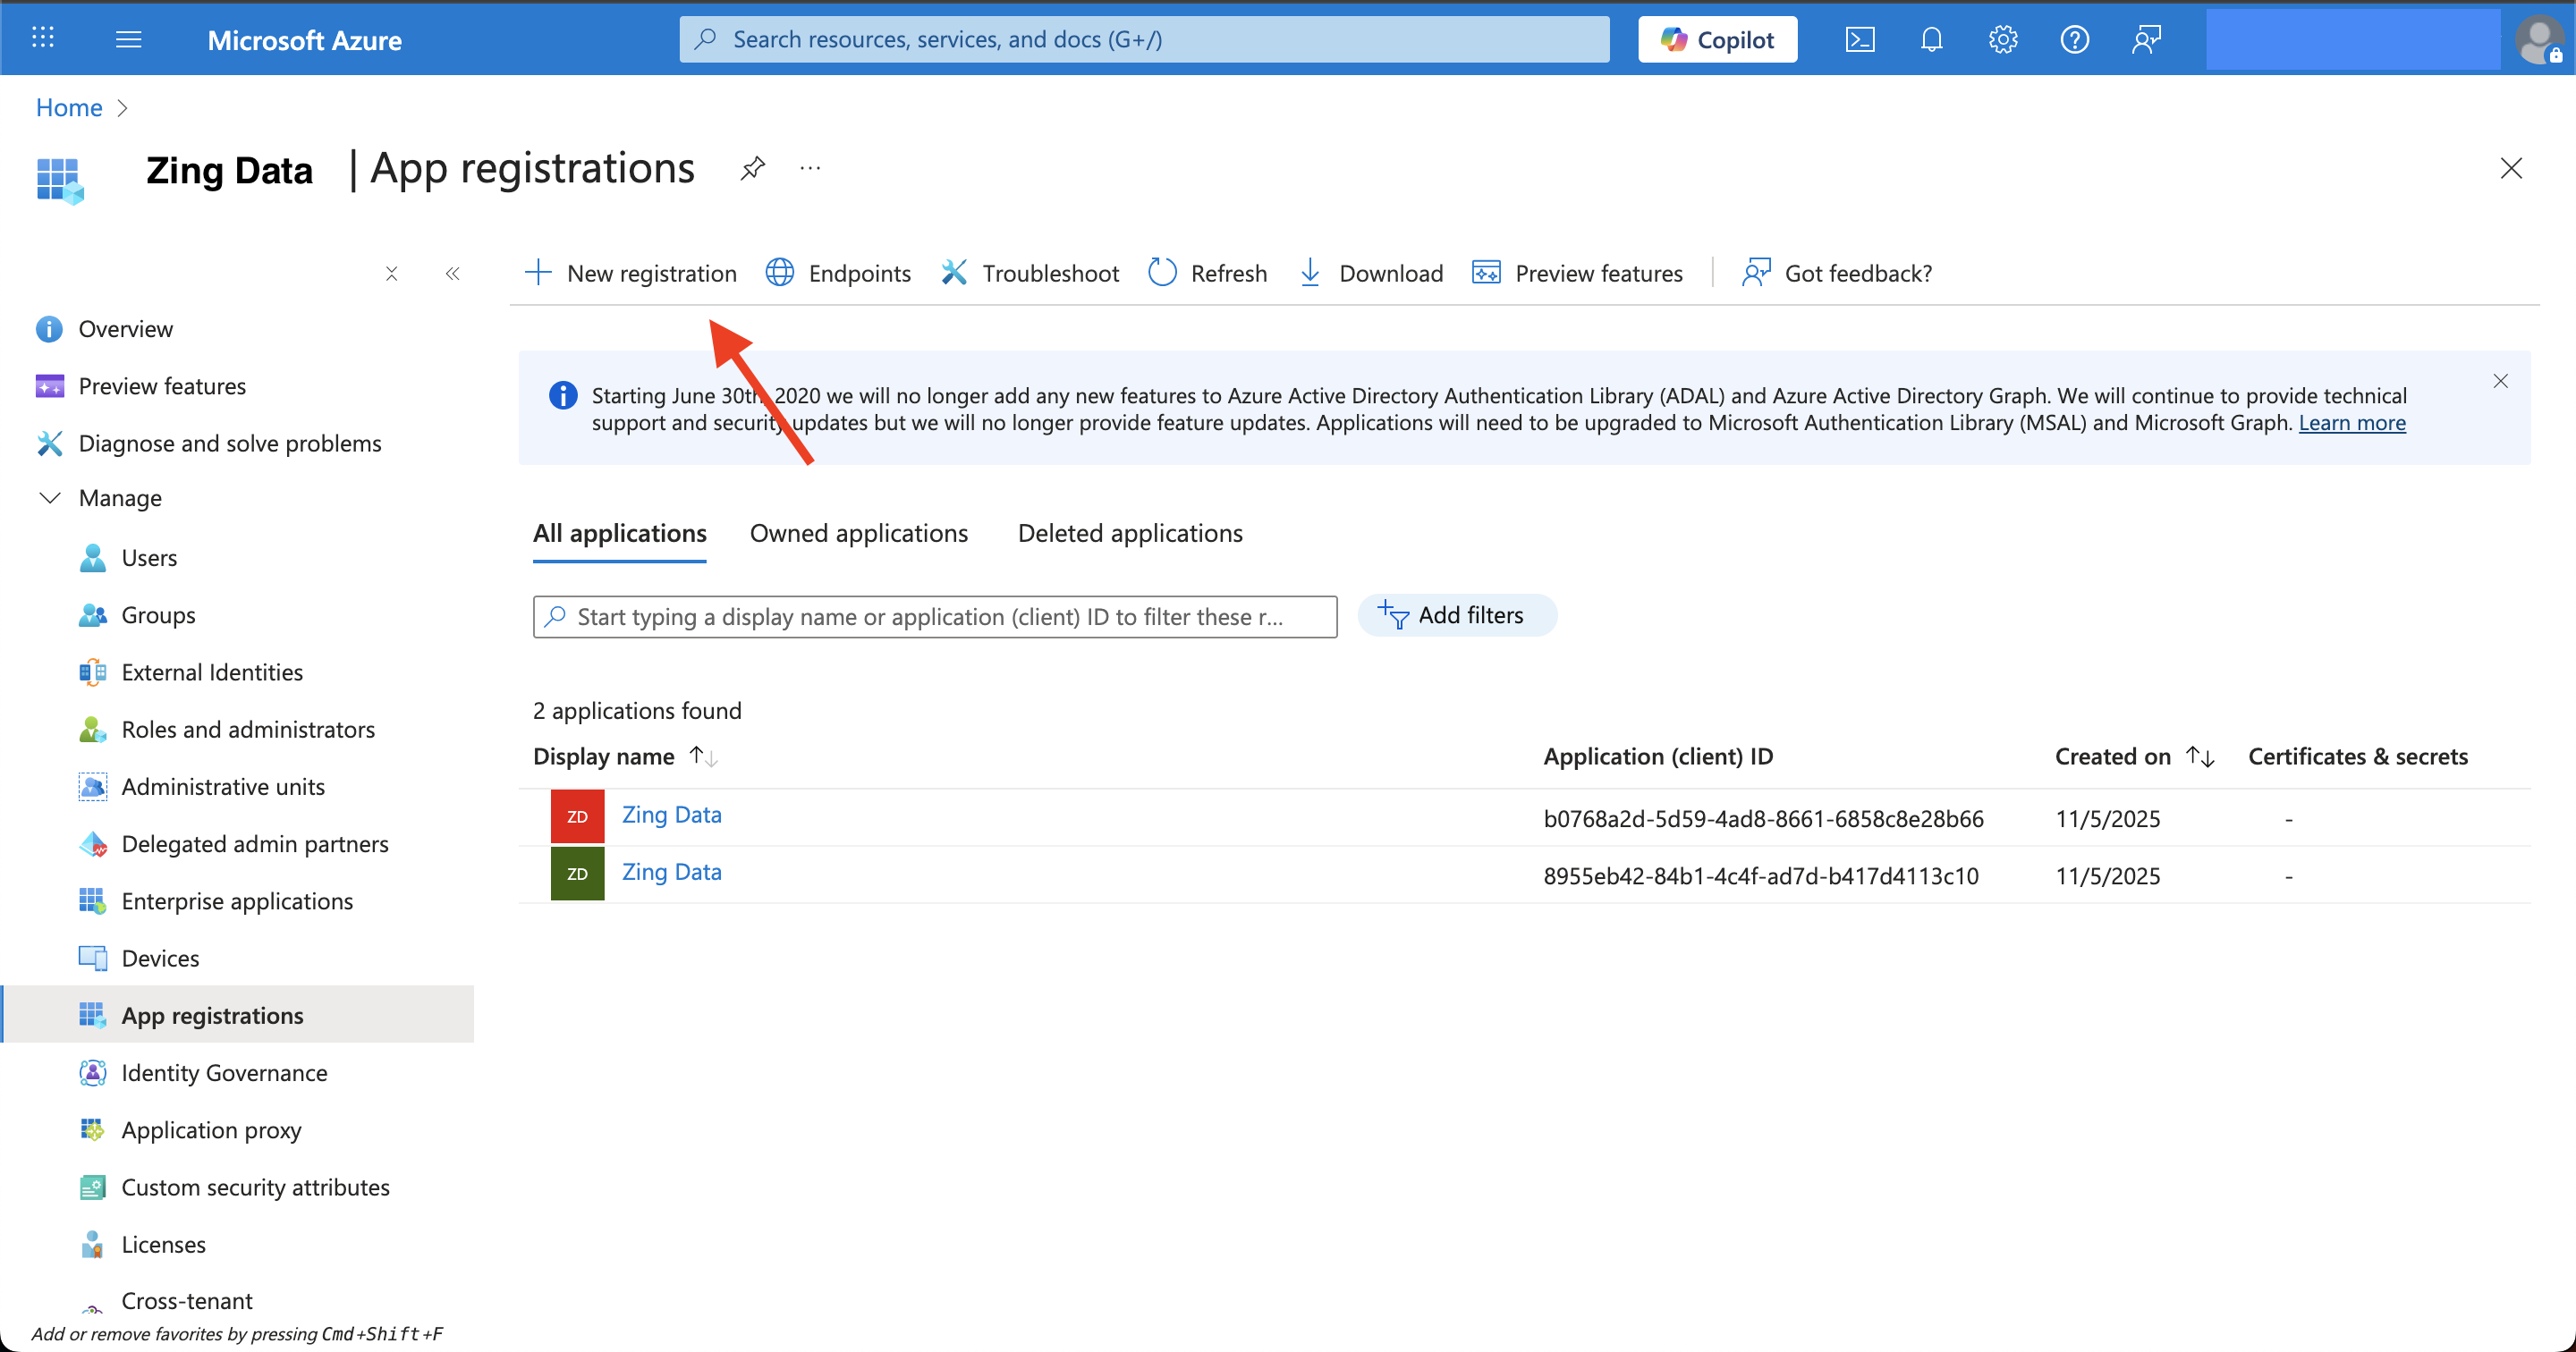
- Fill the details like the example below.
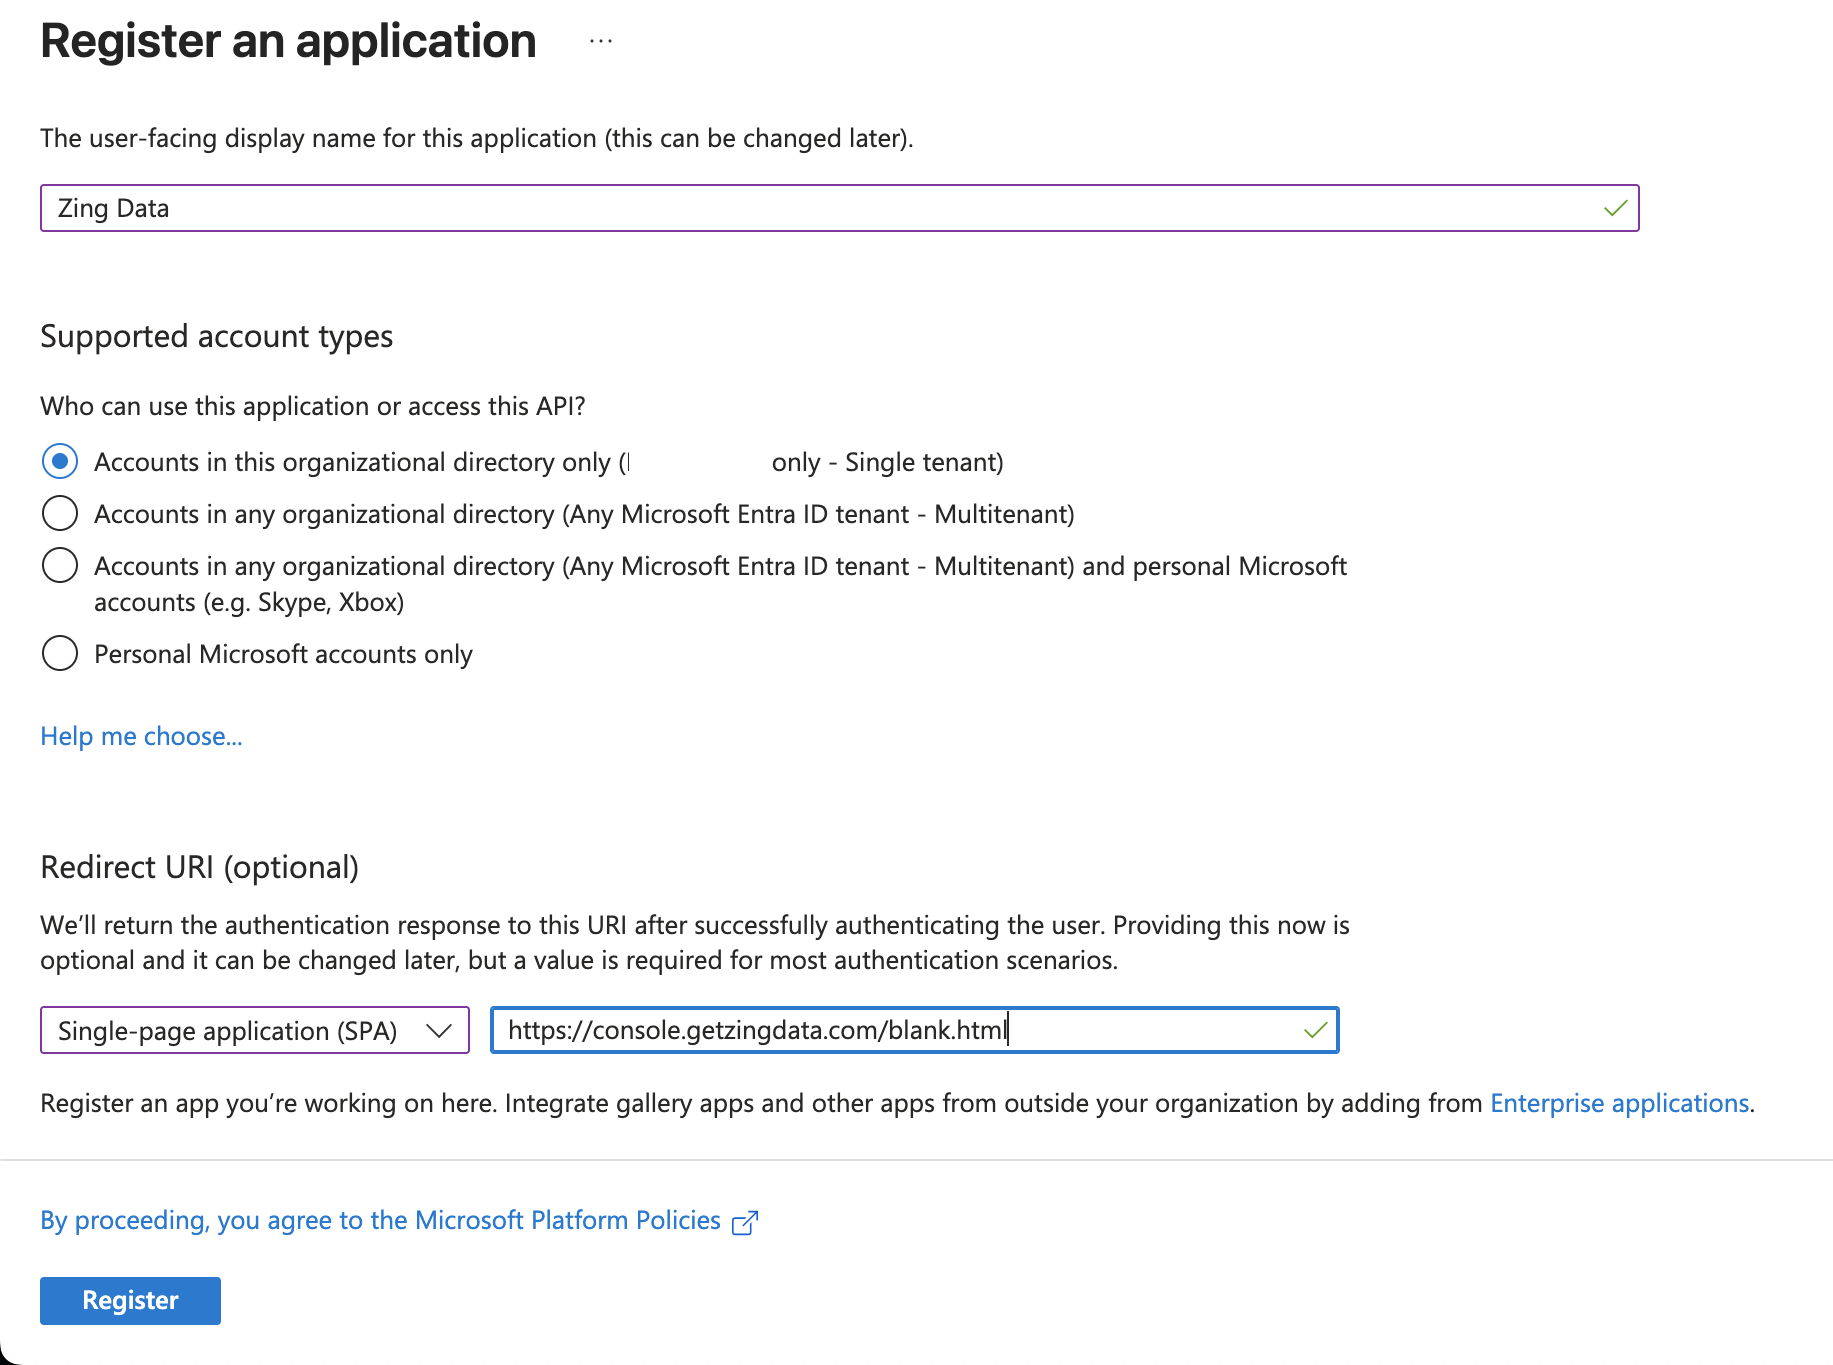
- Click Register

- Once the app is registered, we need to go to Expose an API on the left side menu.
- Click on Add a scope.
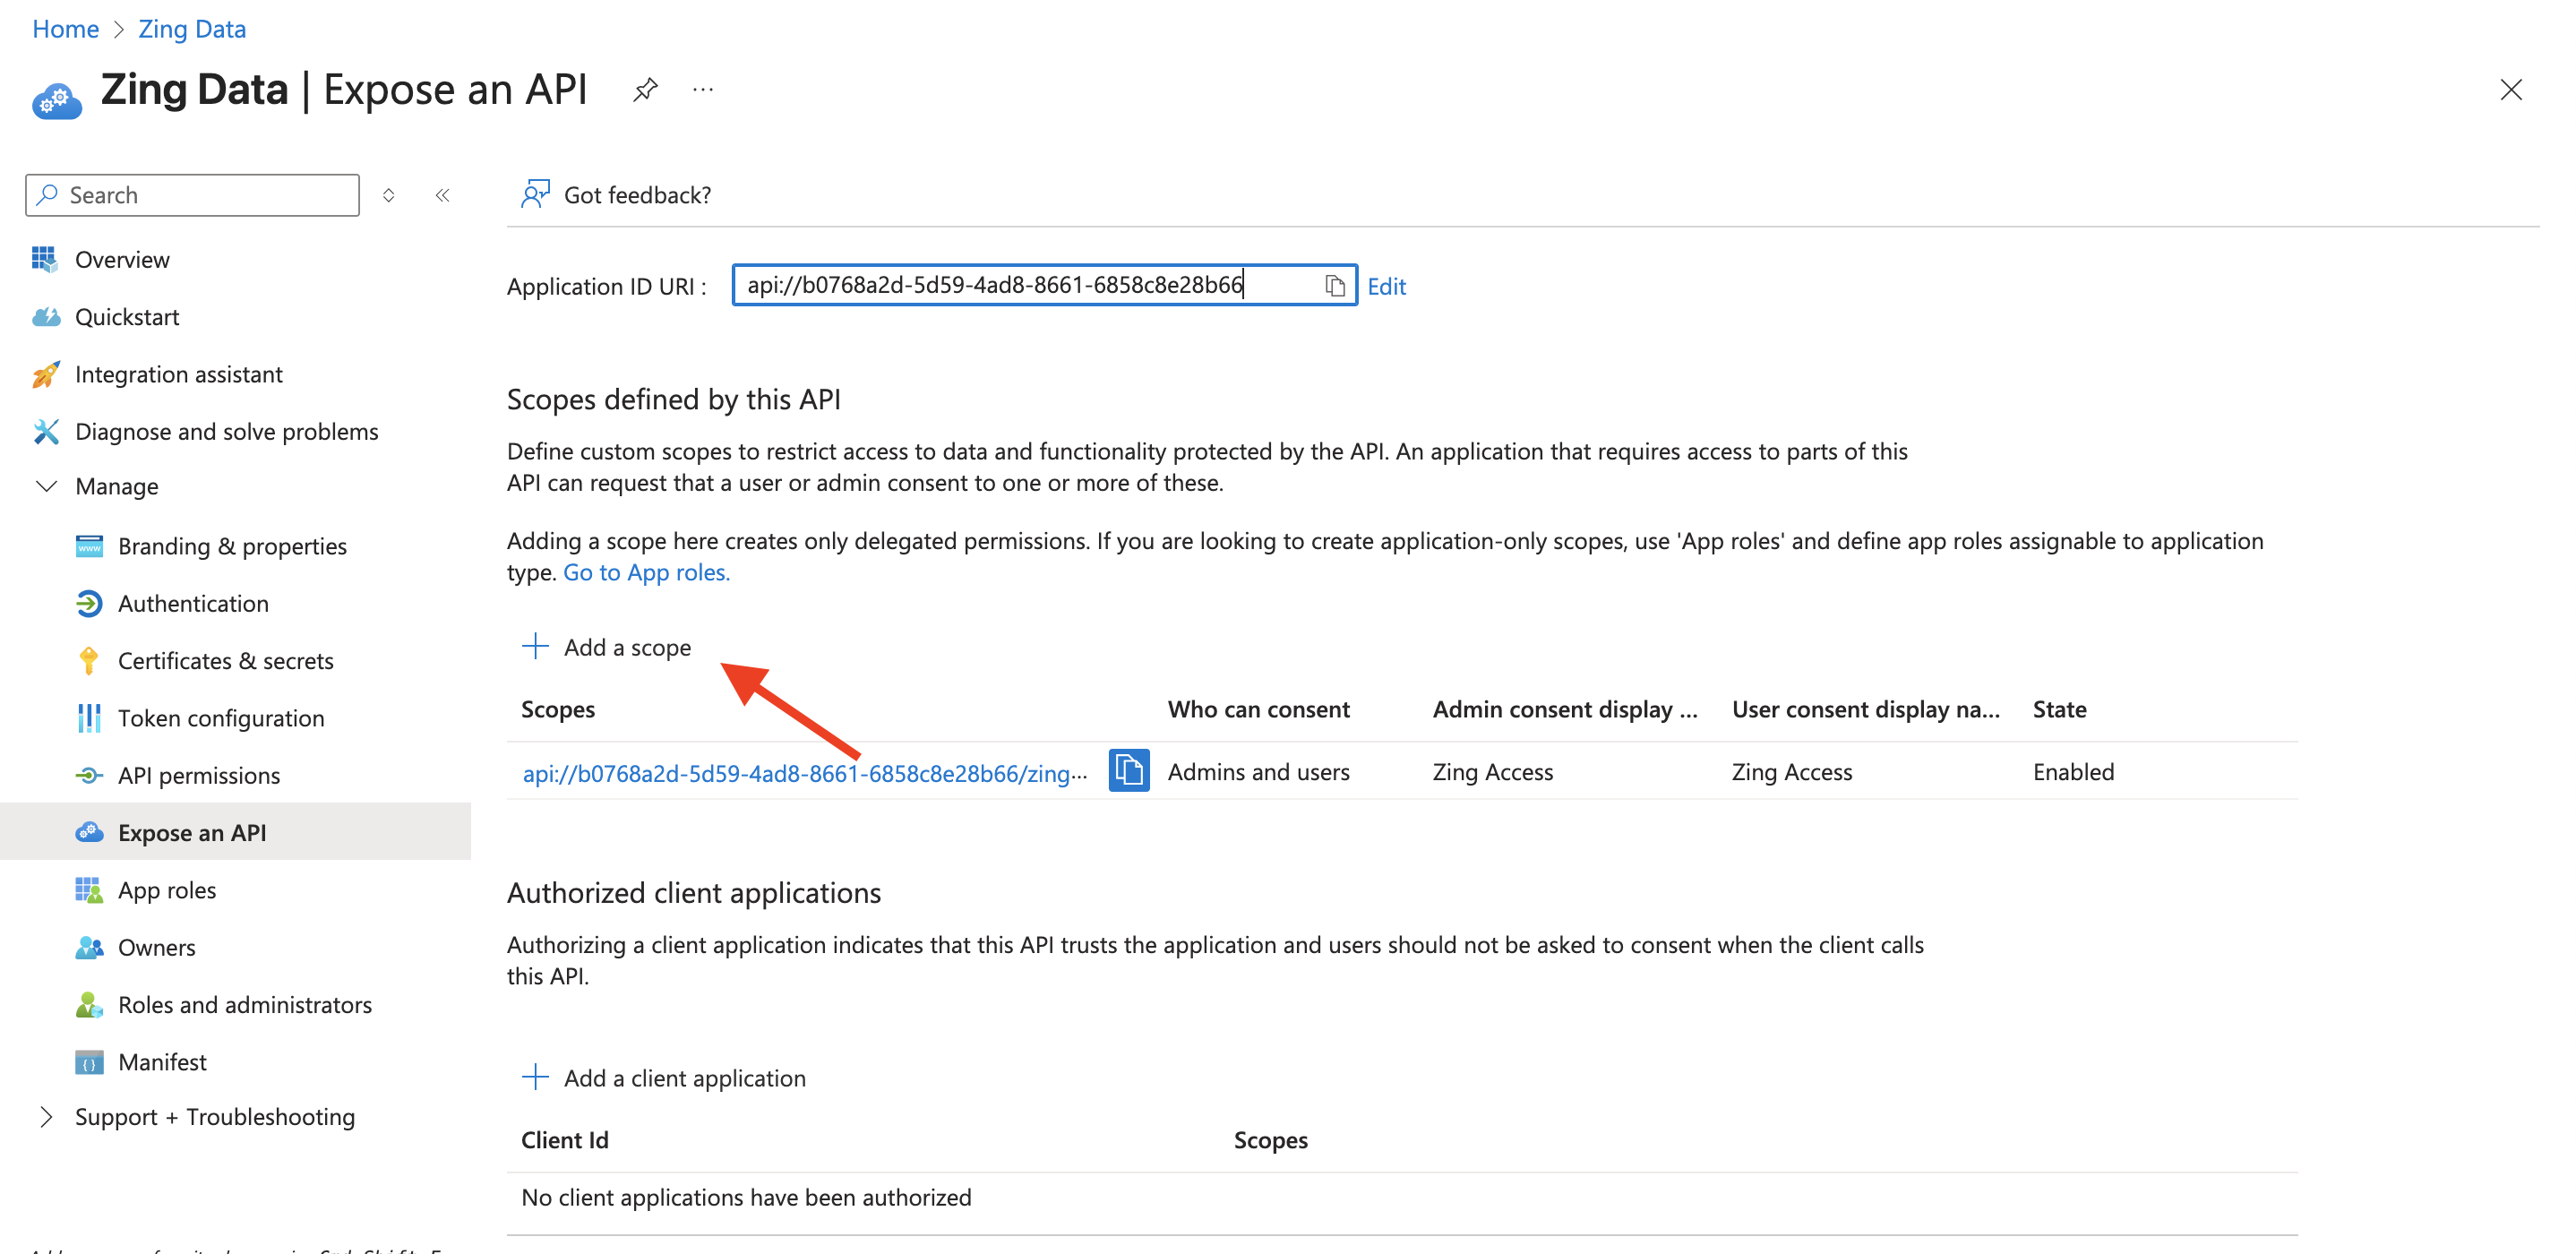
- Fill the details like the example below. (Make sure to use Admins and users for the options “Who can consent?”.
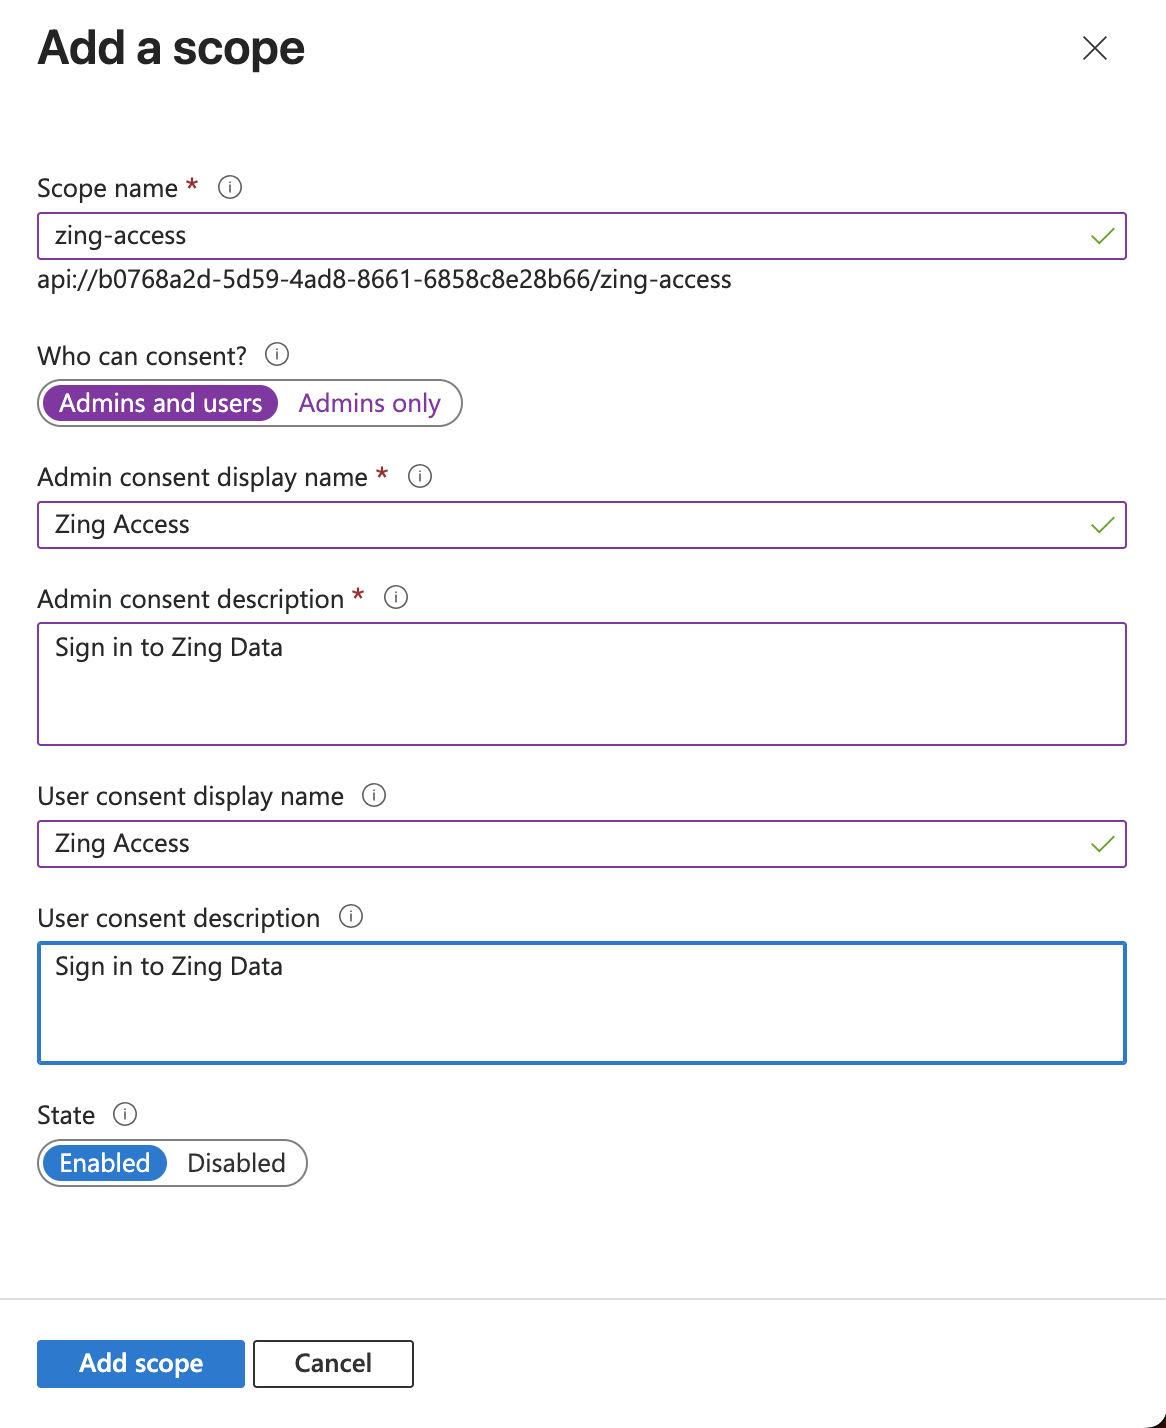
- Once you click in Add scope in the bottom, On the left side menu, click on API permissions.
- Click on Add a permission.
- Click on Microsoft Graph.
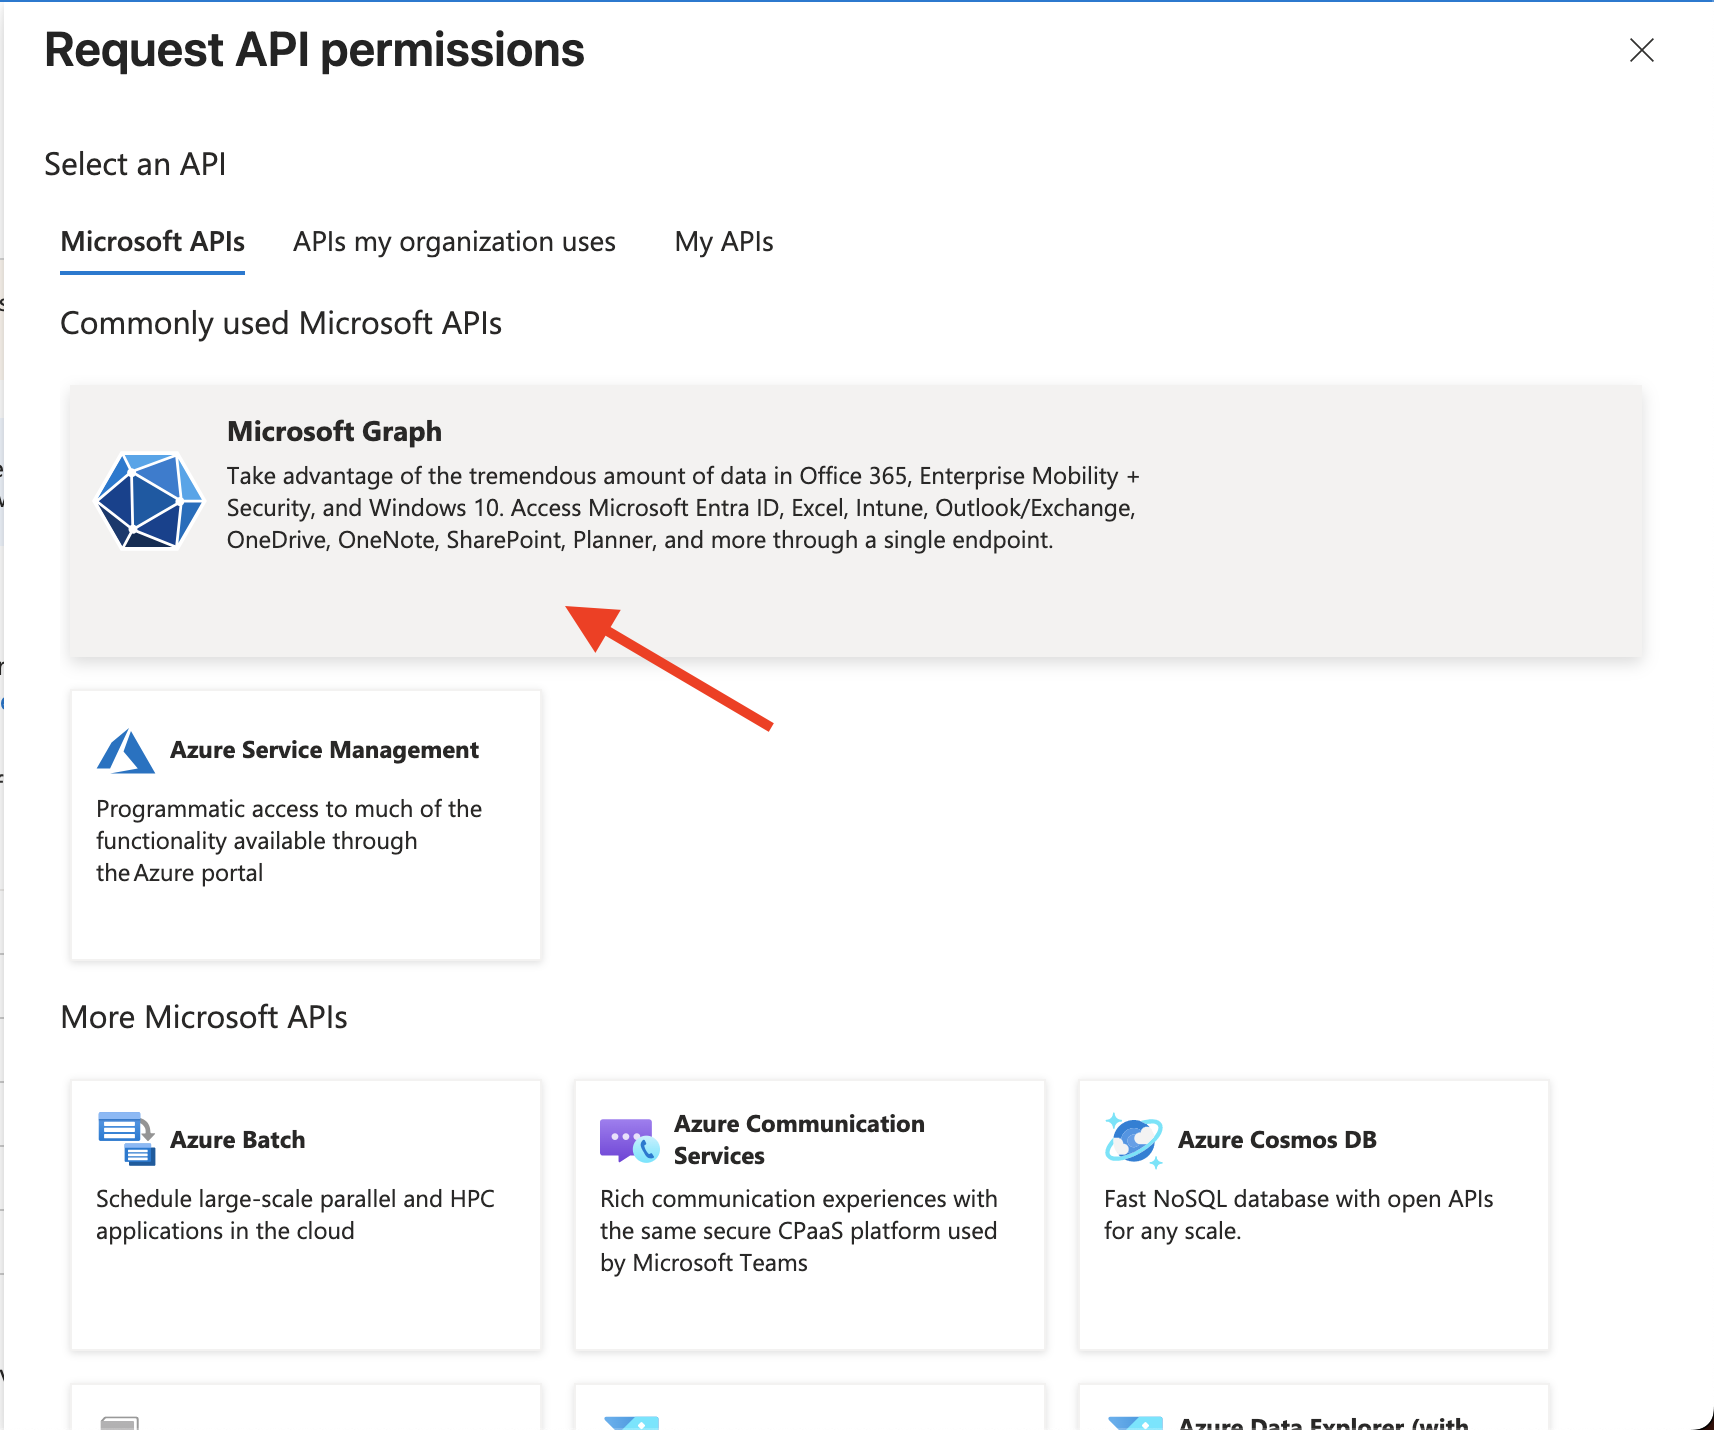
- Click on Delegated permissions and then select
emailandprofilelike the example below and click Add Permission.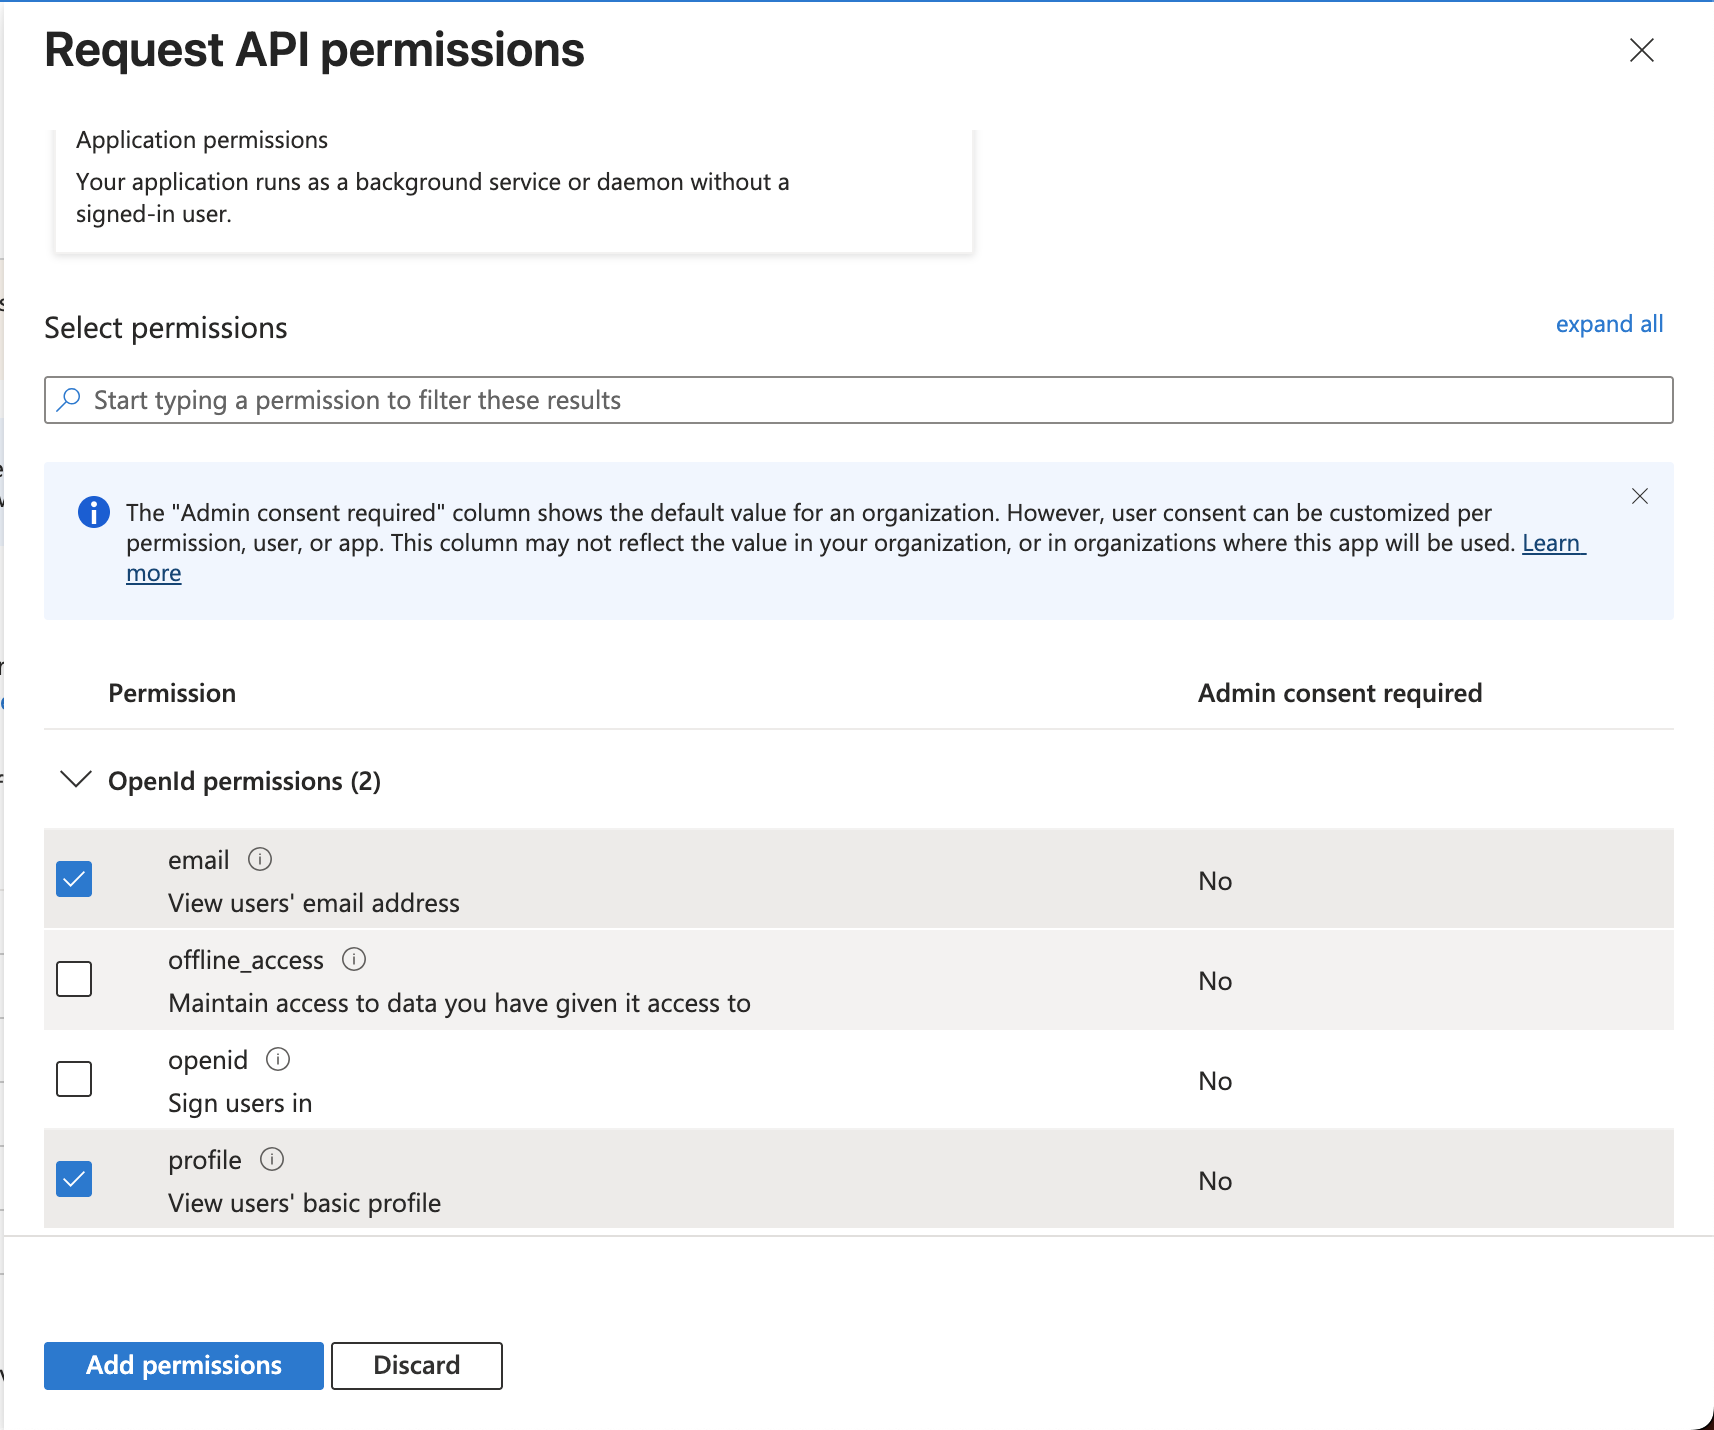
- Click on Add a permission again, but this time switch to the second tab on top APIs my organization uses and find the Zing Data API previously created.
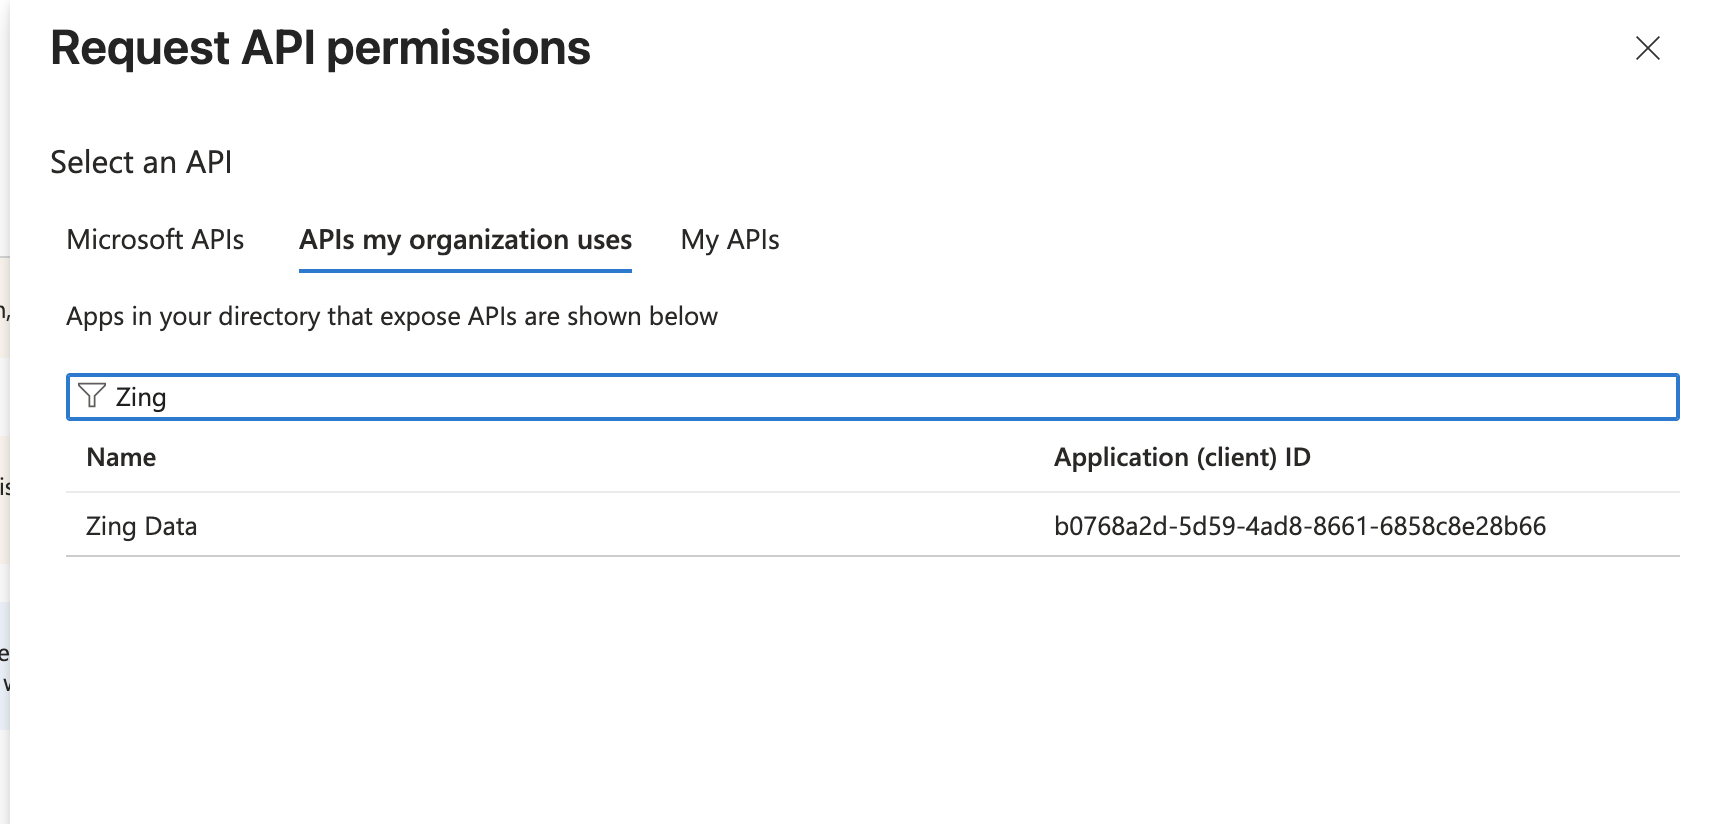
- Click again in Delegated permissions and select the Zing Access permission and then click Add permissions.
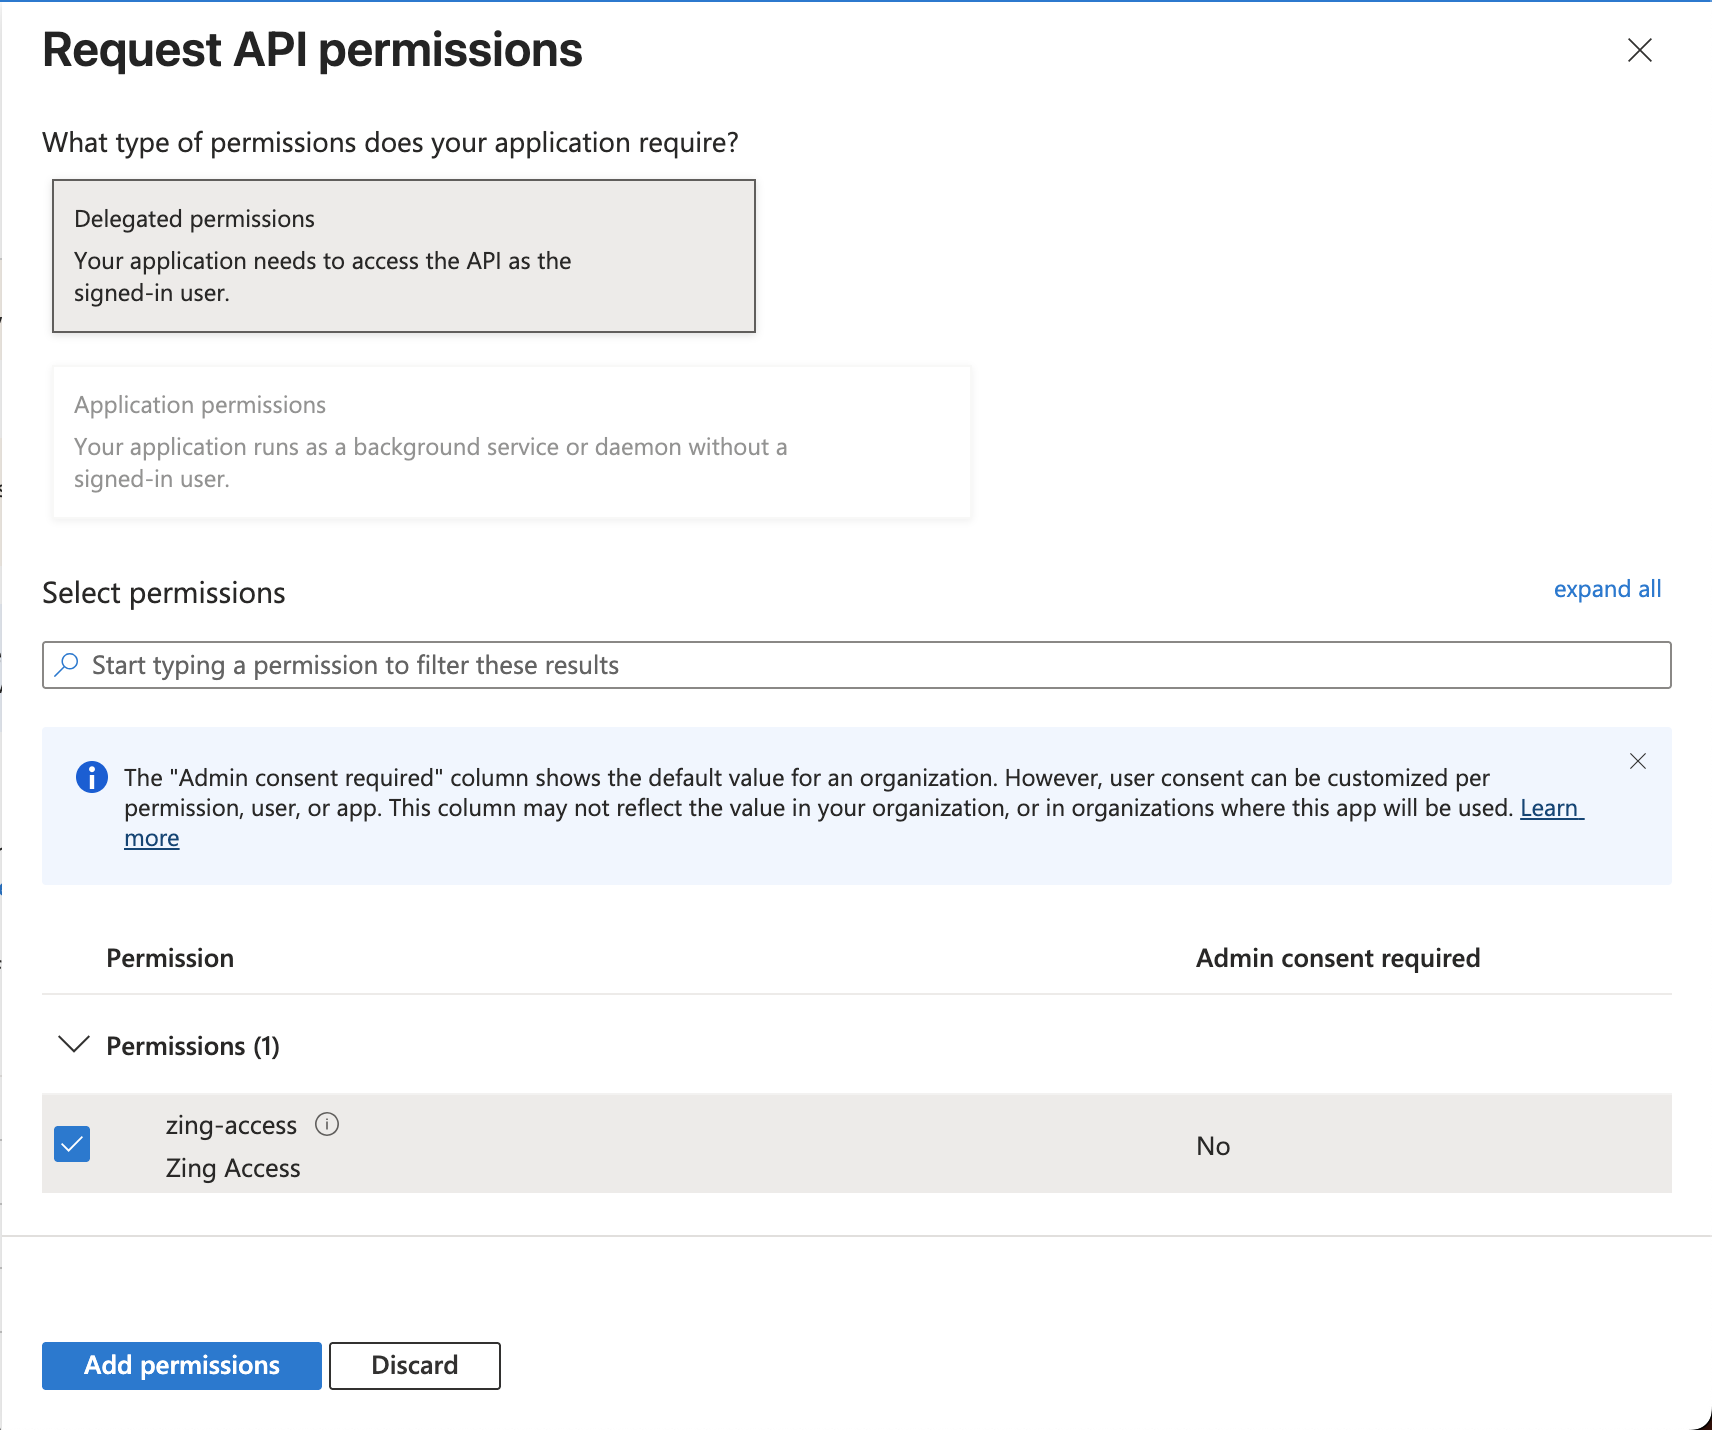
- On the left side menu, click on Token configuration and then click Add optional claim. You must choose Token Type: Access and then select
emailfamily_nameandgiven_nameclaims, then click Add on the bottom.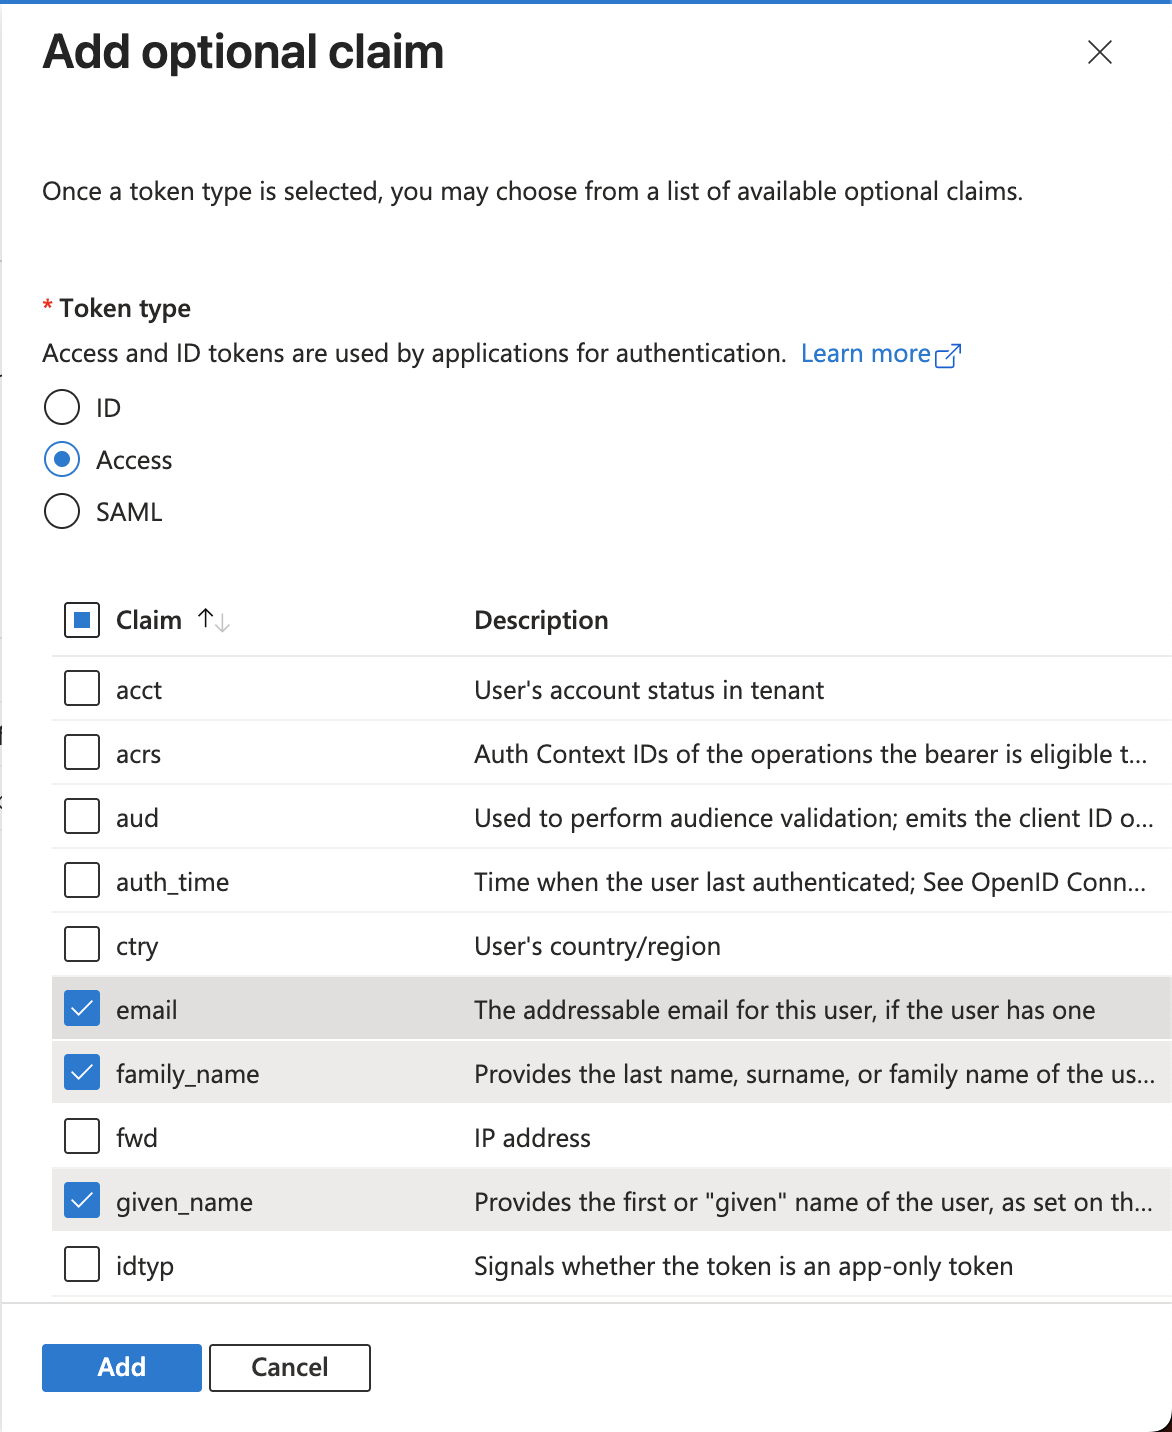
- Click on Manifest on the left side menu and click on tab AAD Graph App Manifest, then change the variable
accessTokenAcceptedVersionto 2 as in example below.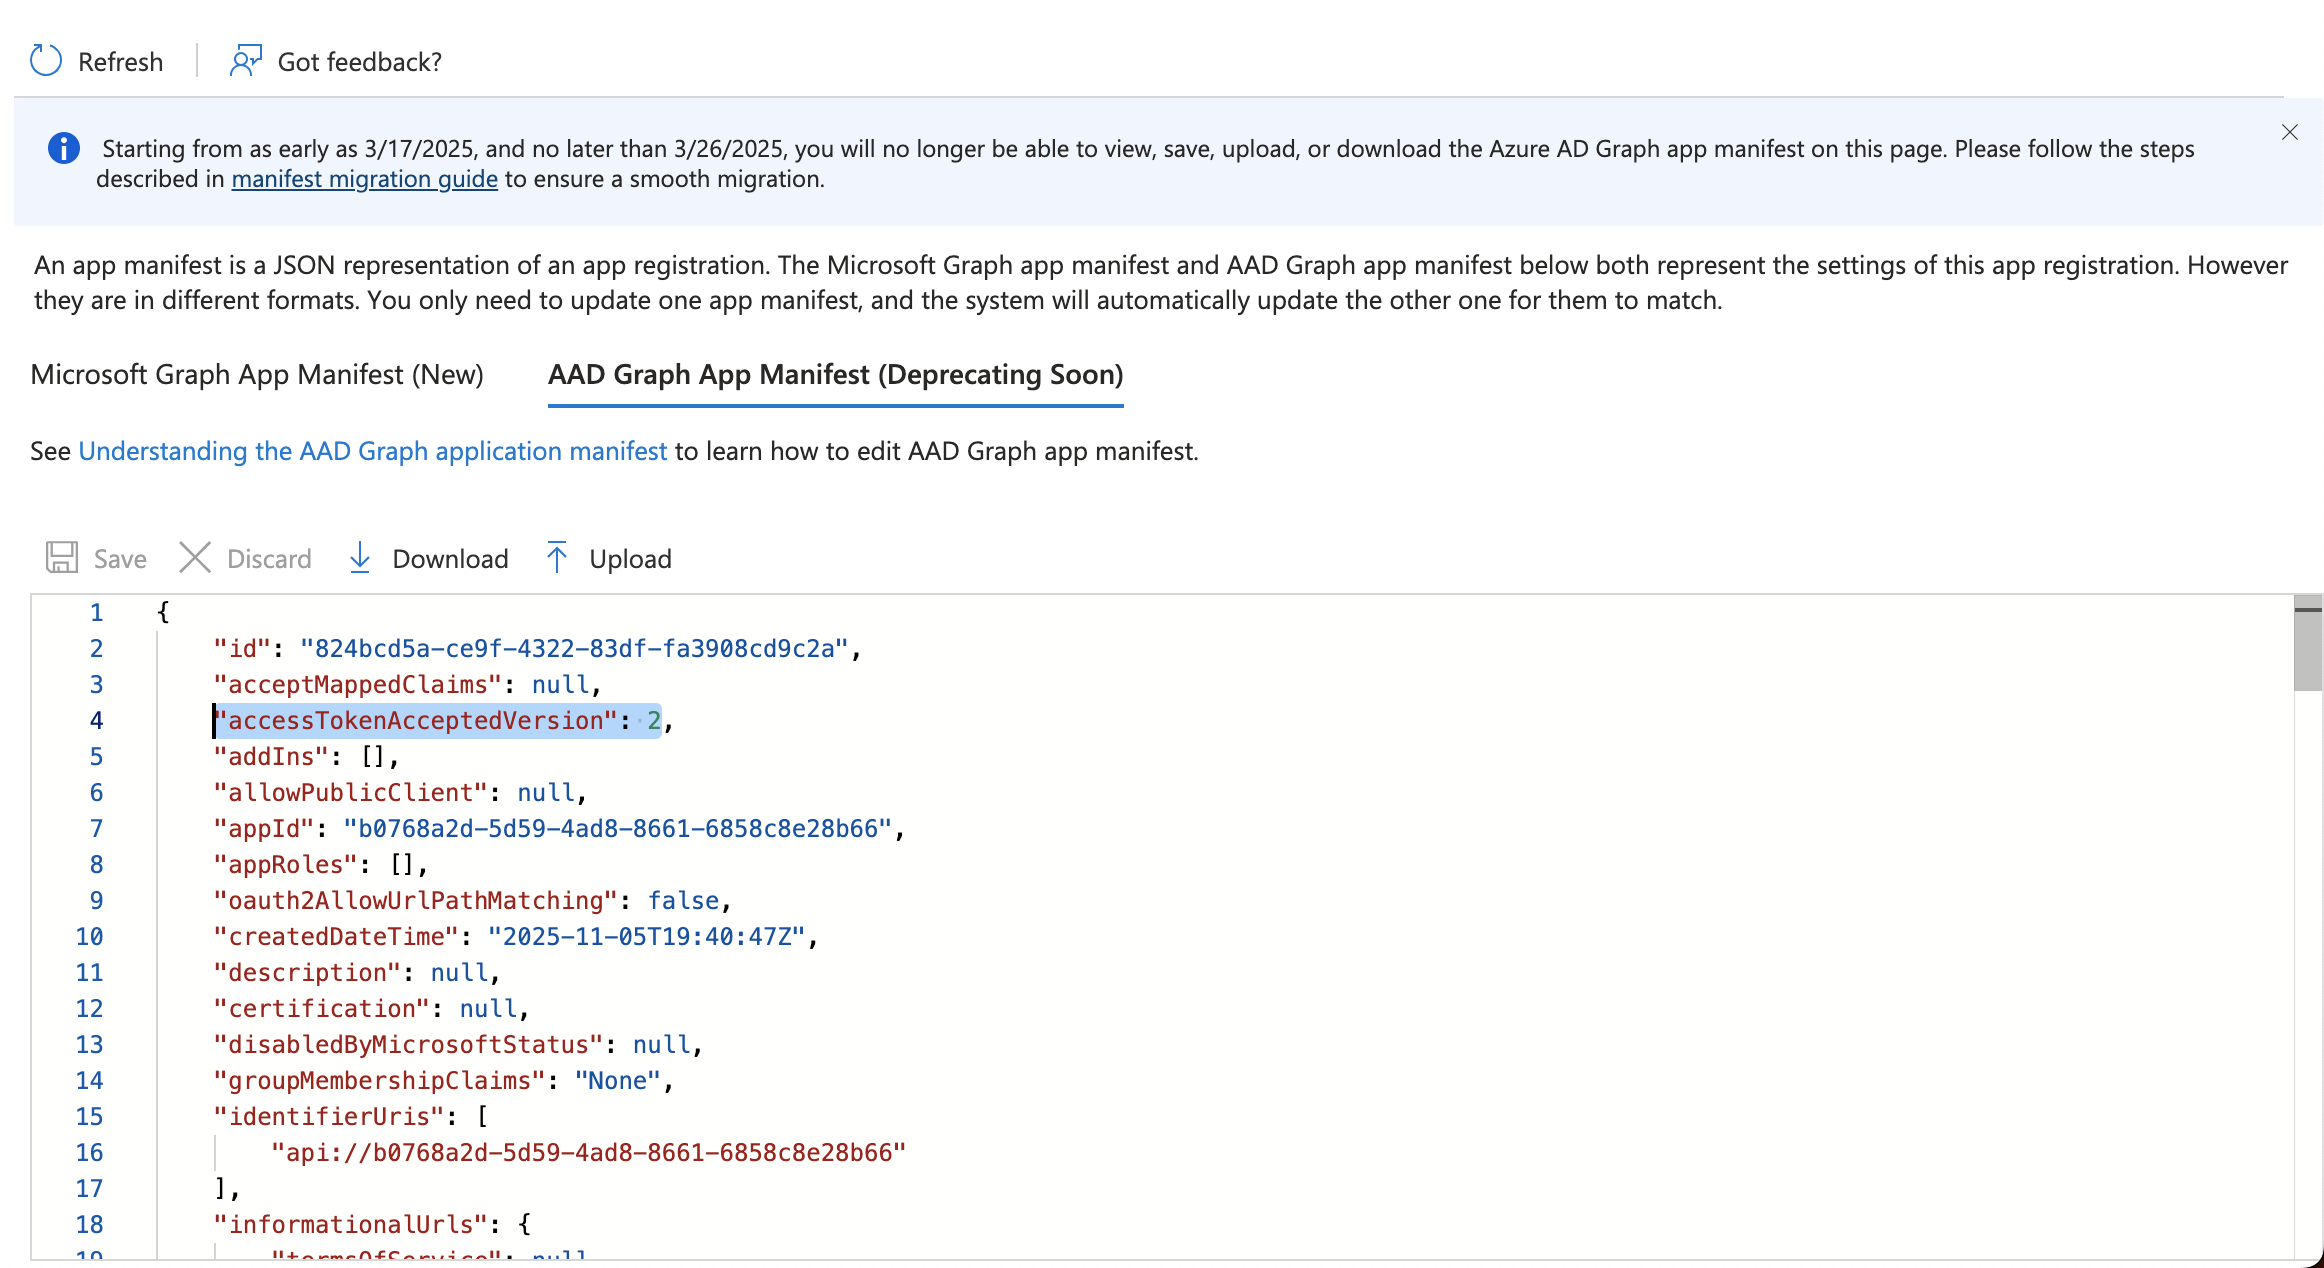
- Last step is to configure access to mobile applications. Click on Authentication on the left side menu and click on Add a platform (Single-page application with Redirect URIs should be already configured).
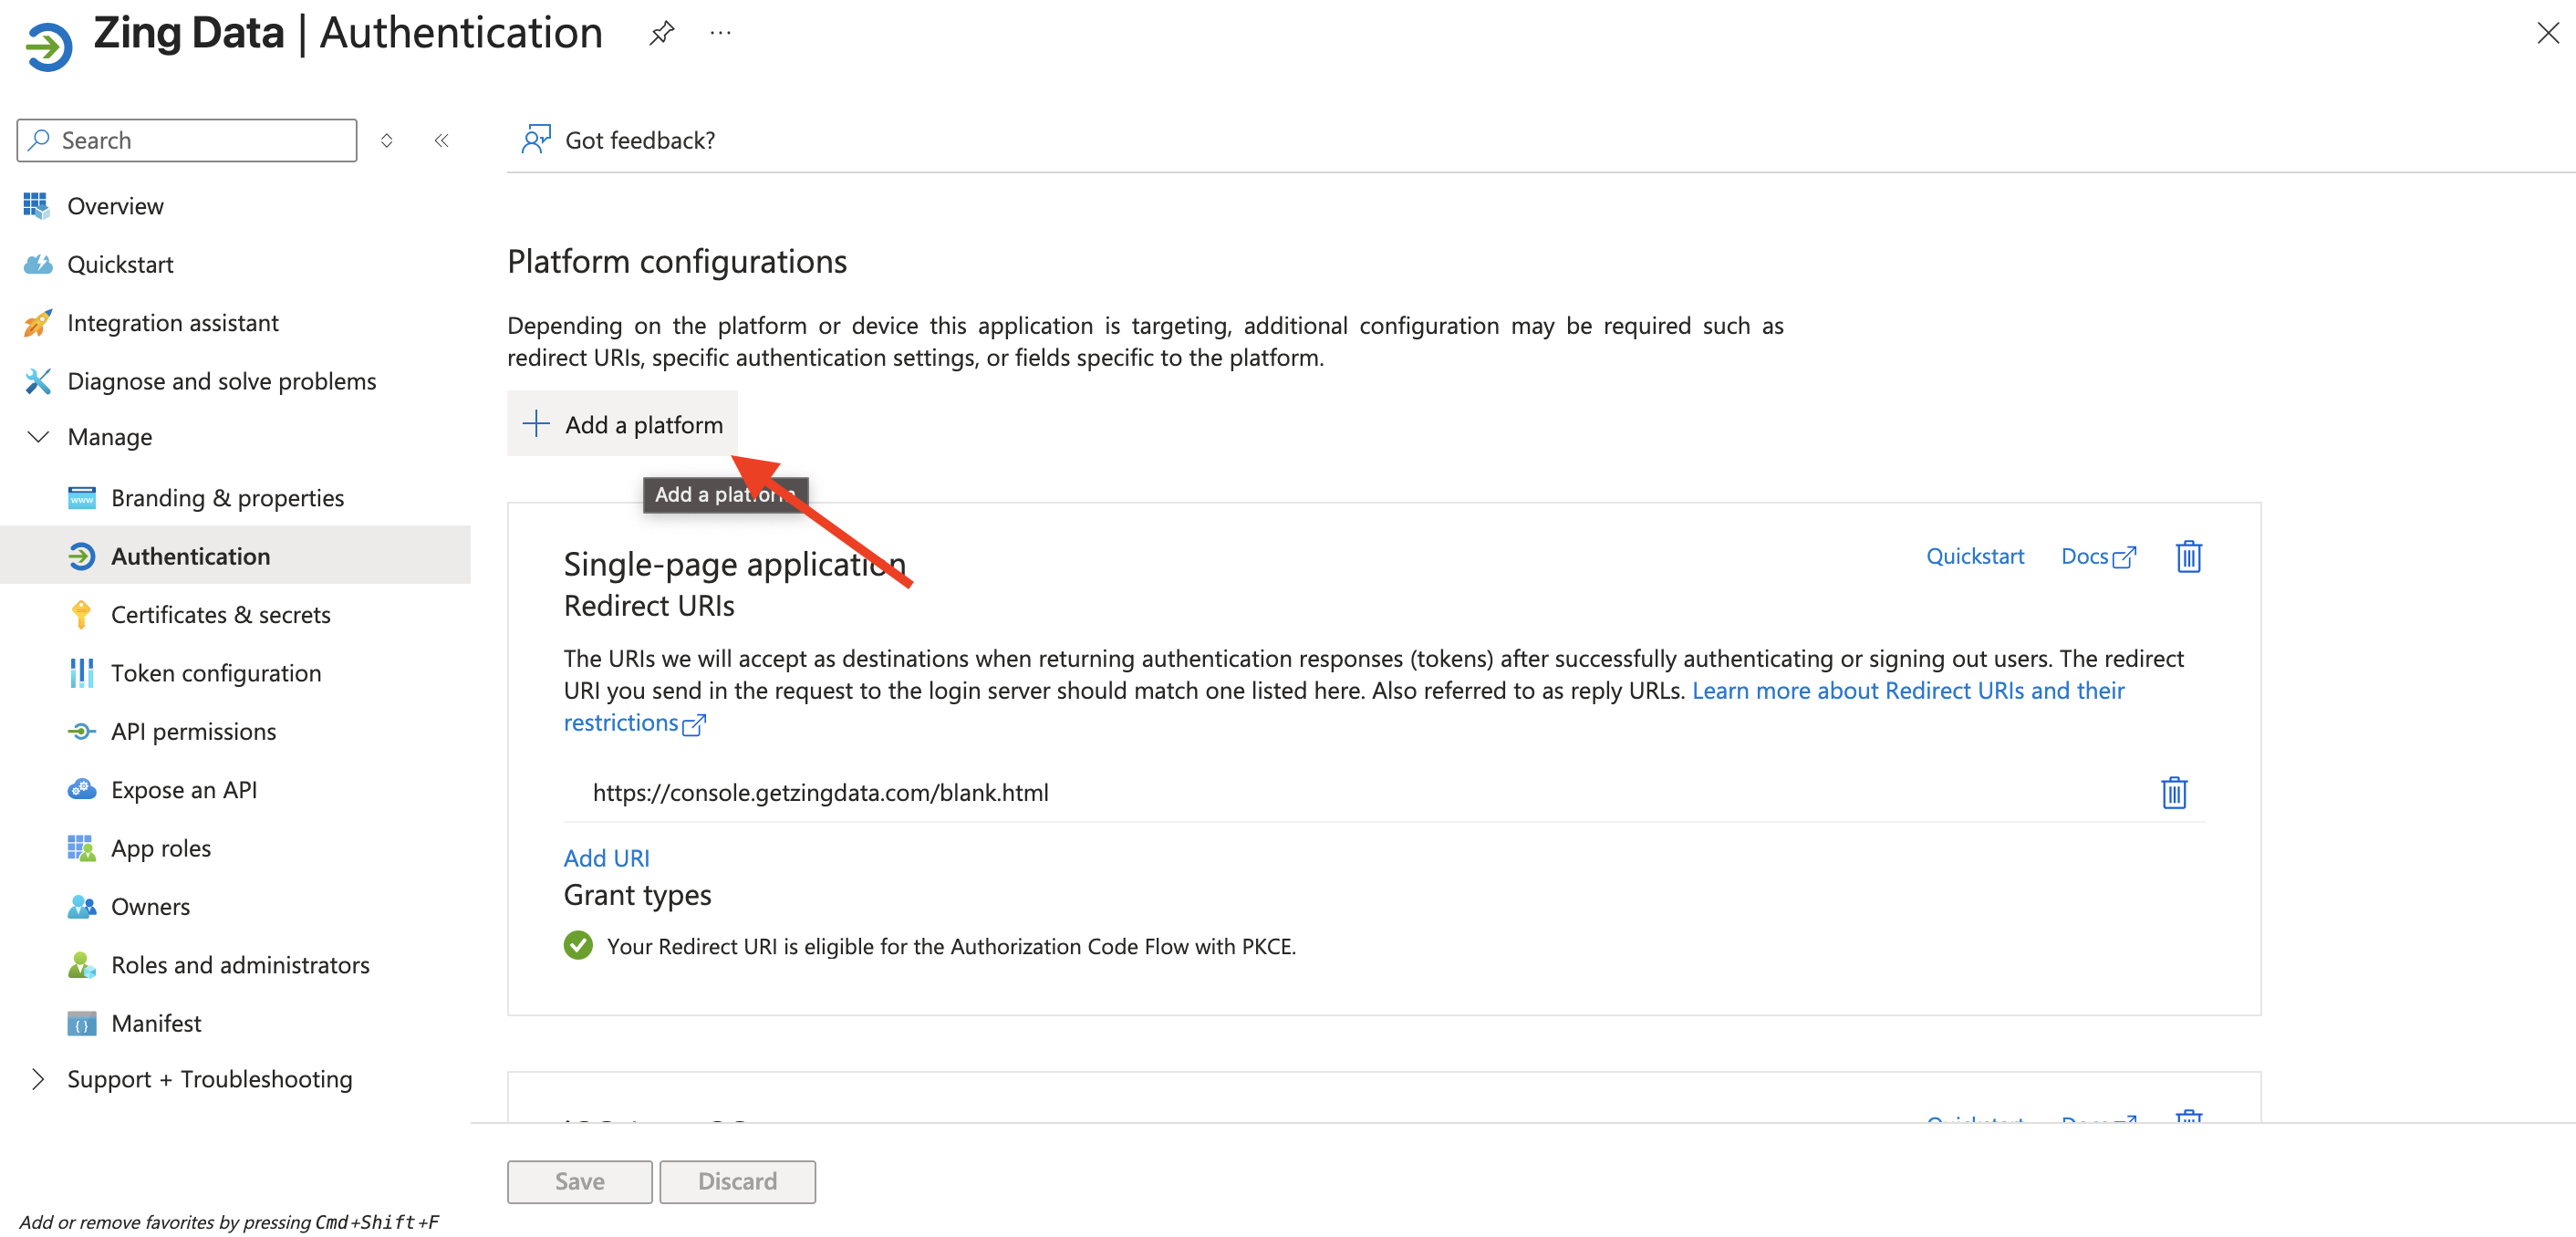
- Then fill it with the appropriate information for Android and iOS apps:
iOS:
Bundle ID: com.getzingdata.app
Android:
Package name: com.getzingdata.android
Signature hash: cnsx6OCEI/rJQqehq6baXX93c6w=
With all the steps above completed, everything should be in place for your SSO configuration in Microsoft Azure.
As a last step, please click on Overview in the left side menu and copy the Application (client) ID and Directory (tenant) ID values and send these values to the Zing Data enterprise support team to complete the integration.
8.2 - Okta SSO
Okta is a comprehensive identity and access management (IAM) solution providing:
Overview
This guide will help you configure Single Sign-On (SSO) between Okta and Zing Data, allowing your team members to securely access Zing Data using their Okta credentials.
Prerequisites
- Admin access to your Okta Access Gateway
- Admin access to your Zing Data account
- A valid Zing Data Enterprise subscription
Configuration Steps
Step 1: Add Zing Data in Okta
The Okta Access Gateway is a separate product from Okta. You can find it in the Okta Admin Console.
- Log in to your Okta Access Gateway Admin Console
- Navigate to Applications > Applications
- Click Add Application
- Click Create New App
- Select:
- Platform: Web
- Sign-on method: SAML 2.0
- Click Create
Step 2: Configure SAML Settings
In the SAML Settings section, enter the following:
General Settings:
- App name: Zing Data
- App logo (optional): [Download Zing Data logo]
SAML Settings:
- Single Sign-On URL:
https://console.getzingdata.com/login-sso - Audience URI (SP Entity ID):
https://console.getzingdata.com - Name ID format: EmailAddress
- Application username: Email
Attribute Statements (optional):
- email: user.email
- firstName: user.firstName
- lastName: user.lastName
Step 3: Assign Users
In Okta:
- Navigate to your Zing Data application
- Go to the Assignments tab
- Click Assign > Assign to People
- Select users or groups to grant access
- Click Save
Step 4: Zing Data Configuration
Email us at support@getzingdata.com with the above details to get your Zing Data SSO configuration completed.
Testing the Integration
- Log out of Zing Data
- Access your Okta dashboard
- Click on the Zing Data tile
- You should be automatically signed in to Zing Data
Troubleshooting
If you encounter any issues:
- Verify all URLs and certificates are correctly copied
- Ensure users are properly assigned in Okta
- Check that the email addresses match between Okta and Zing Data
- Contact Zing Data support at [support email] for additional assistance
Additional Resources
9 - Charting & Data Tables
Zing will automatically display the data in a way that makes sense for the data you selected. For instance, if you have time as field in your question, Zing will automatically plot time on the x-axis from low to high. You can easily change to an alternative visualization if you wish, and can re-order data points, as described below.
If a question does not have a visualization which can be displayed (e.g. a table of text fields), Zing will simply show a table of results. Custom queries (where you provide SQL instead of using Zing’s tap-to-query interface) will display results using a table.
Visualization Types
Zing offers a range of visualization types, which vary based on the number of fields (and field type) returned in your question’s answer:
- Bar
- Stacked Bar
- Stacked Bar 100%
- Stacked Line
- Line
- Data Table
- Horizontal Bar
- Area
- Scatter Plot
- Donut
- Map
- Funnel
- Big Number
- Combo chart (Line + Bar)
Toggle between chart types and data tables by tapping the upper right Chart Selection drop down
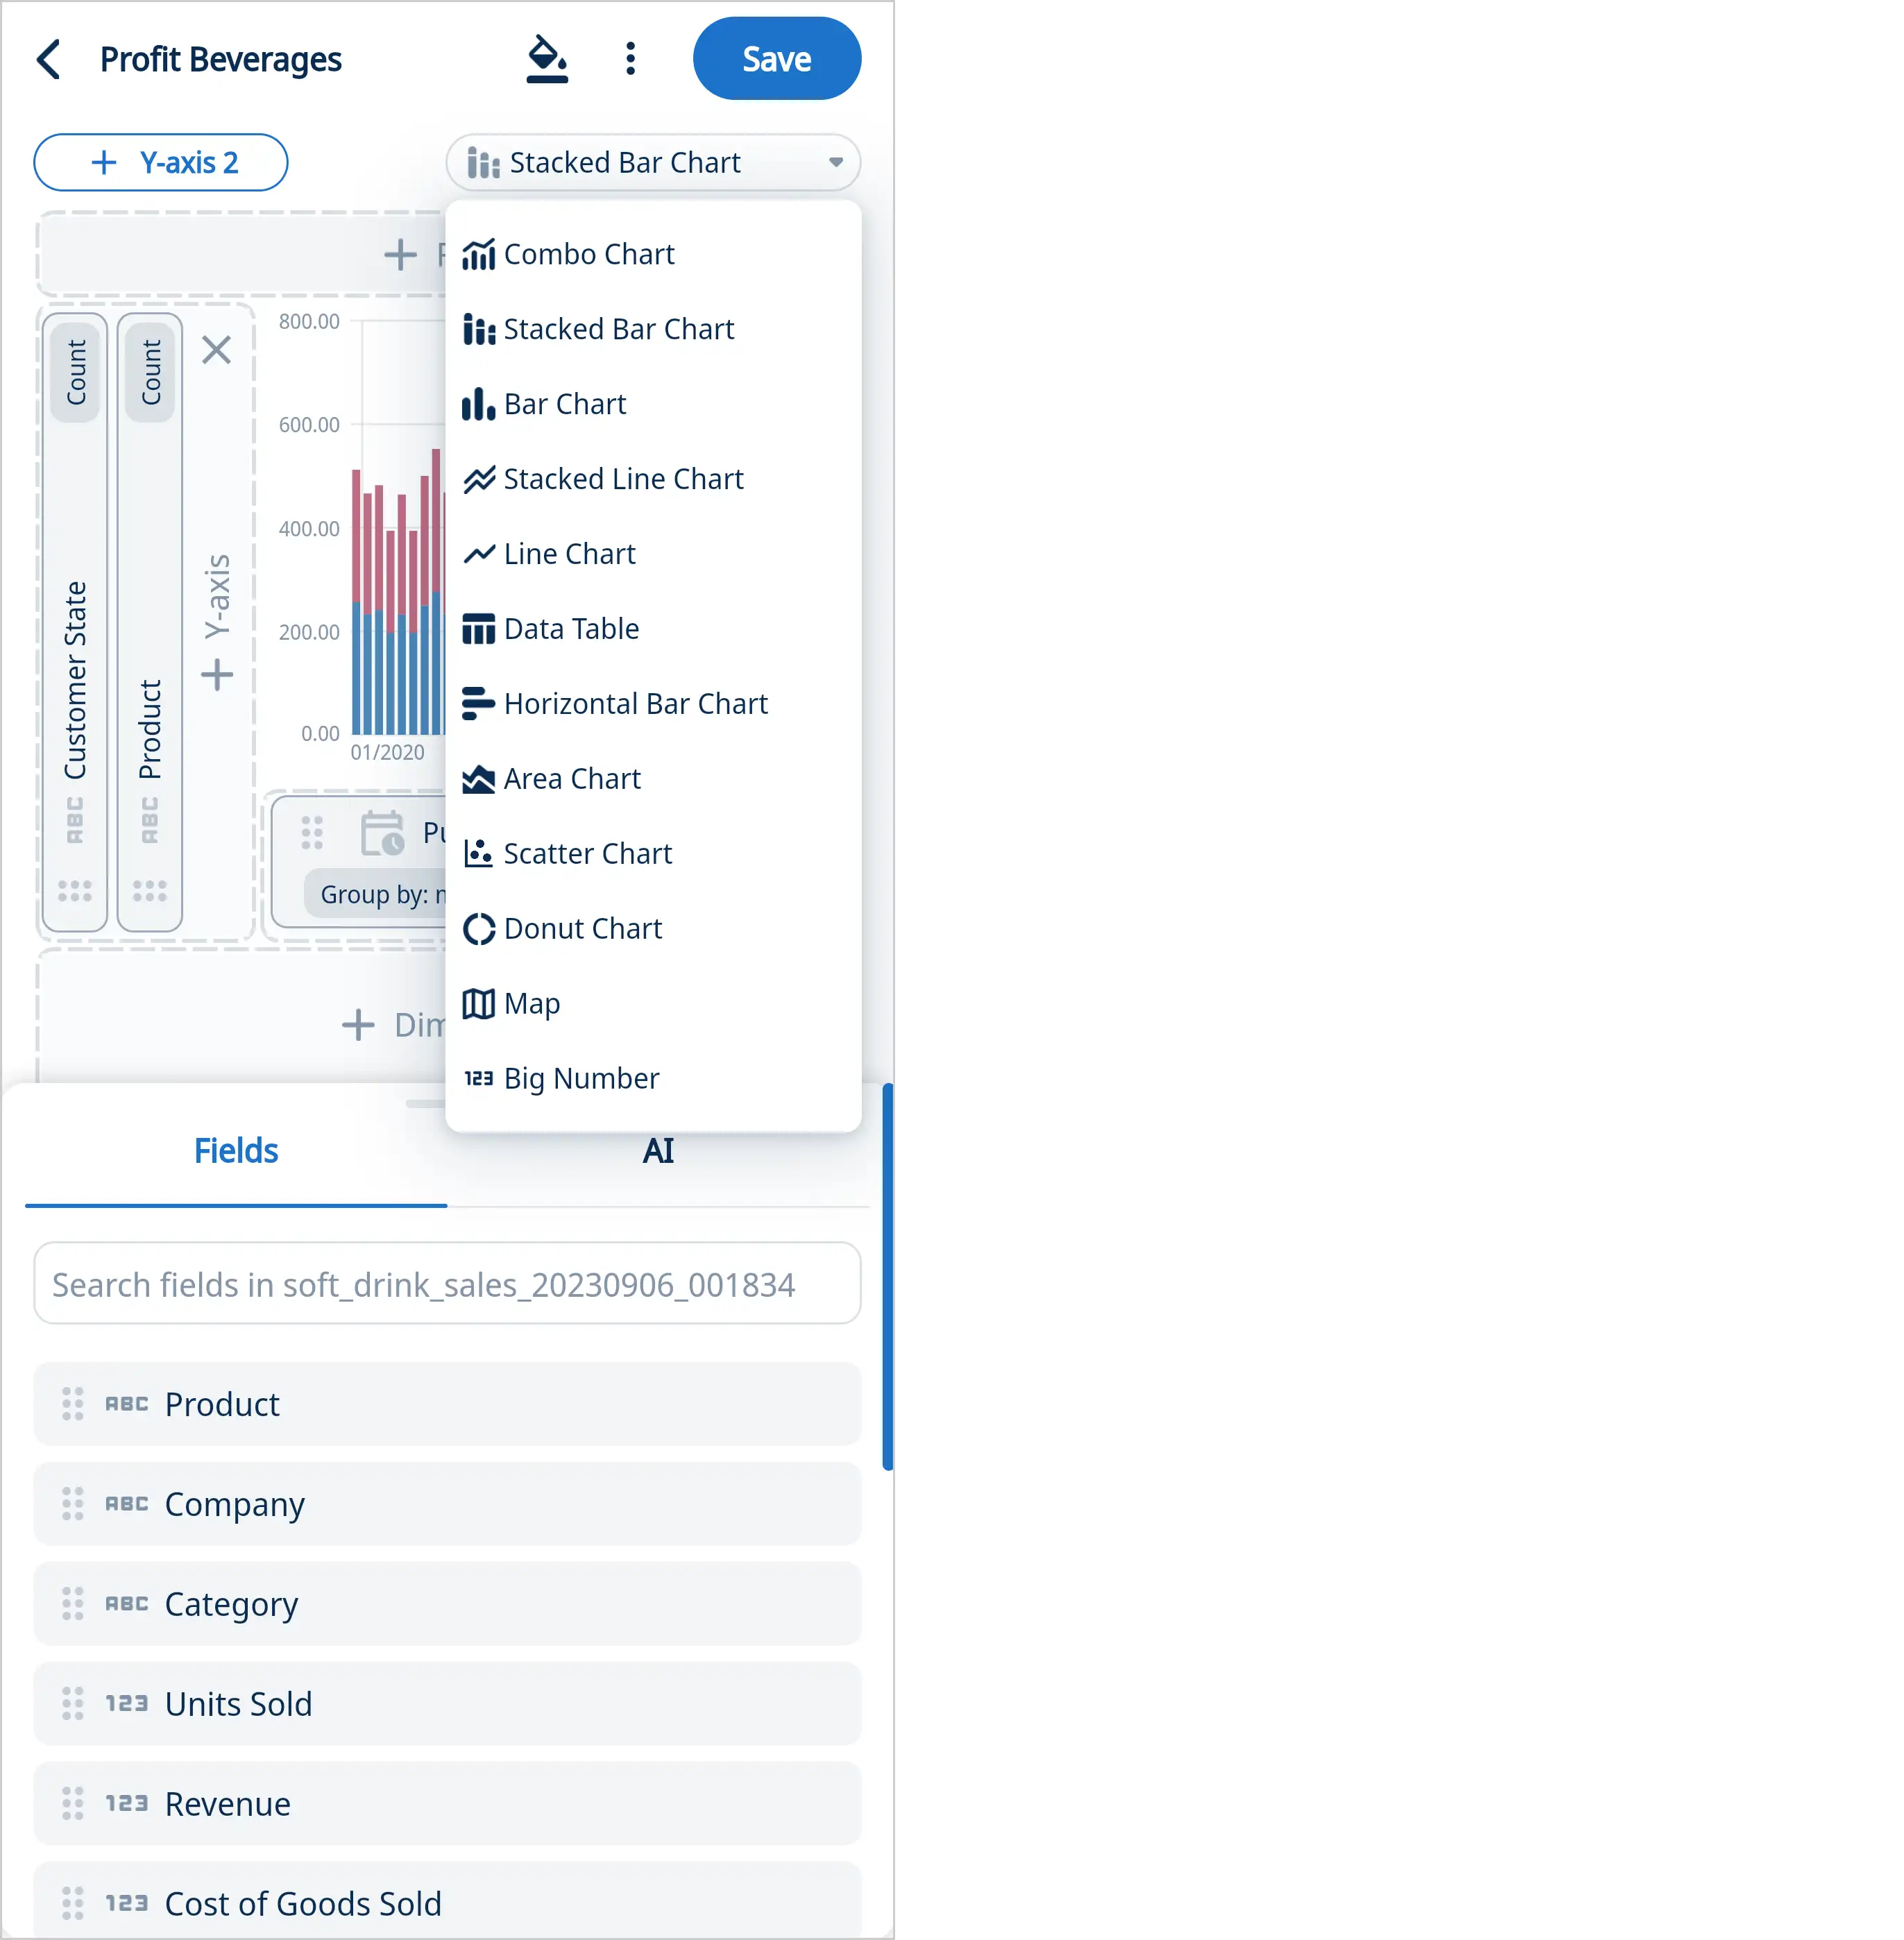
Tap on a data point in a chart to see a tooltip showing with the value of that data point and its category.
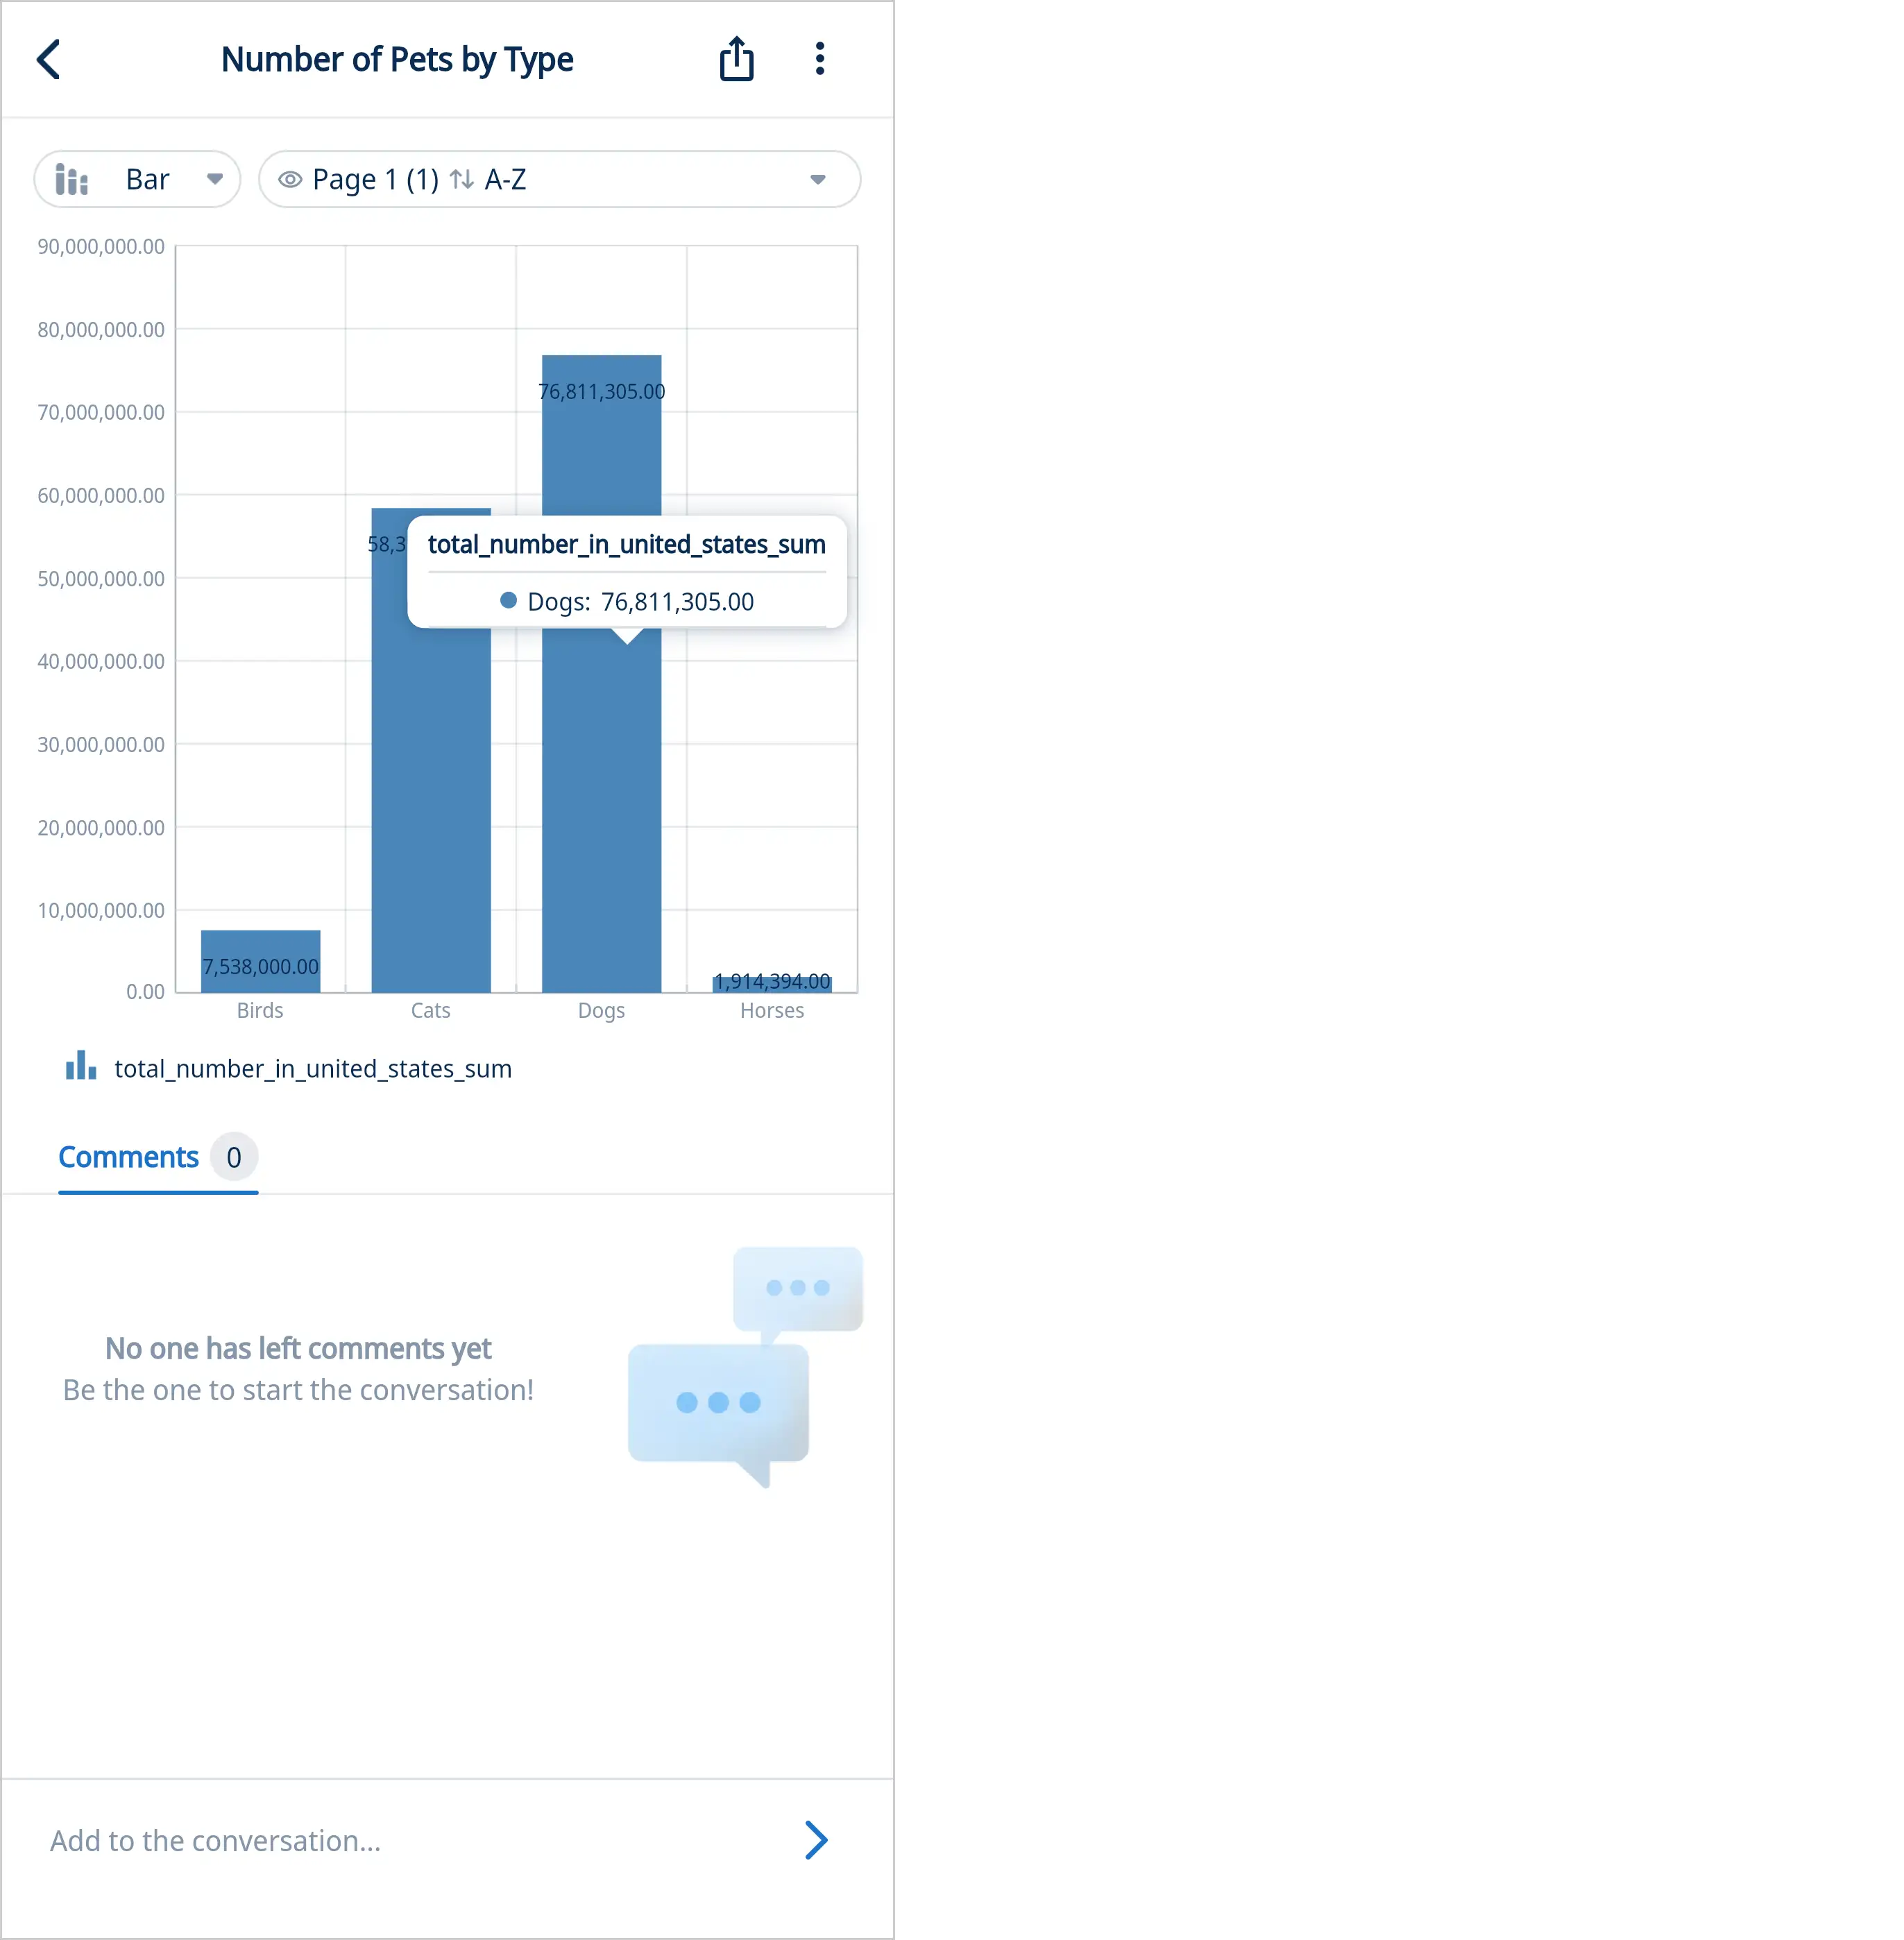
On iOS and Android, you can pinch-to-zoom into specific values or part of a graph.
Limits
By default, a limit is applied when you run a query (50 by default) and that is shown in the filter section to speed up query runtimes, and reduce visual clutter.
To adjust the data shown, click on the ’limit’ section in the filter panel [1] and enter a custom value (up to 10,000) [2].
If you are using custom SQL, no limit will be applied unless you have specified a limit within your custom SQL code.
If you need to export the full dataset to CSV, please visit the Exporting Graphs and Data Tables section below where you can export the full results set with no limits.
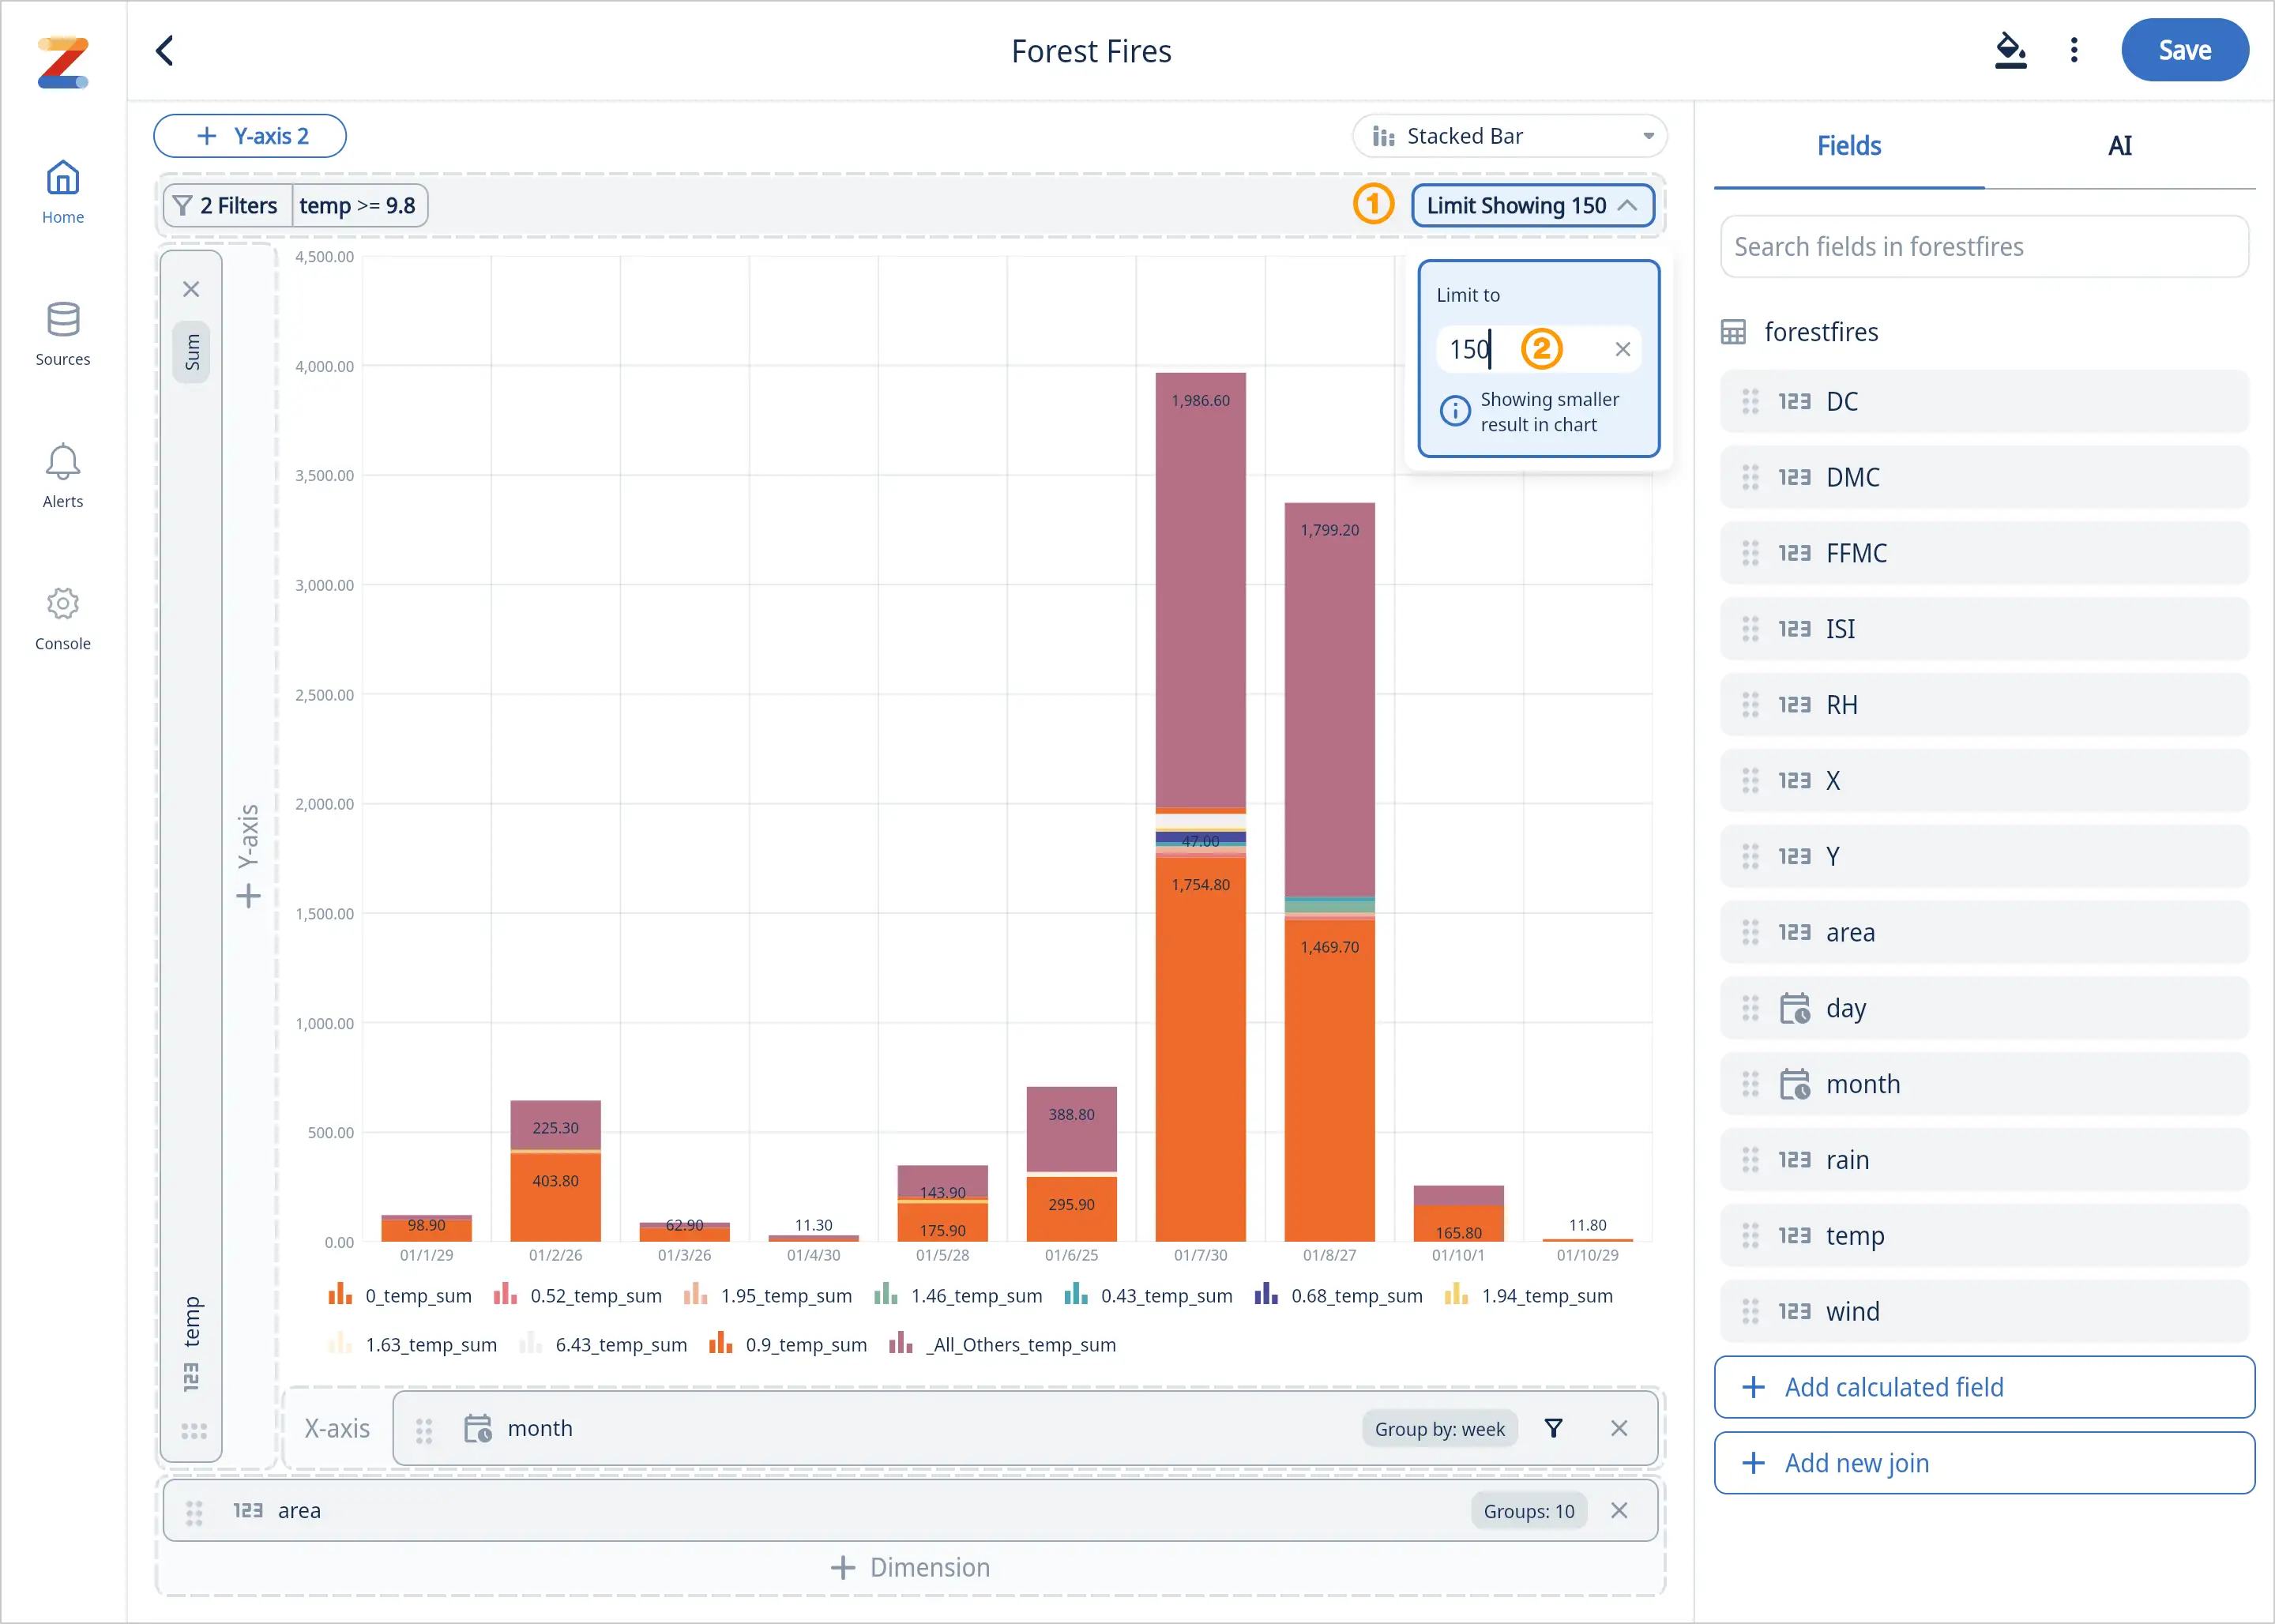
Sorting
You can easily change the order values are displayed on the graph or data table.
To sort a graph, tap the x-axis and a ‘sort by’ controls will appear below your chart. You can sort by the x-axis, or y-axis from ascending or descending order.
To sort a data table, tap the field name and it toggle between unsorted, descending, and ascending.
Grouping and Totals
In Data Table mode you can optionally show the first value of a category (akin to a pivot table in Excel) by clicking ‘Group By’ and then turning on ‘Show Distinct Values’, organizing the subcategories within.
- For Sum, Count, and Count Distinct, you can optionally show subtotals for ‘Group By’ fields using the ‘Show Totals’ feature.
New Features:
- Window Size: Specify the window size to control the data scope within your tables. This lets you manage how many groups are displayed and consolidate less common values into an “other” category for better clarity.
- Grouping: By default, you’ll see 10 groups with 9 main groups and the rest categorized as “other.” You can change the number of groups by updating the value.
- ‘Partition By’: Enhanced support for the ‘partition by’ clause enables more efficient data partitioning and the ability to handle more complex calculations in calculated fields on the Y-axis when displaying charts.
Note: Filters support up to 6 layers of nesting within filter groups. This feature is compatible with both natural language and visual query inputs.
Time Comparisons
You can easily change the order values are displayed on the graph or data table.
To add a time comparison to your chart or data table, simply:
-
-
Locate the filter or conditions area for your chart. Click the ’+’ icon to add a new condition.
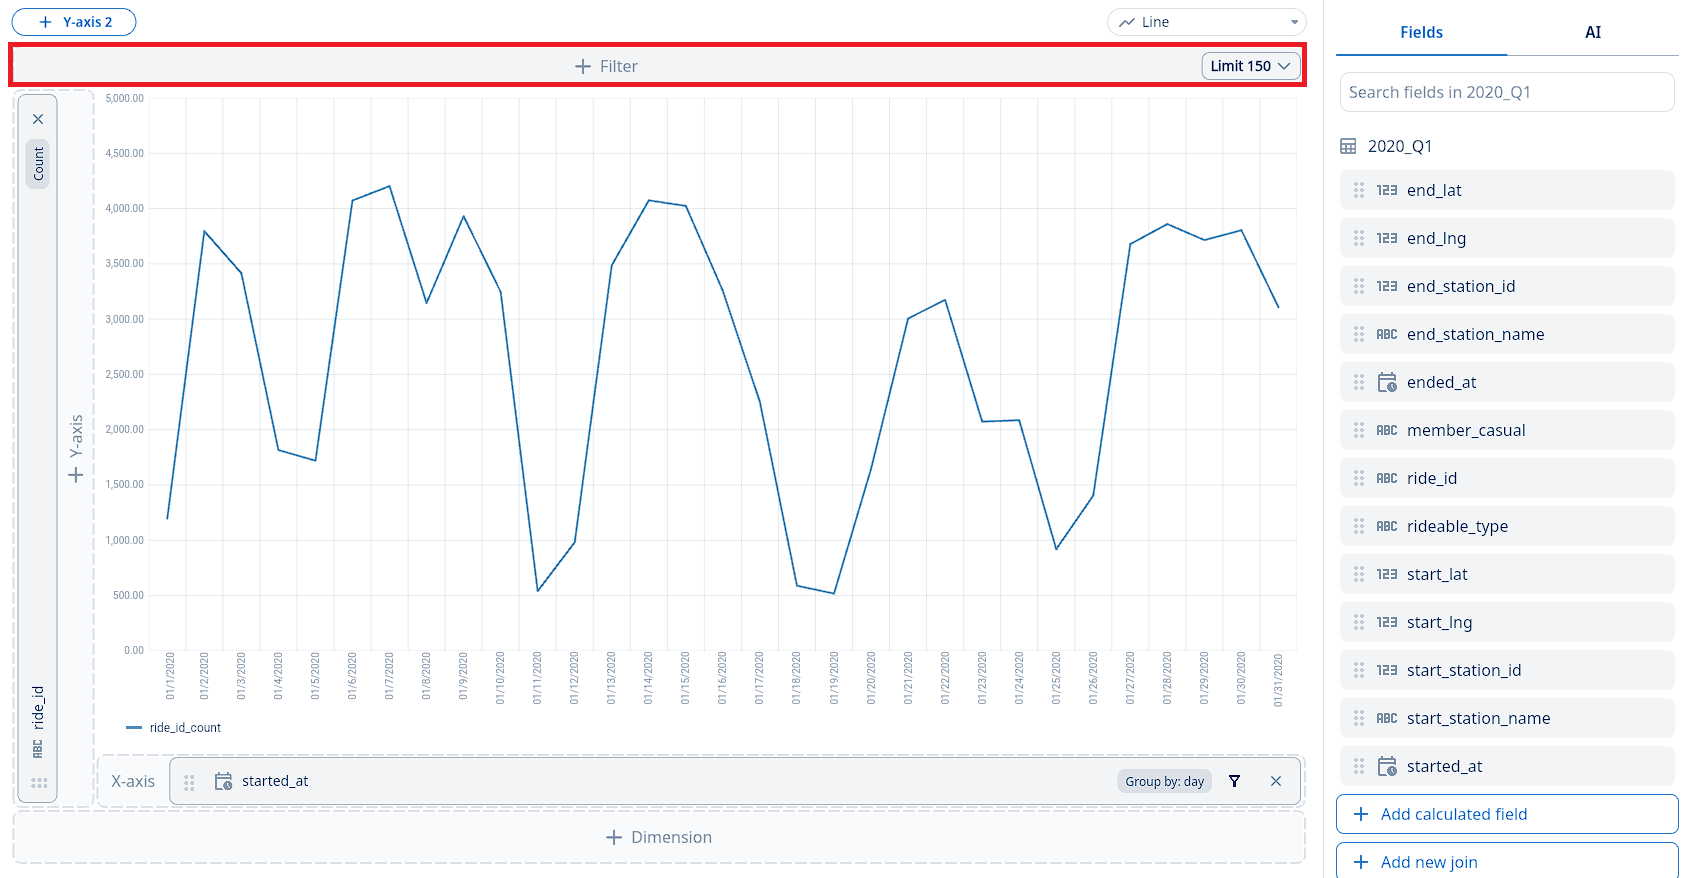
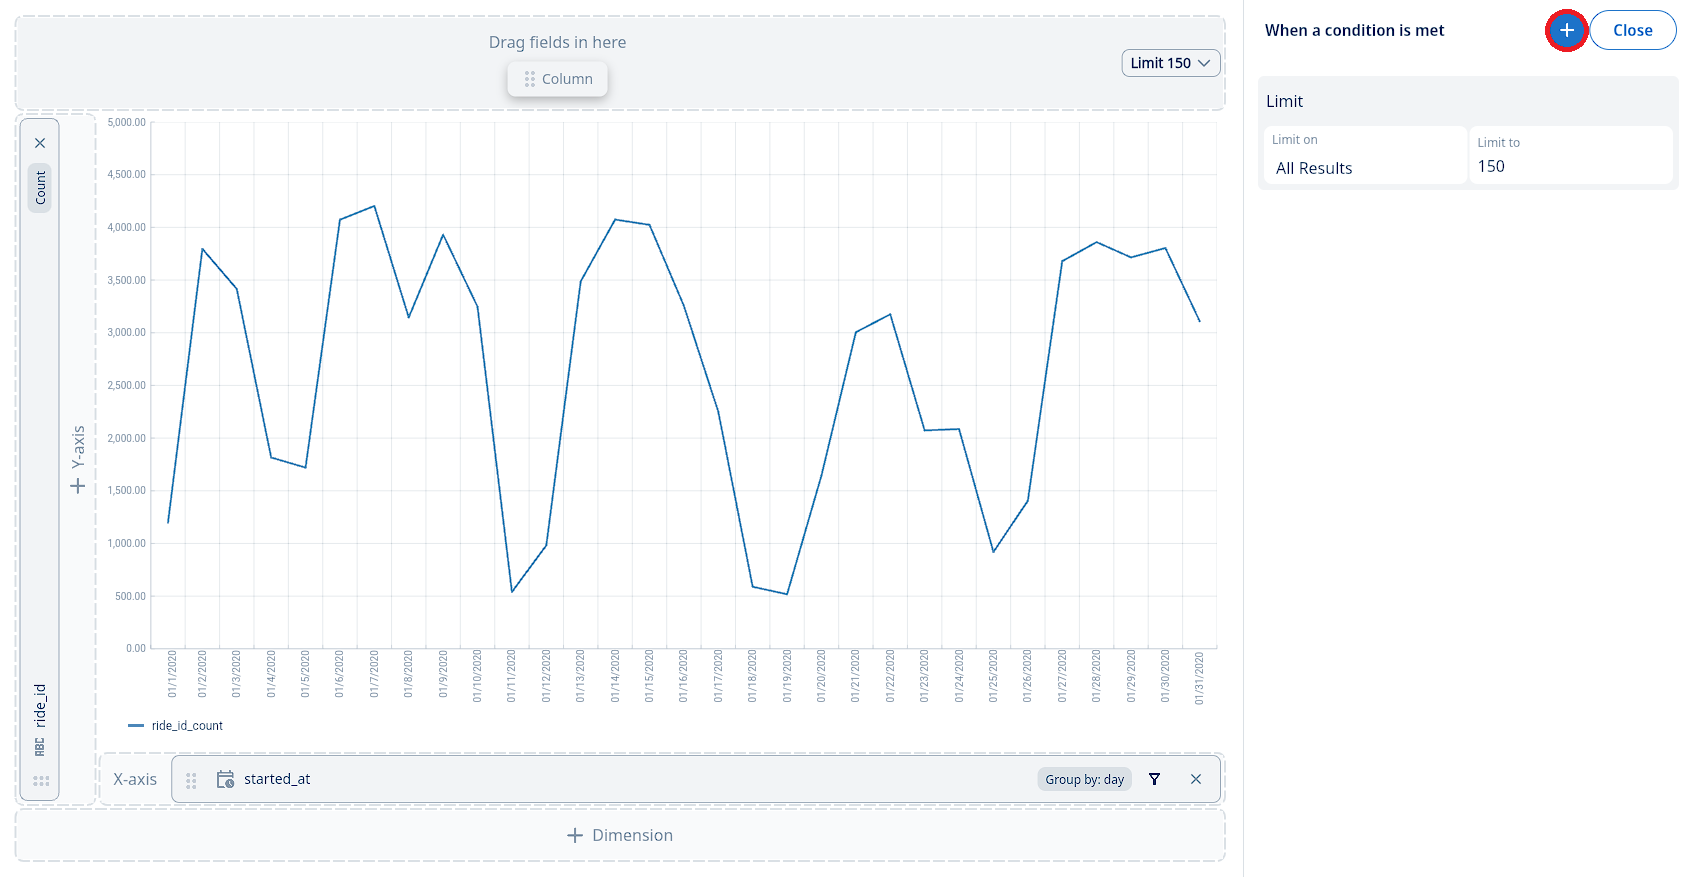
-
From the menu that appears, select “Add condition and compare”. This will open the interface for setting up your time-based comparison.
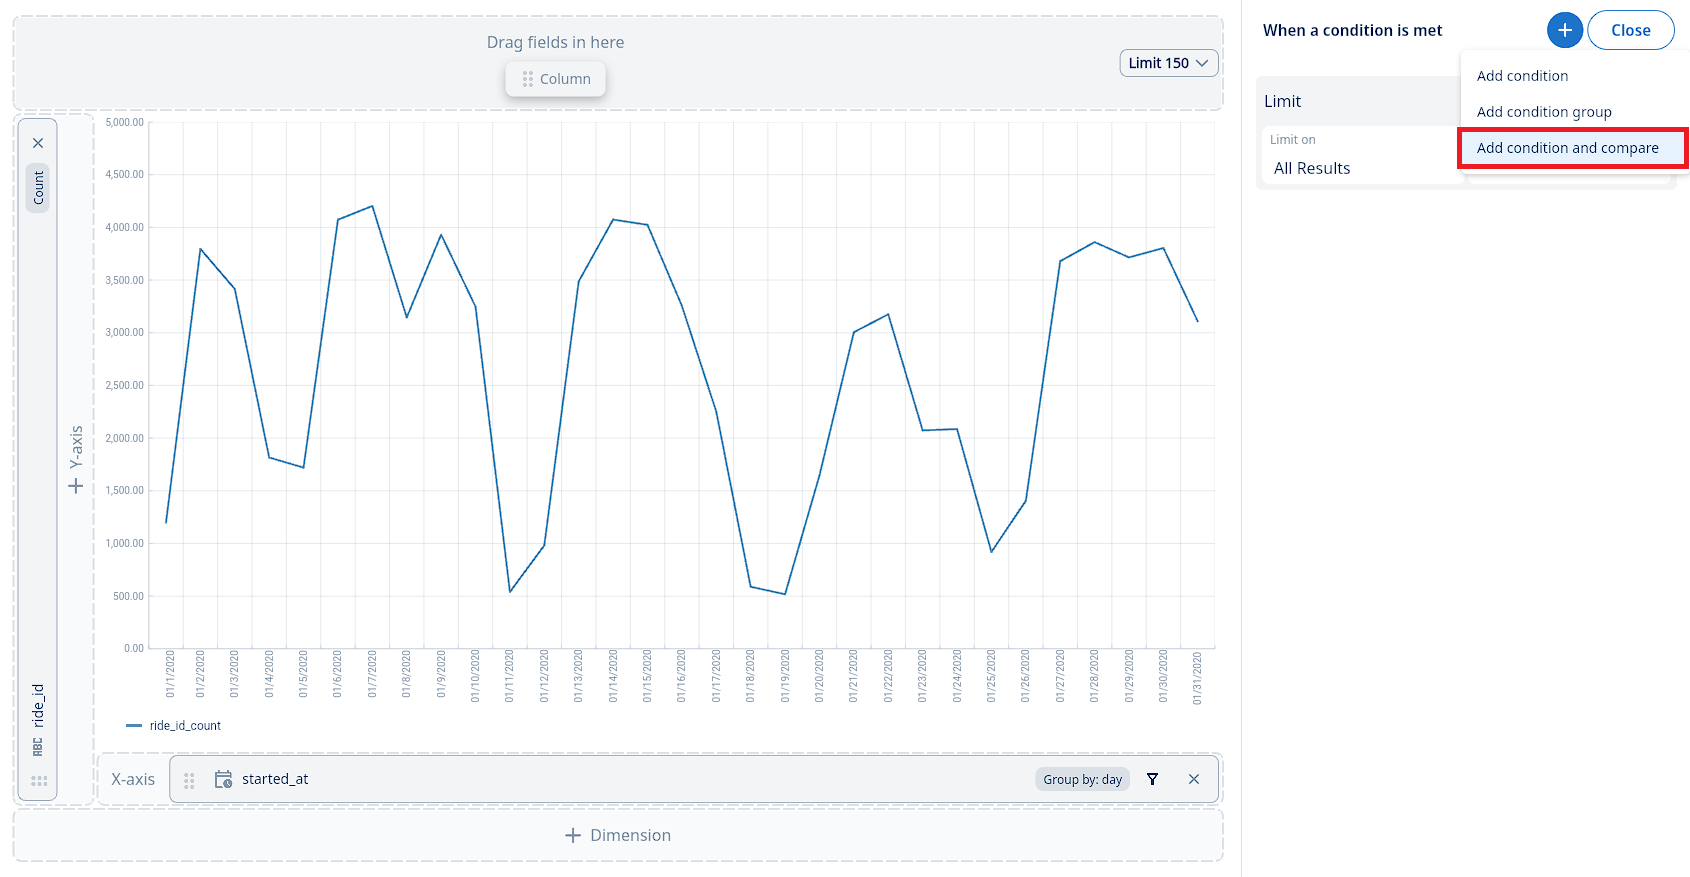
-
Configure your time comparison:
- First, select the date/time field you wish to analyze (e.g., event_time).
- Next, define the primary time range for your data. You can choose from options like:
- Relative past dates (e.g., “Past 60 days”, “Previous 12 months”)
- Specific date ranges (e.g., “After a date”, “Between two dates”)
- Relative future dates (e.g., “Next 24 hours”, “Next two quarters”)
- Relative past to future dates (e.g., “Past 7 days to next 7 days”)
- Ensure the Compare toggle is switched ON.
- Finally, select your desired comparison type:
- vs Previous period: This compares your selected time range with the immediately preceding period of the same duration. For example, if you selected “Past 60 days”, this would compare it to the 60 days prior to that period. If you chose March 15 - March 25 (10 days), the previous period comparison would be March 5 - March 15.
- vs Same period last year: This compares your selected time range with the exact same date range from the previous year. For example, if you selected March 15, 2023 - March 25, 2023, this option would compare it to March 15, 2022 - March 25, 2022.
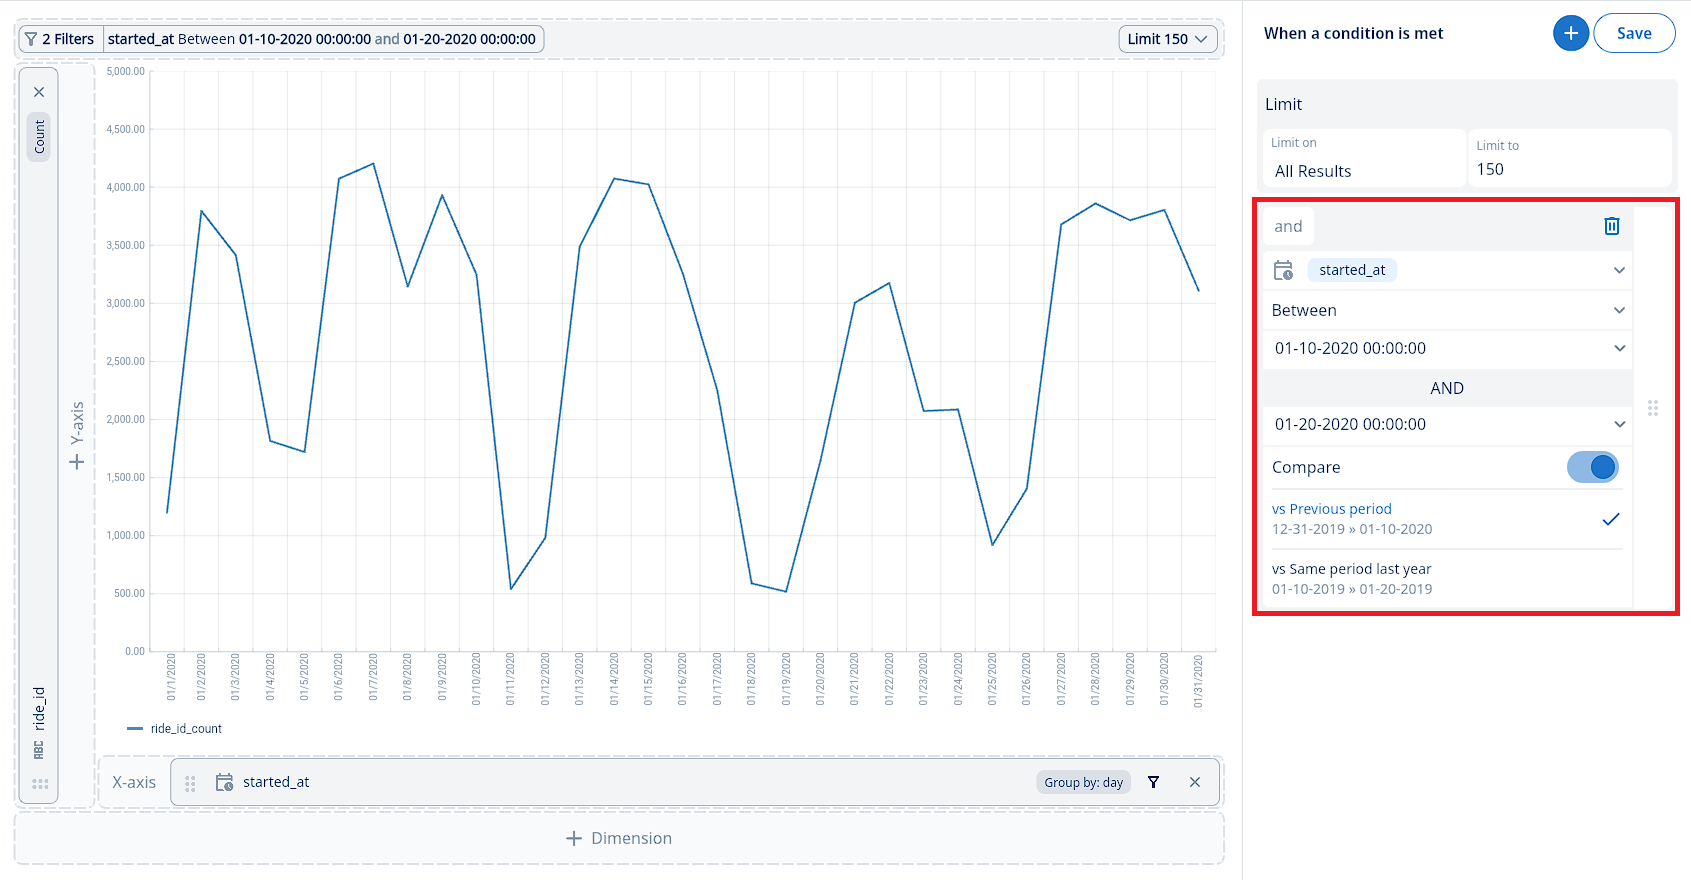
Relative dates into the future dates can be useful for looking at forecasts and having a ‘rolling’ period which always shows data relative to the time the question is run.
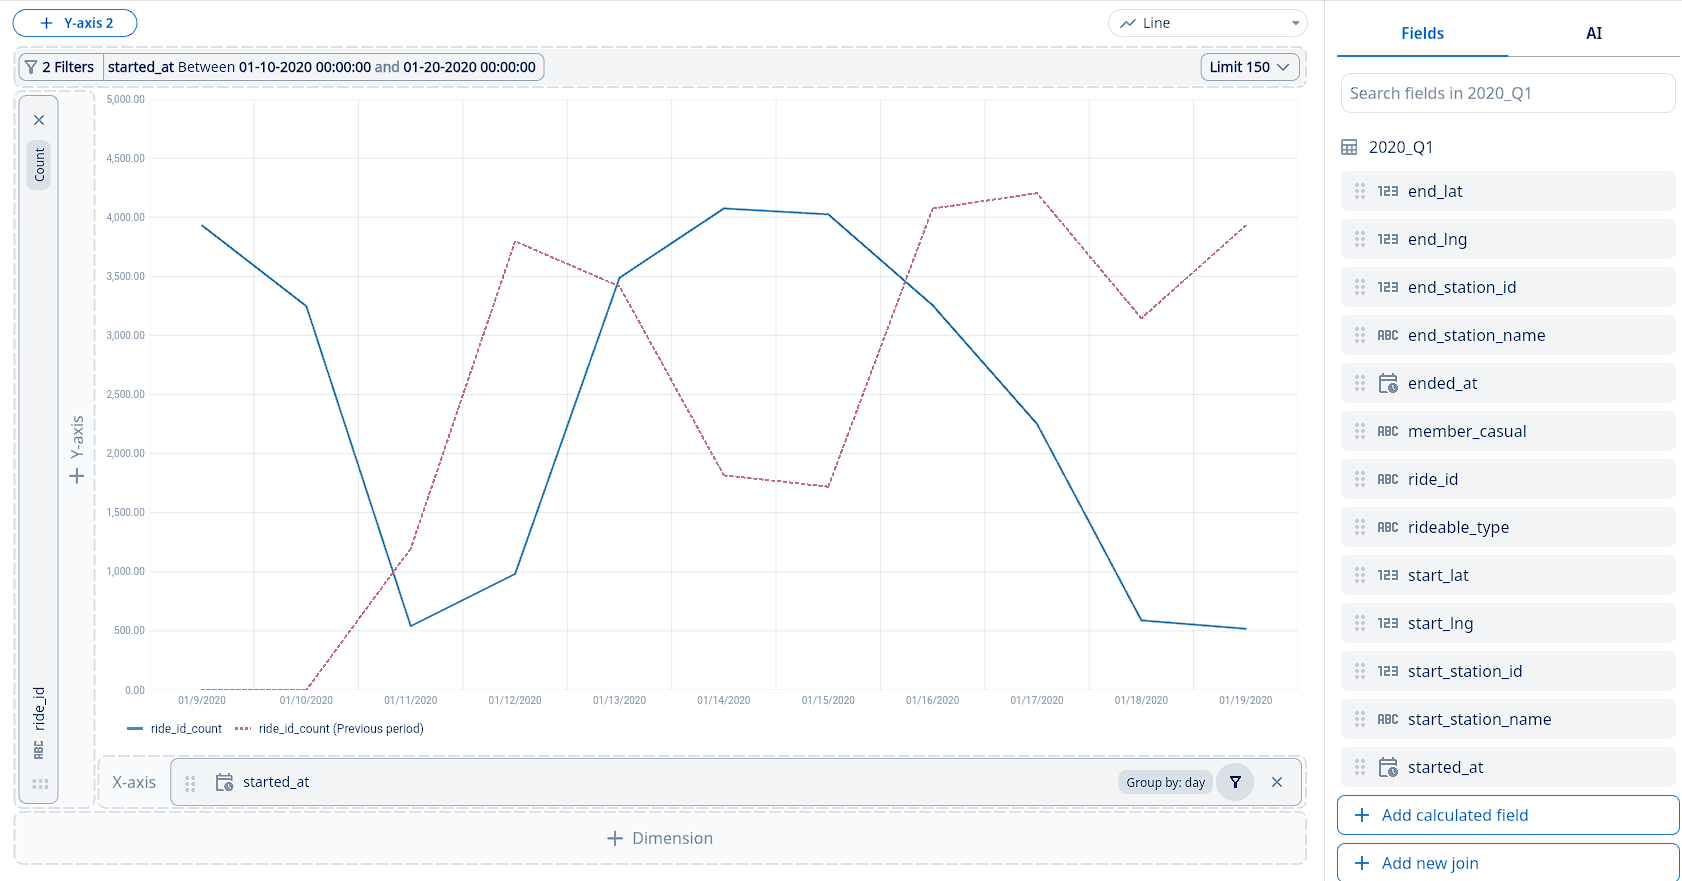
-
Exclude, Drill Down, or Show Values for Specific Data
Explore your data further with an easy-to-use contextual menu, take a quick tour:
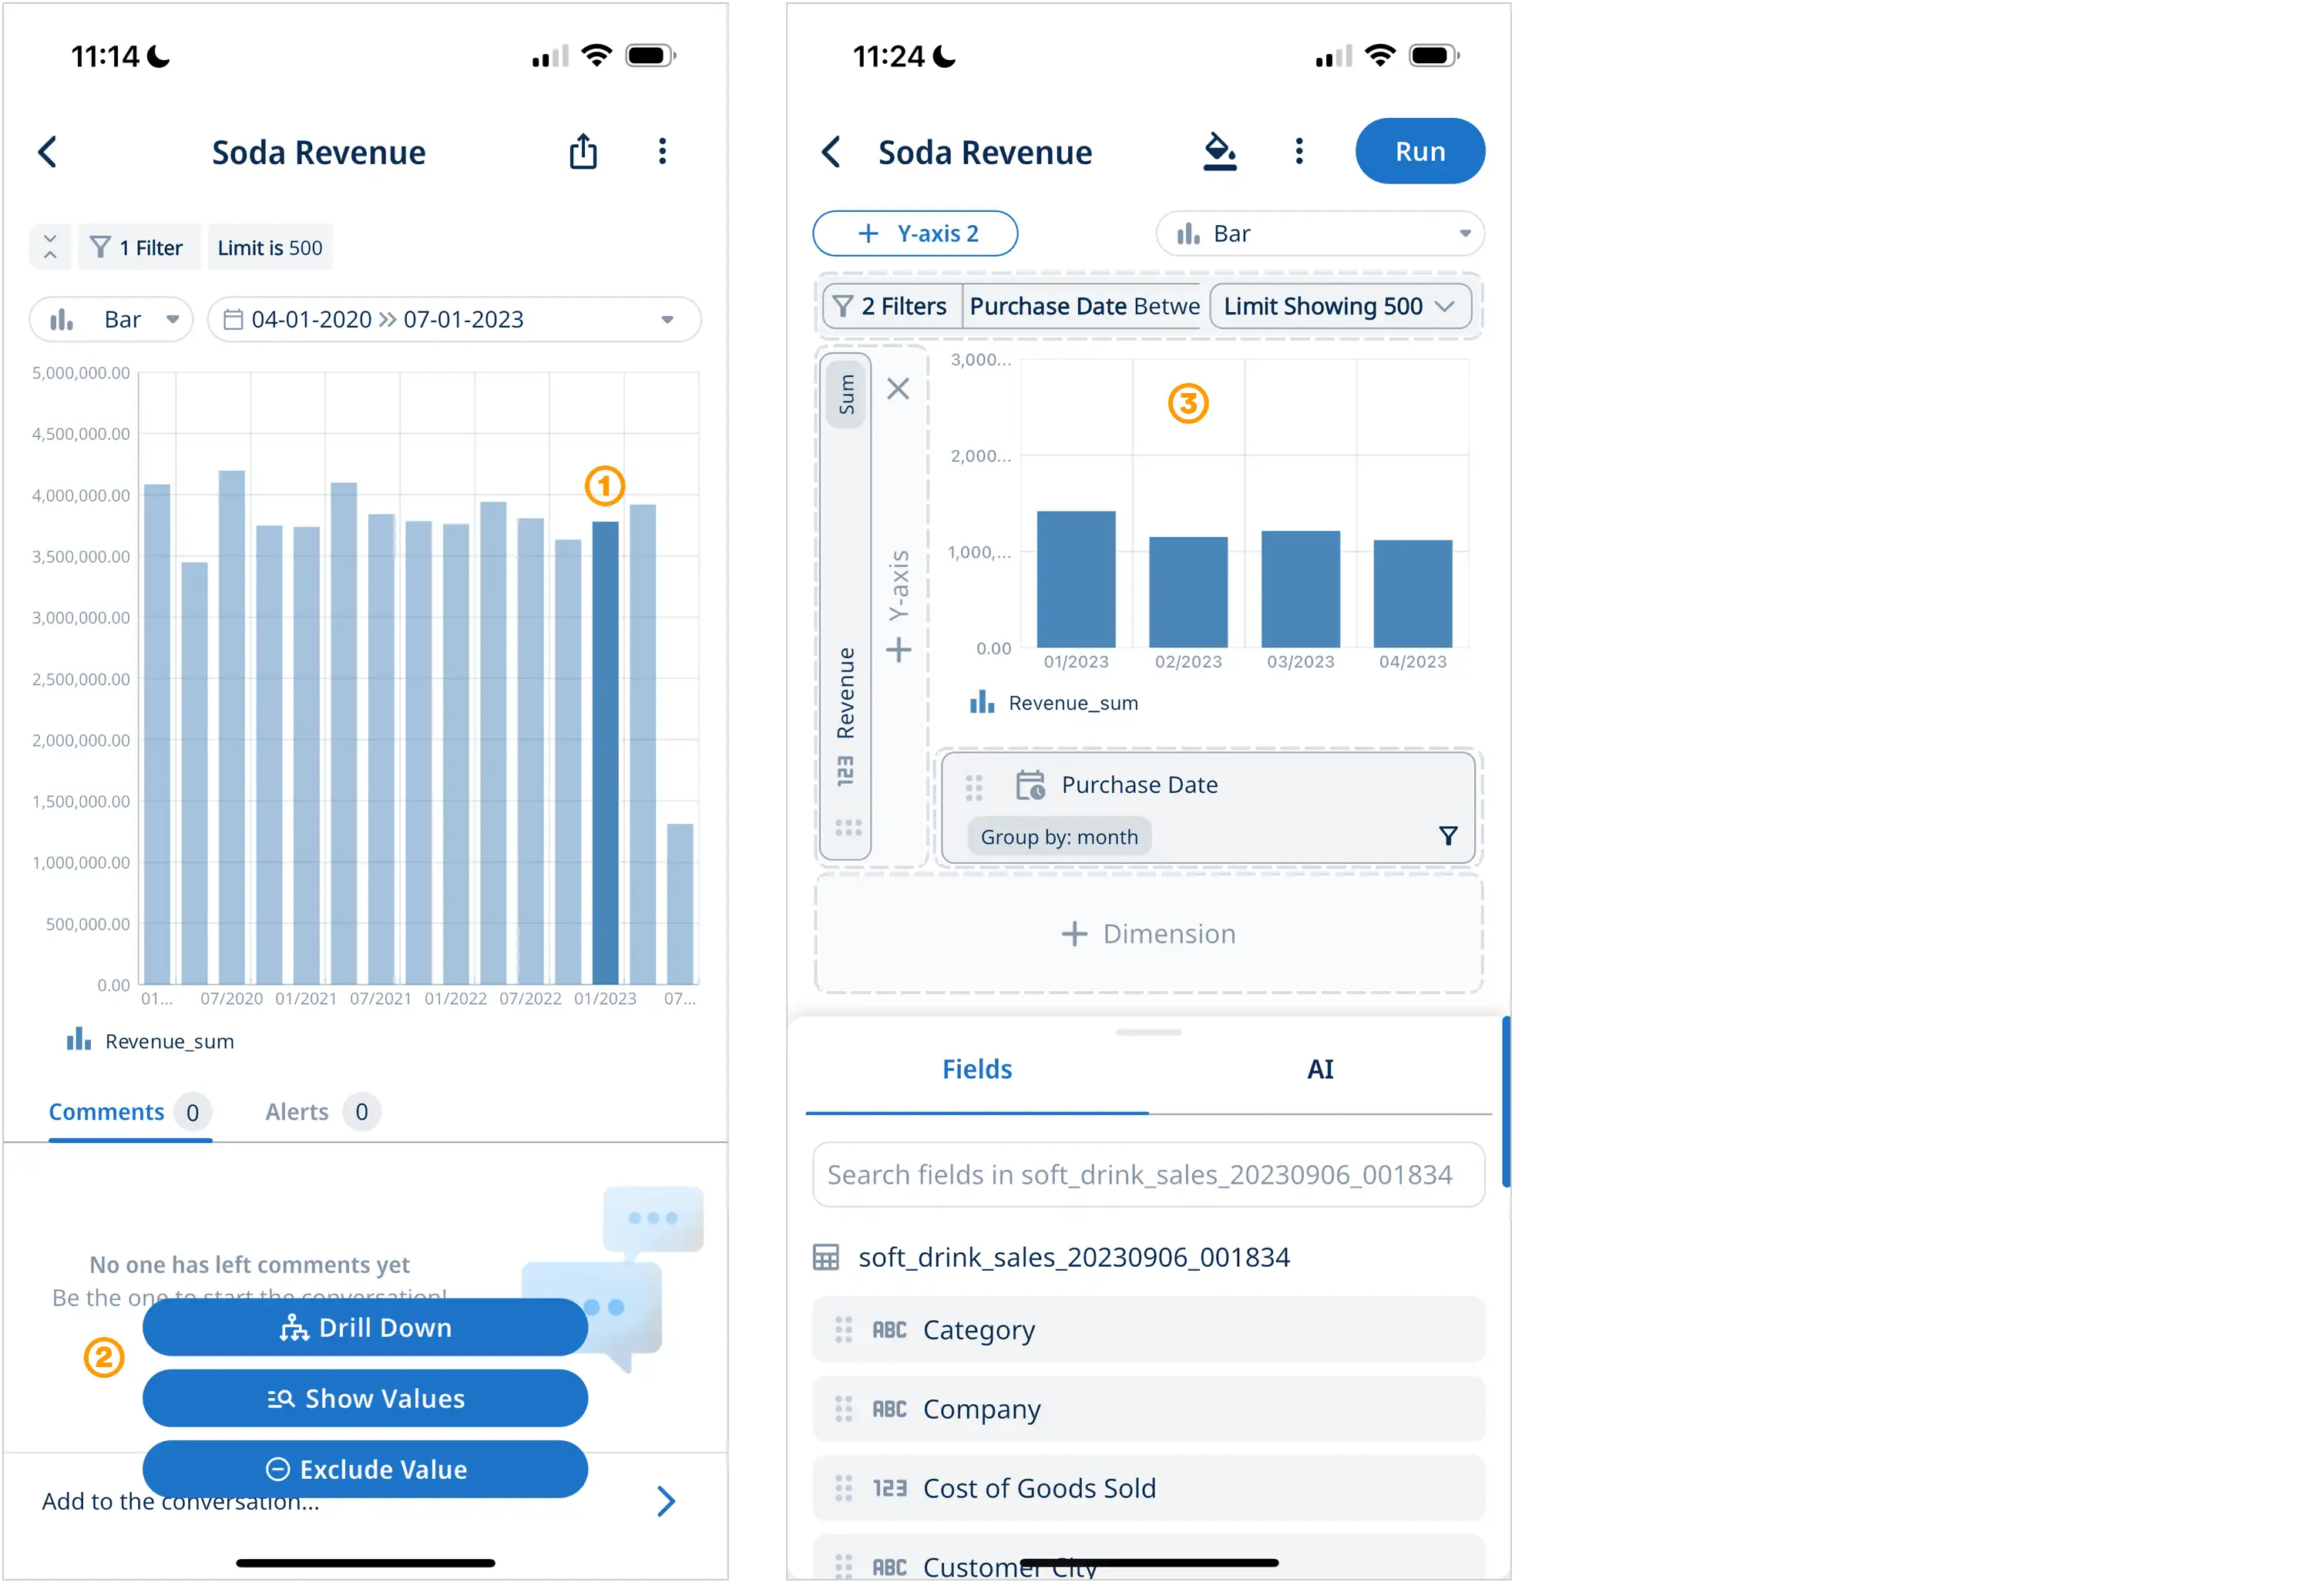
- On mobile tap and long press on a data point on a graph, or on desktop simply click on a data point
- A contextual menu will appear with three options to explore your data furter
- Drill Down to focus on the selected data on the next screen
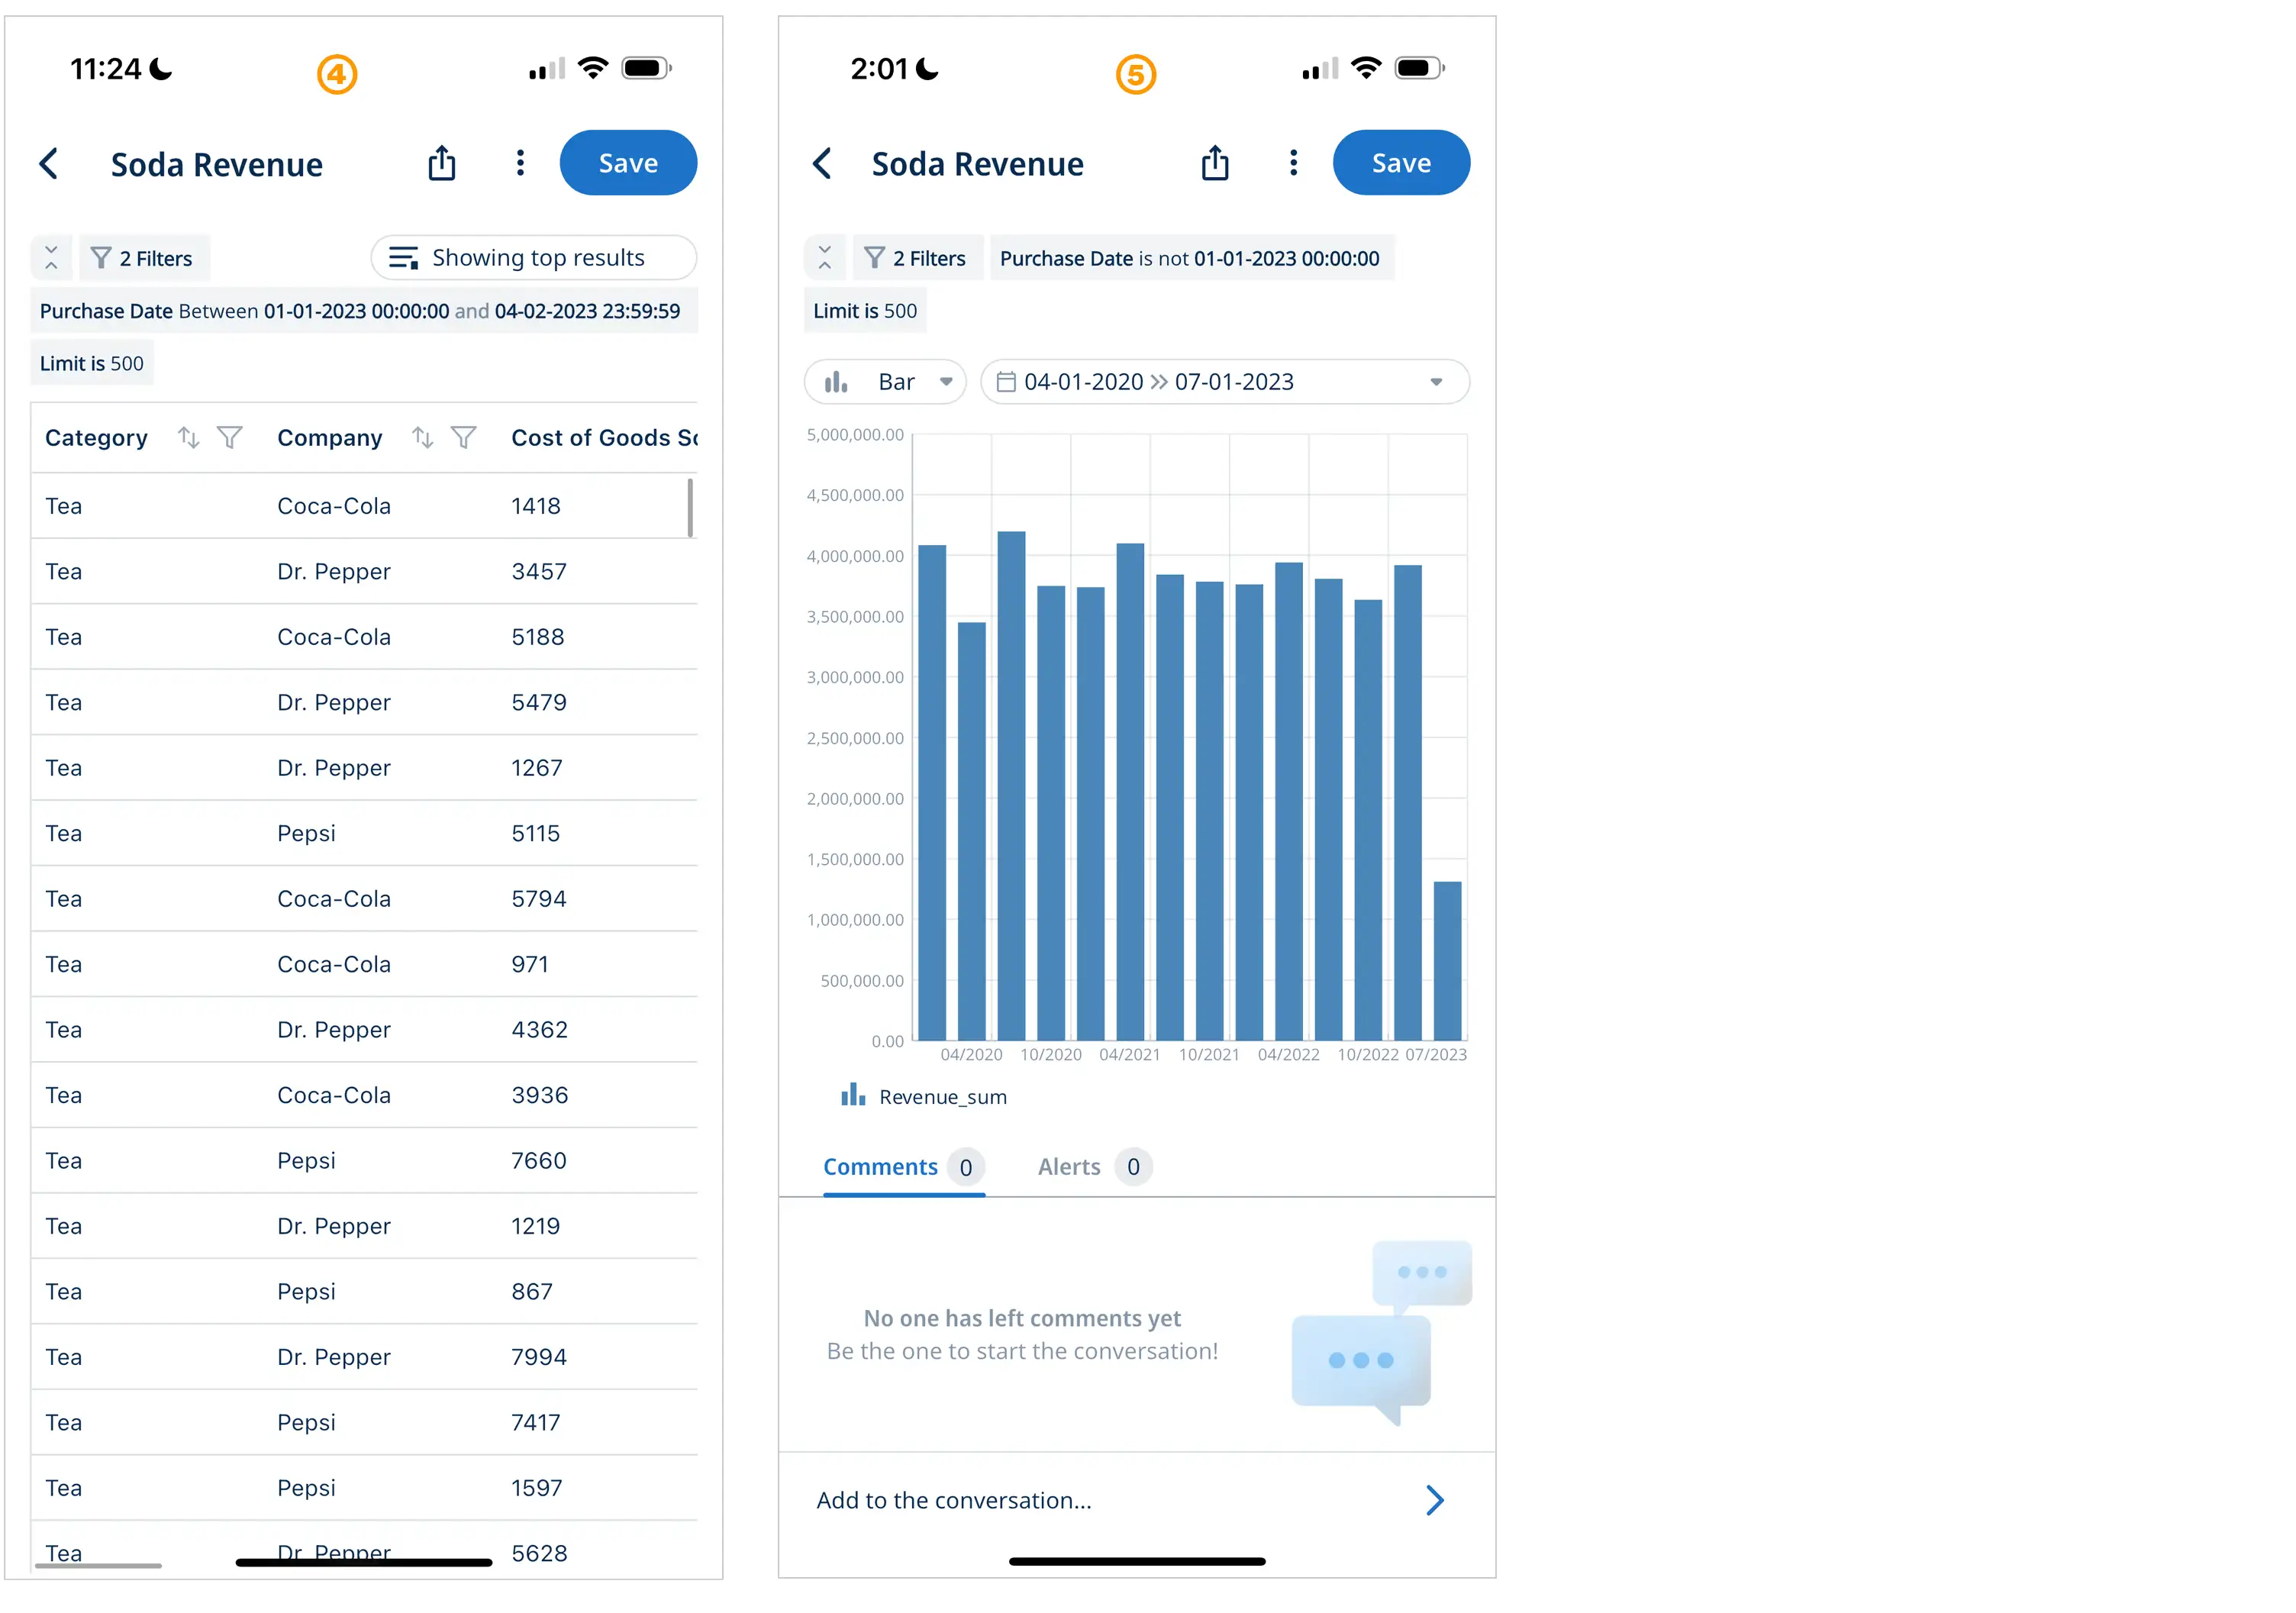
- Show Values will show you table with the selected data
- Exclude Value shows you an updated chart without the selected data point
Mobile: Drill Down Demo Video
Desktop: Drill Down Demo Video
After clicking on the tooltip, you will be brought to the SwiftQuery editor, with axes or columns pre-populated to match those of the original graph or table, along with a filter applied based on the data selected.
For example, if I select a line in a Line Graph that represents the Region of San Francisco, CA, the SwiftQuery editor applies a filter with the condition of Region = San Francisco, CA along with the graph’s original axes.
If I select a cell in a Data Table which has the value of Berkeley, CA for Region, the SwiftQuery editor applies a filter with the condition of Region = Berkeley, CA along with all the columns in the original table.
From here, you can modify your query in the editor before running to dive deep into specific data!
Exclude with a Dimension
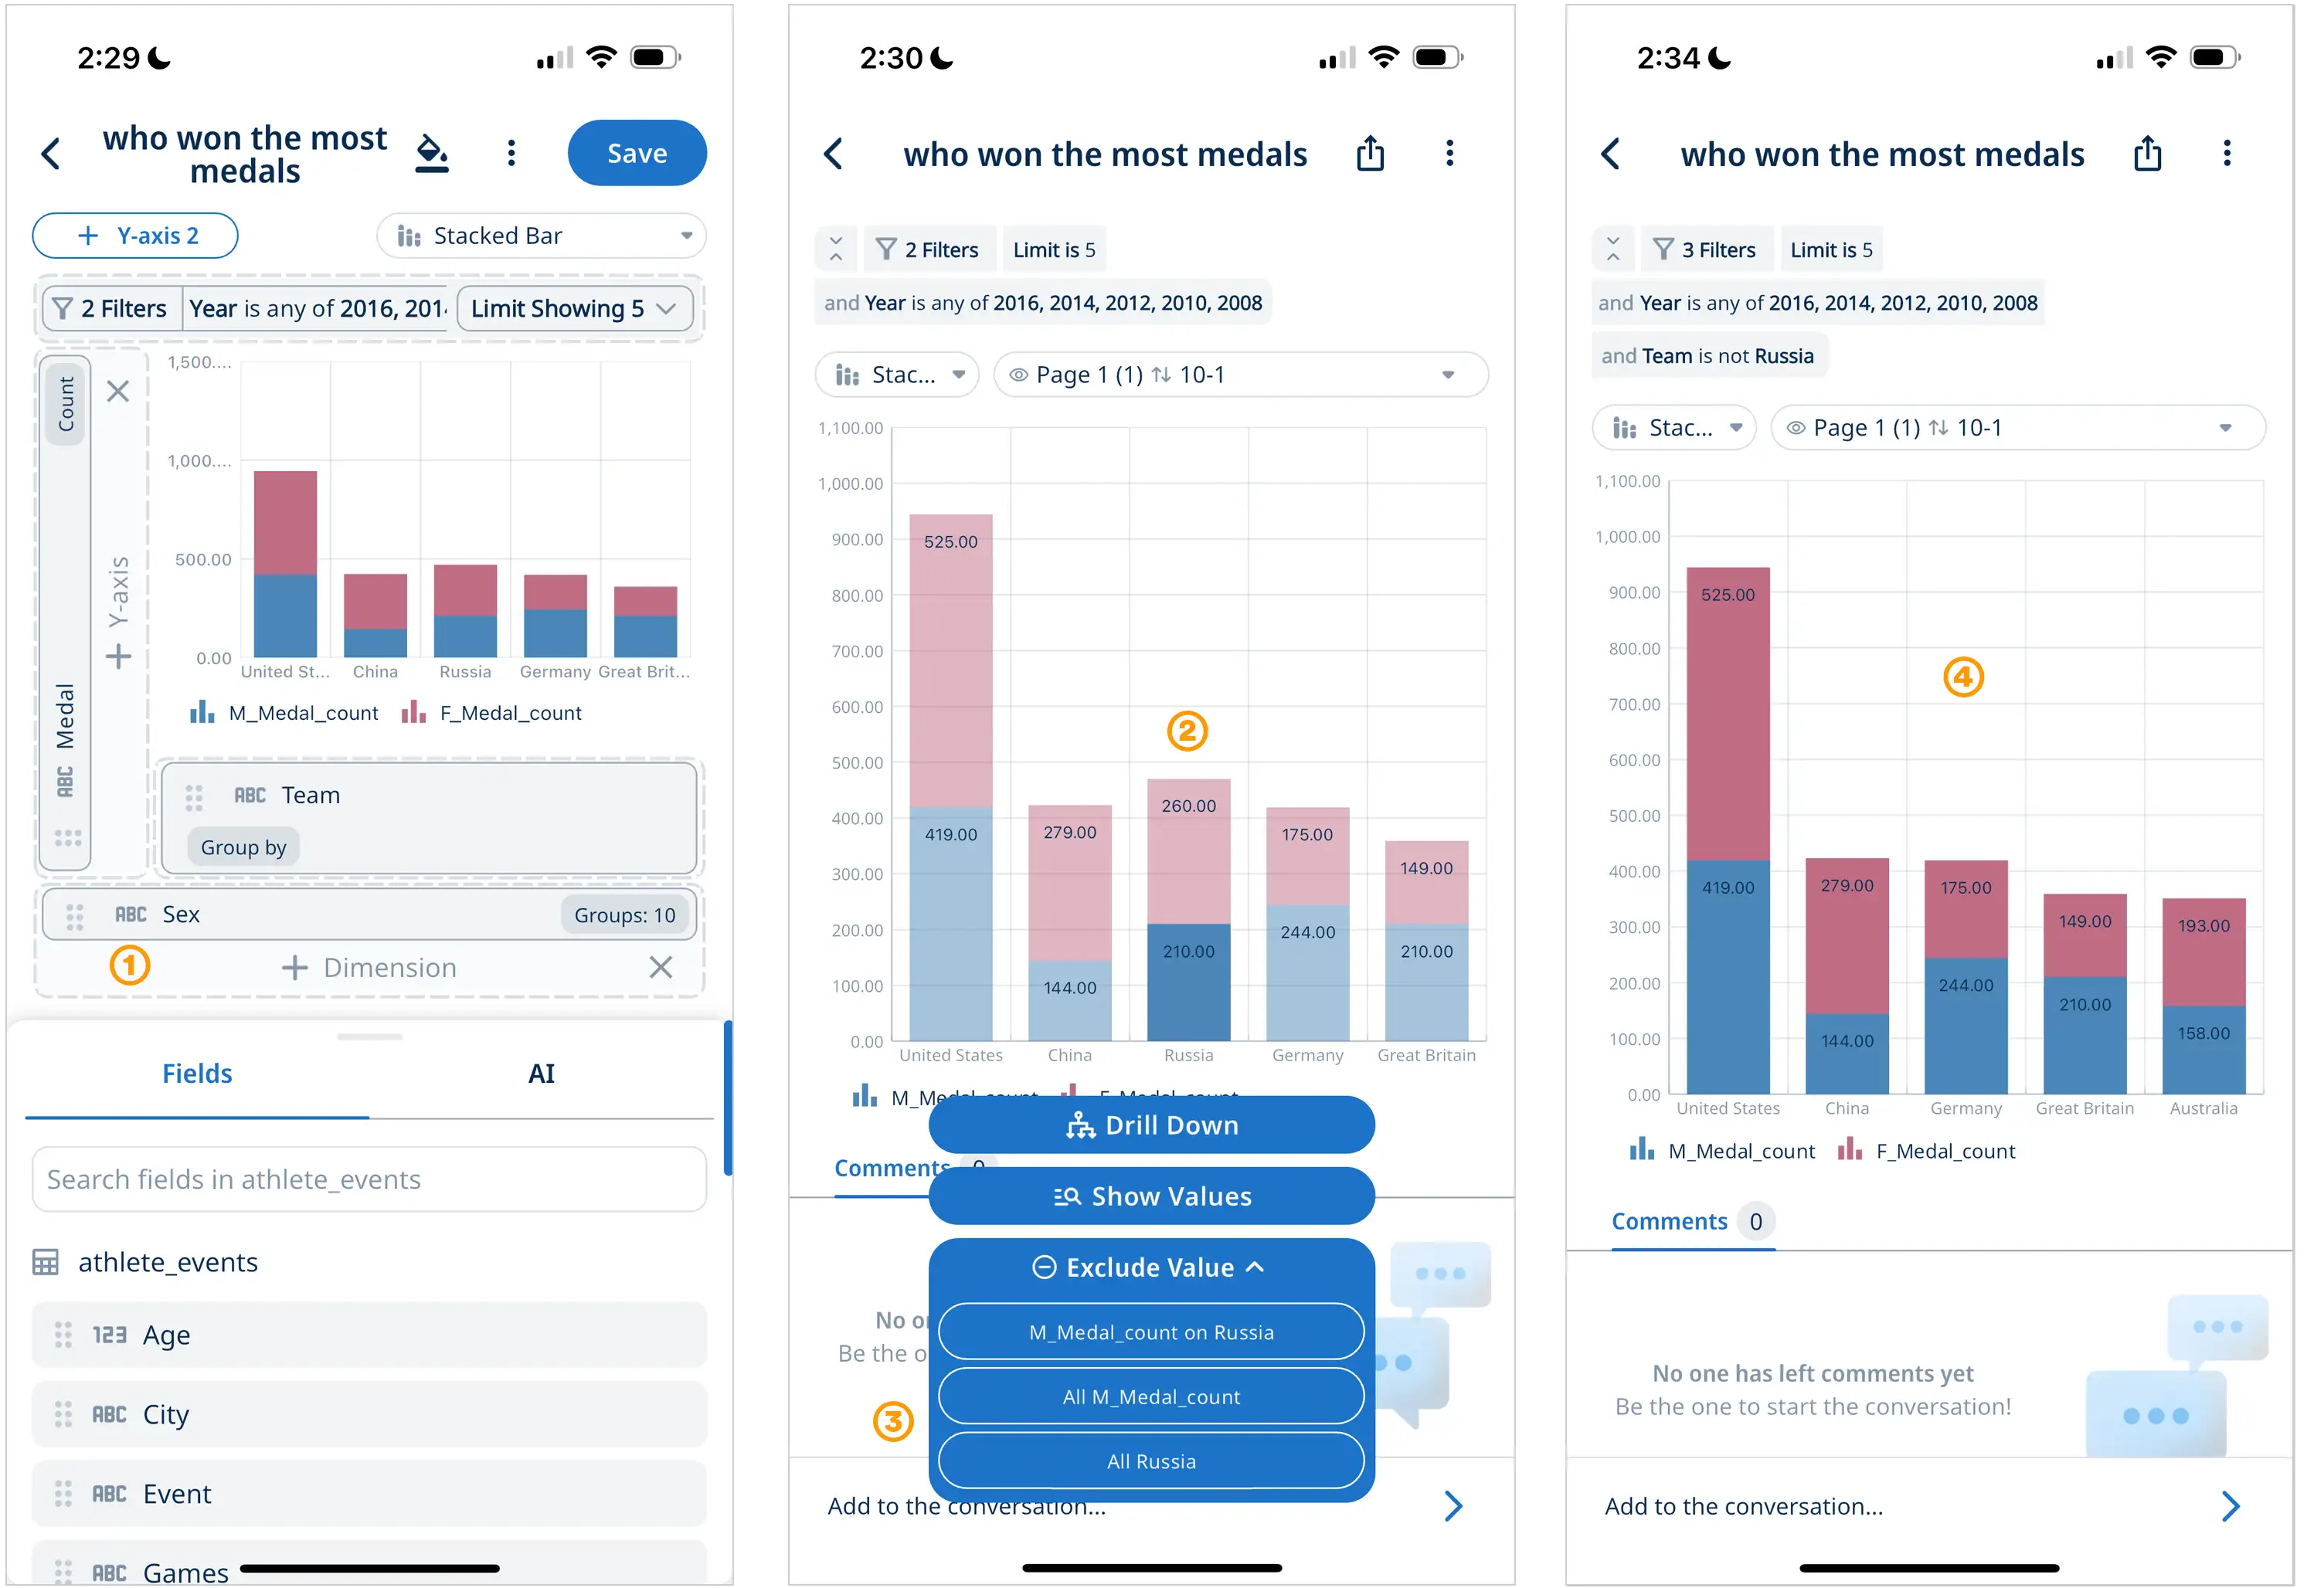
- Add a dimension to a data visualization for additional Exclude capabilities
- Select the data point you want to explore
- Exclude Value in the contextual menu now allows you to exclude data by axis or dimension
- See your updated data visualization with excluded data
Identify Other Data with the Same Values
You can also “zoom out” and identify other data that share the same value for a particular field or column.
To see the “Show Values” tooltip, it is the same mechanism as to see the “Drill Down” tooltip.
After clicking on the tooltip, a Data Table with all columns will be presented, along with rows of data with values matching the data point or cell that was selected.
For example, if I select a point in a time-series graph and run “Show Values”, I will be able to see a Data Table with all values at the specific time of the data point selected.
If I select a cell in a Data Table with the value of 70 for Homes Sold, a Data Table will be returned where I can all data for months where homes sold in a region equals to 70.
Time and Date Formatting
To change the time and date formatting, tap the x-axis or a table cell, and formatting options will appear in the bottom sheet. Tap on the “Date format” dropdown to choose your preferred formatting options. The options you see will match the time granularity of your question.
If you choose the “custom” option, you can construct a custom format with the following symbols:
| Symbol | Meaning | Presentation | Example |
|---|---|---|---|
| y | year | number without truncation or leading zeros | 2012 |
| yy | year | number truncated to the last two digits | 12 |
| yyyy | year | four-digit number, with leading zeros if necessary | 2012 |
| M | month in year | number without a leading zero | 3 |
| MM | month in year | two-digit number, with a leading zero if necessary | 03 |
| MMM | month in year | abbreviated name | Mar |
| MMMM | month in year | full name | March |
| d | day in month | number without a leading zero | 6 |
| dd | day in month | two-digit number, with a leading zero if necessary | 06 |
| EEE | day of week | abbreviated name | Tue |
| EEEE | day of week | full name | Tuesday |
| h | hour in am/pm (1~12) | number without a leading zero | 1 |
| hh | hour in am/pm (1~12) | two-digit number, with a leading zero if necessary | 01 |
| H | hour in day (0~23) | number without a leading zero | 13 |
| HH | hour in day (0~23) | two-digit number, with a leading zero if necessary | 13 |
| m | minute in hour | number without a leading zero | 7 |
| mm | minute in hour | two-digit number, with a leading zero if necessary | 07 |
| ss | second in minute | number without a leading zero | 55 |
| ss | second in minute | two-digit number, with a leading zero if necessary | 55 |
| a | am/pm marker | PM | |
| ' | escape for text | ‘Date=’ | |
| '’ | single quote | ‘o’‘clock’ |
You can use characters like ‘/’, ‘:’, ‘-’, ‘.’ directly, without enclosing them in single quotes.
Exporting Graphs and Data Tables
Save graphs [1] to your phone’s photo gallery by tapping the three dots in the top right of the app and click ‘save to photo gallery’. You may need to grant Zing permissions to save files to your phone. These images will be saved as PNGs and can be accessed by other apps on your phone to make it easy to send charts and analysis in email, Slack, and to embed in documents from your mobile device. Easily drop these graphs into Slack, Microsoft Teams, Google Slides, Microsoft Powerpoint, Microsoft Word, or Google Docs.
Save tables [2] to your phone by tapping the three dots in the top right of the app and click ‘save table as CSV’. You may need to grant Zing permissions to save files to your phone. This will provide a comma seperated values file which can be used in other apps on your phone such as email, Google Sheets, Microsoft Excel, and more.
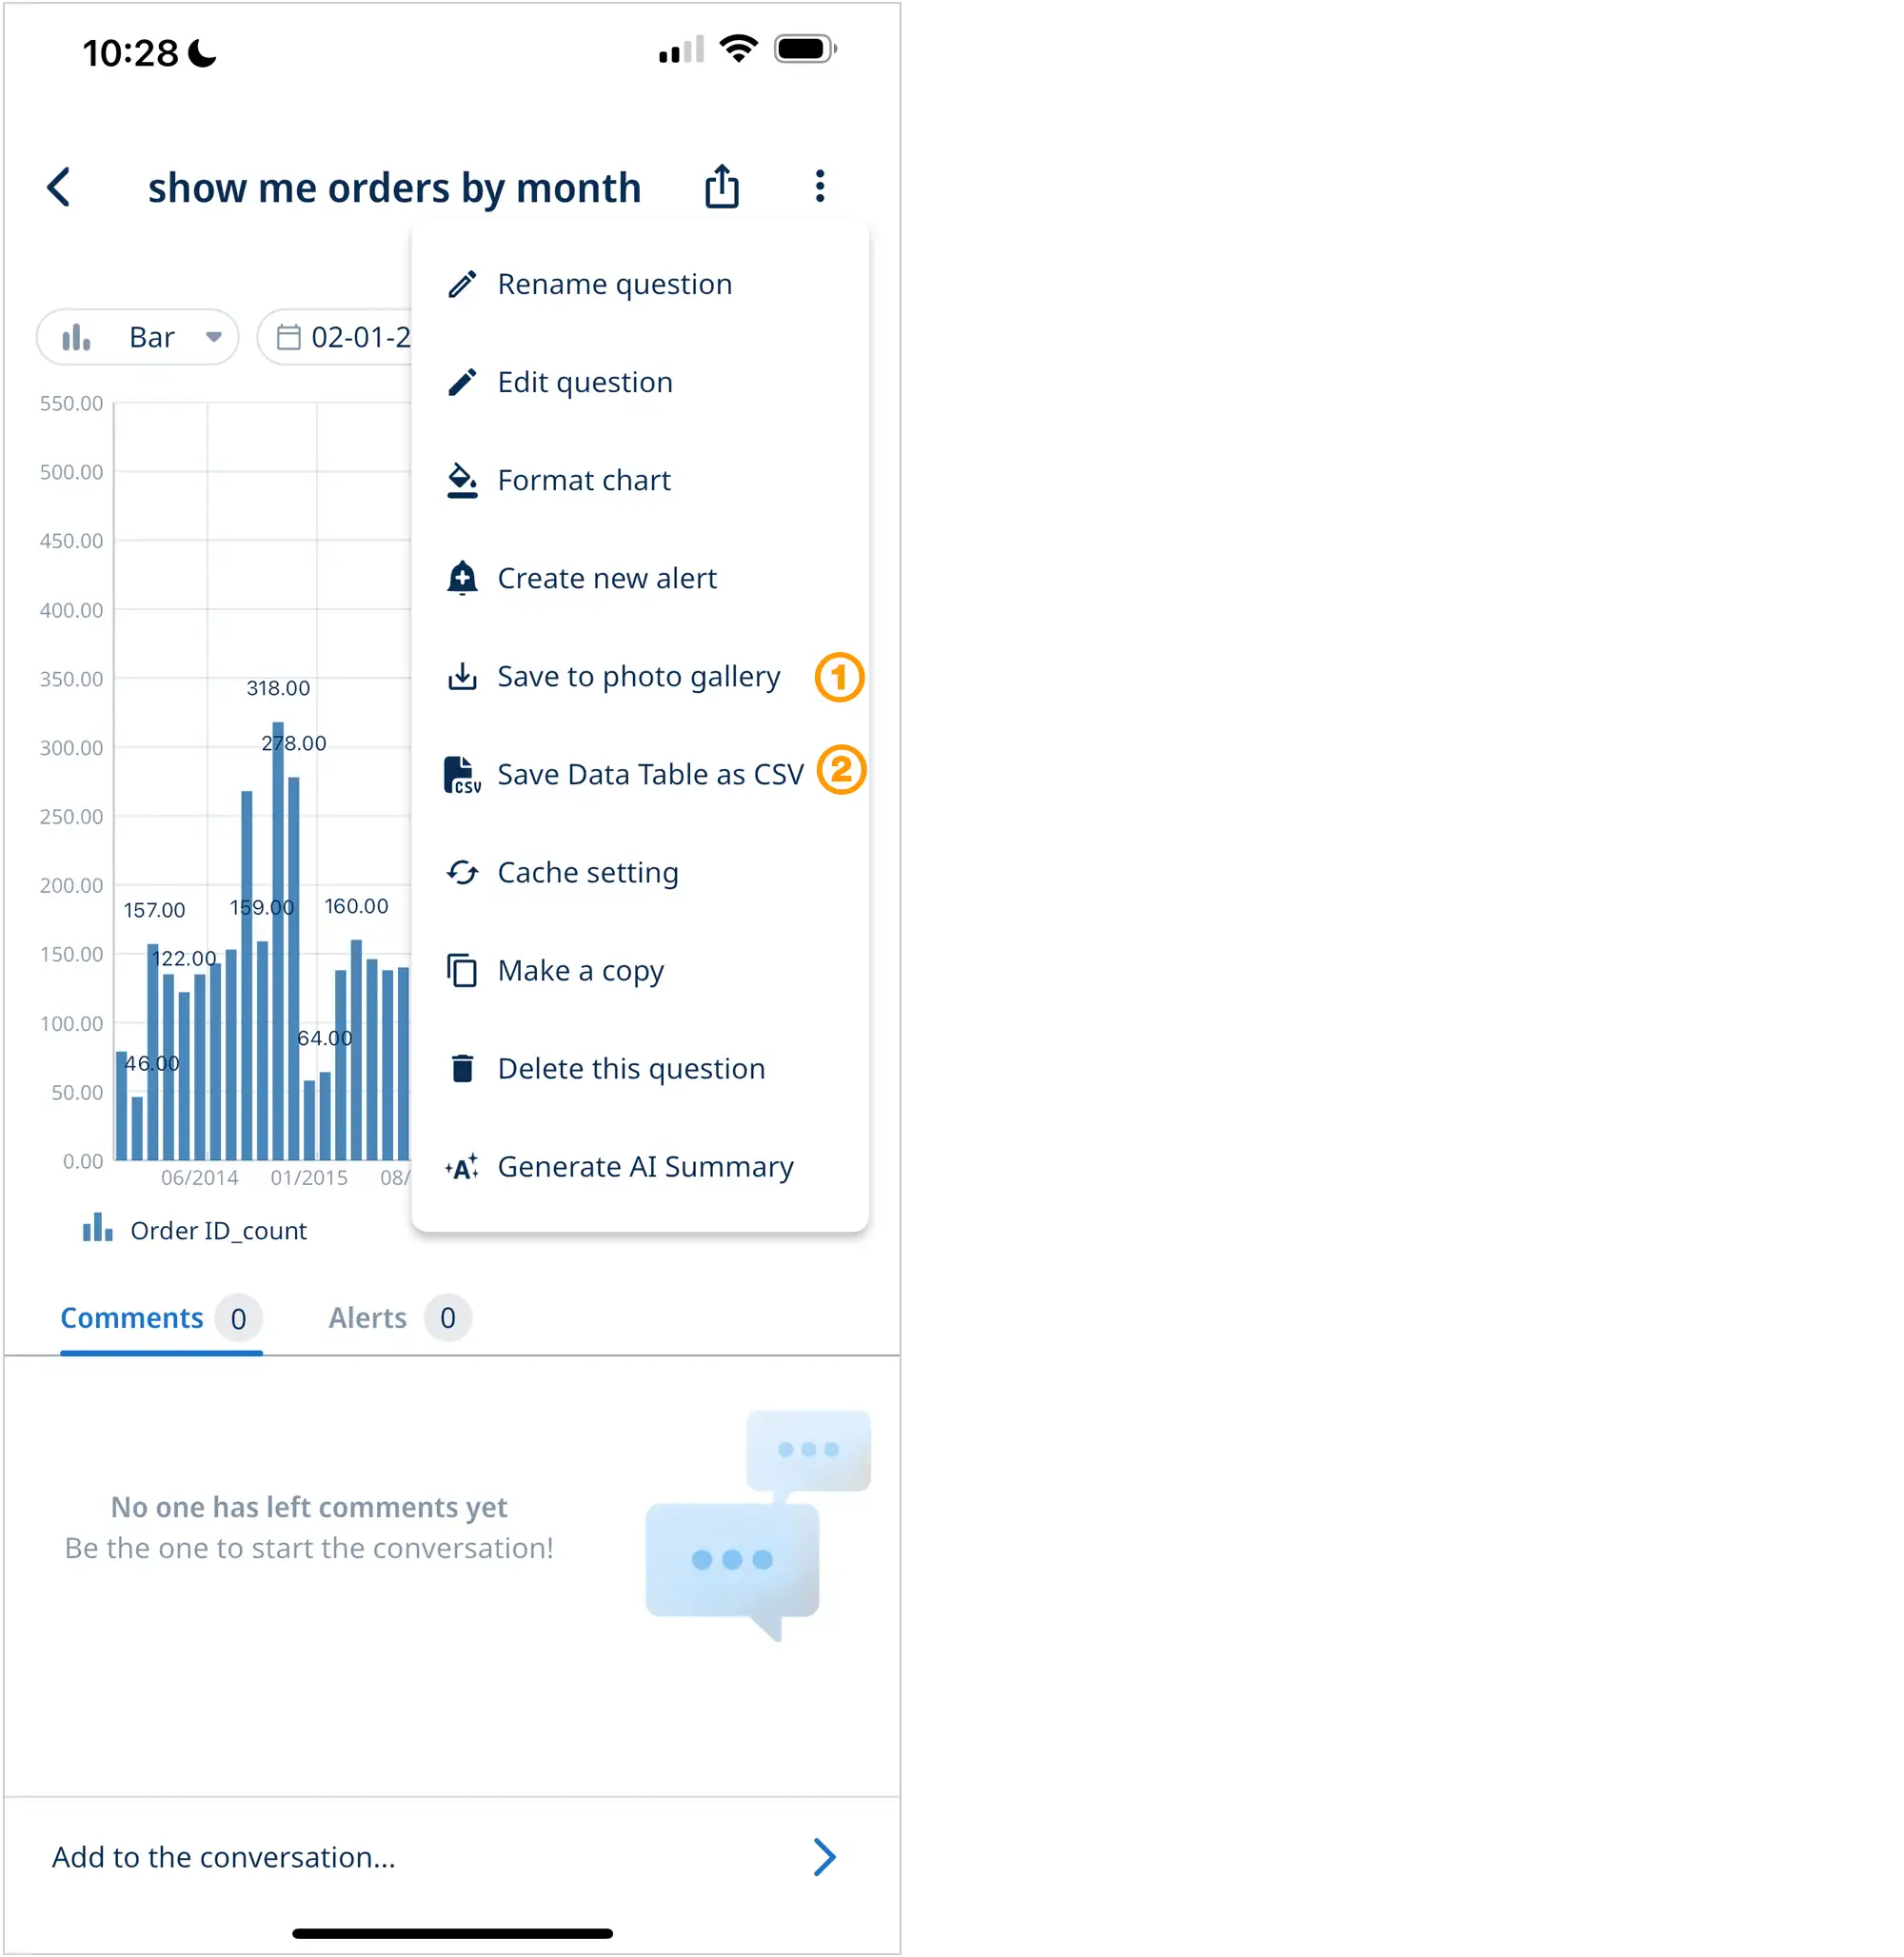
Large Exports
By default, Zing shows you top results by limiting how many data points are shown in a graph or table preview – but gives you the full control to get all data as a CSV (even up to multiple gigabytes). We’ve tested it up to tens of millions of rows and 3 GB + files.
Get started with large exports:
- Create a question
- Save the question (large exports require the question to be saved first)
- Tap the three dots in the upper right, the ‘Export to CSV’
- The file will automatically download once the full query runs and the result is complete
Zing’s large export capability (more detail here) works with Clickhouse, Postgres, BigQuery, and other data sources. If you’d like it for other data sources, let us know.
Big Number Chart
Select the data you want to work with from ‘Data Source’ and start building:
-
Once you are in the chart builder select “Big Number” from the chart menu
-
Drag a field into the chart builder
-
Now you can see a big number, click formatting to fine tune the presentation
-
In the format sheet you can quickly add a your own custom target value, overwrite the field name, change font color and more!
-
Technically you are done, you have created a big number data viz!
But there is more: -
Add a filter to segment your data
-
Configure the filter with easy to use conditions
-
Run and save your visualization!
Calculate multiple percentiles on the Y-Axis
This feature allows users to gain deeper insights into their data distribution by displaying various percentile values along the vertical axis of a chart. This functionality is particularly useful in statistical analysis, where understanding the spread and distribution of data points is crucial. By plotting multiple percentiles, such as the 25th, 50th, and 75th, users can quickly identify trends, outliers, and the central tendency within their datasets. This feature enhances the ability to conduct comprehensive data analysis, providing a clearer picture of the data’s behavior and characteristics, and enabling more informed decision-making based on a detailed percentile analysis.
Define sort order for data series
To enhance the user experience and ensure viewers can quickly understand the visualization, our platform now lets you define the order series are displaed on a chart. Easily rearrange the segments within a bar charts using drag and drop functionality in the format panel. This added control allows for customized presentation of data, ensuring that the most relevant information is highlighted according to your preference.For instance, if you had data split by city, and always wanted to ensure that New York is shown at the bottom of a stacked bar chart, you could simply drag New York to reorder the series order and get the visualization perfect.
Intuitively sort table columns the fast way
Sorting columns server side significantly improves performance and speed, when dealing with large datasets. Instead of downloading and sorting the entire dataset on the user’s device, which can be resource-intensive and slow, or only locally sorting the partial data on the client, the server now handles the sorting logic and sends only the correctly sorted data to the client. This method ensures faster response times and a smoother user experience, as it minimizes the amount of data transmitted and reduces the processing load on the user’s device.
Pivot table grouped aggregations
Group Aggregations brings pivot table capabilities so you get subtotals, grand totals, and group averages within data tables.
- Create a ‘data table’ question
- Select group bys for the groups you want, and calculations (sum, count, etc.) for the fields you want numerical calculations on
- Click the paint bucket icon on the field header for fields you’d like group aggregations to be shown on. Select SUM or AVERAGE to show subtotals or averages for each group
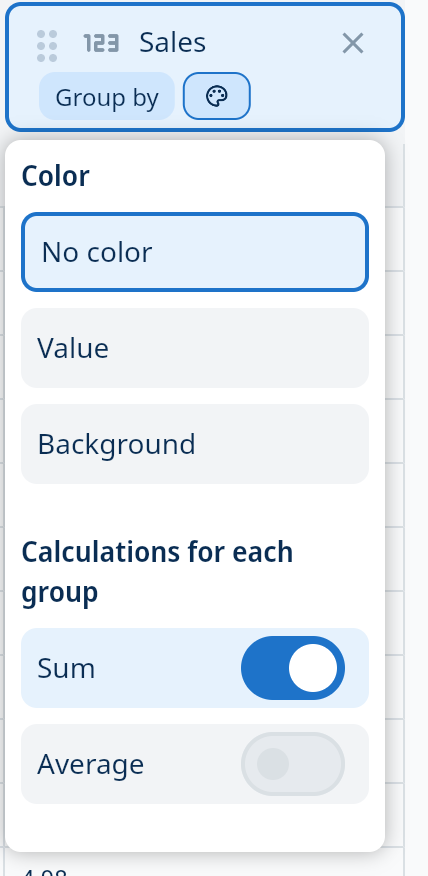
- Grand totals will also be shown at the bottom of all groups
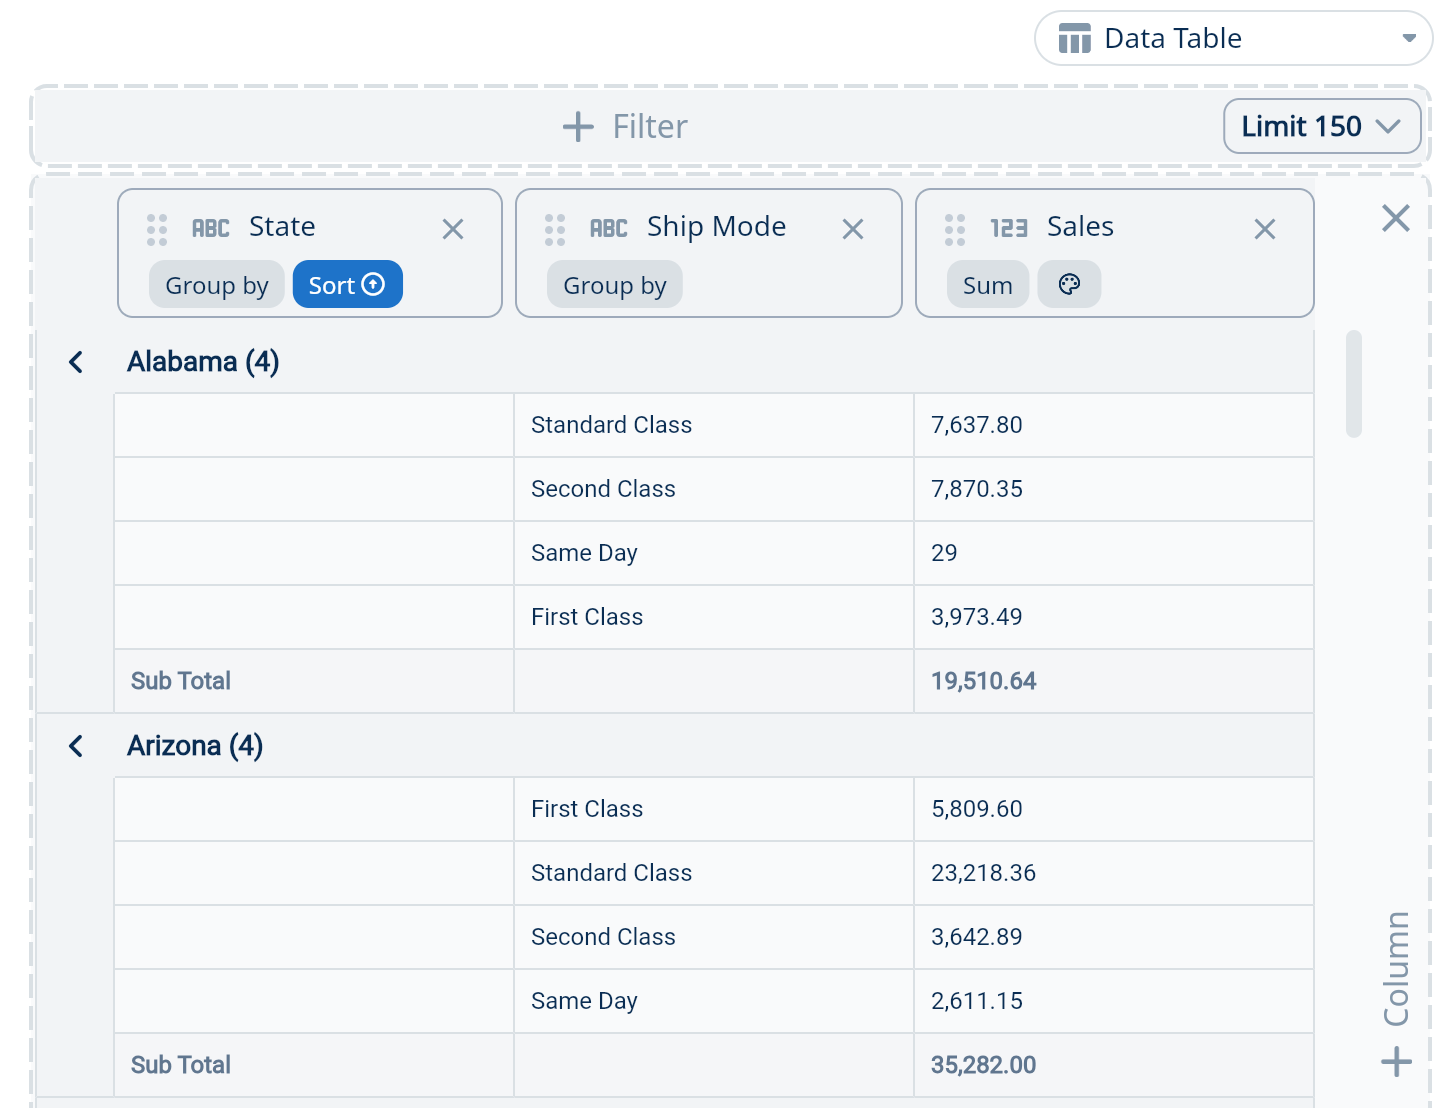
Stacked Bar 100%
A 100% stacked bar chart is a type of bar chart that shows the proportion of different categories within each bar, with each bar representing 100% of the total. This chart is useful for comparing the relative contributions of categories across different groups. To get started select “Stacked Bar 100%” from the data visualization menu, then drag fields to the X and Y axis and one more field to dimension.
Map: Control data clusters and zoom level
To effectively manage data clusters on a map, users can adjust zoom levels to control the display of data points. At the lowest zoom level ‘1’, all data points are visible, ensuring that no information is missed. As users increase the zoom to higher levels, up to ‘9’, data points begin to cluster, allowing for a more focused view of the map. This flexibility enables users to visualize broad trends at lower zoom levels or dive into specific areas of interest by clustering data at higher settings. To access this feature, click on the “Format” button while your visualization is in edit mode (see video).
Format: Y-Axis Range
Setting a range on a chart allows users to define the minimum and maximum values displayed on the y-axis, providing better control over the data’s visualization. You can define y-axis minimum and maximum values displayed on the a chart, or opt for Zing to automatically determine them based on the values in your data. By default Zing will automatically calculate them, and will start the y-axis at zero (unless there are negative values in the data, in which case it will include the minimum value present in the graph results).
- Select ‘Format’ tab [1]
- Go to ‘Range’ [2]
- Switch between ‘Automatic’ (default) and ‘Manual’ as needed
- If ‘Automatic’ is selected, you can choose to deselect ‘Include zero’ on your chart [3]. If zero is excluded, the chart will display values based solely on the available data from your data source.
- If ‘Manual’ is selected, enter the desired start and end value [4] for your chart
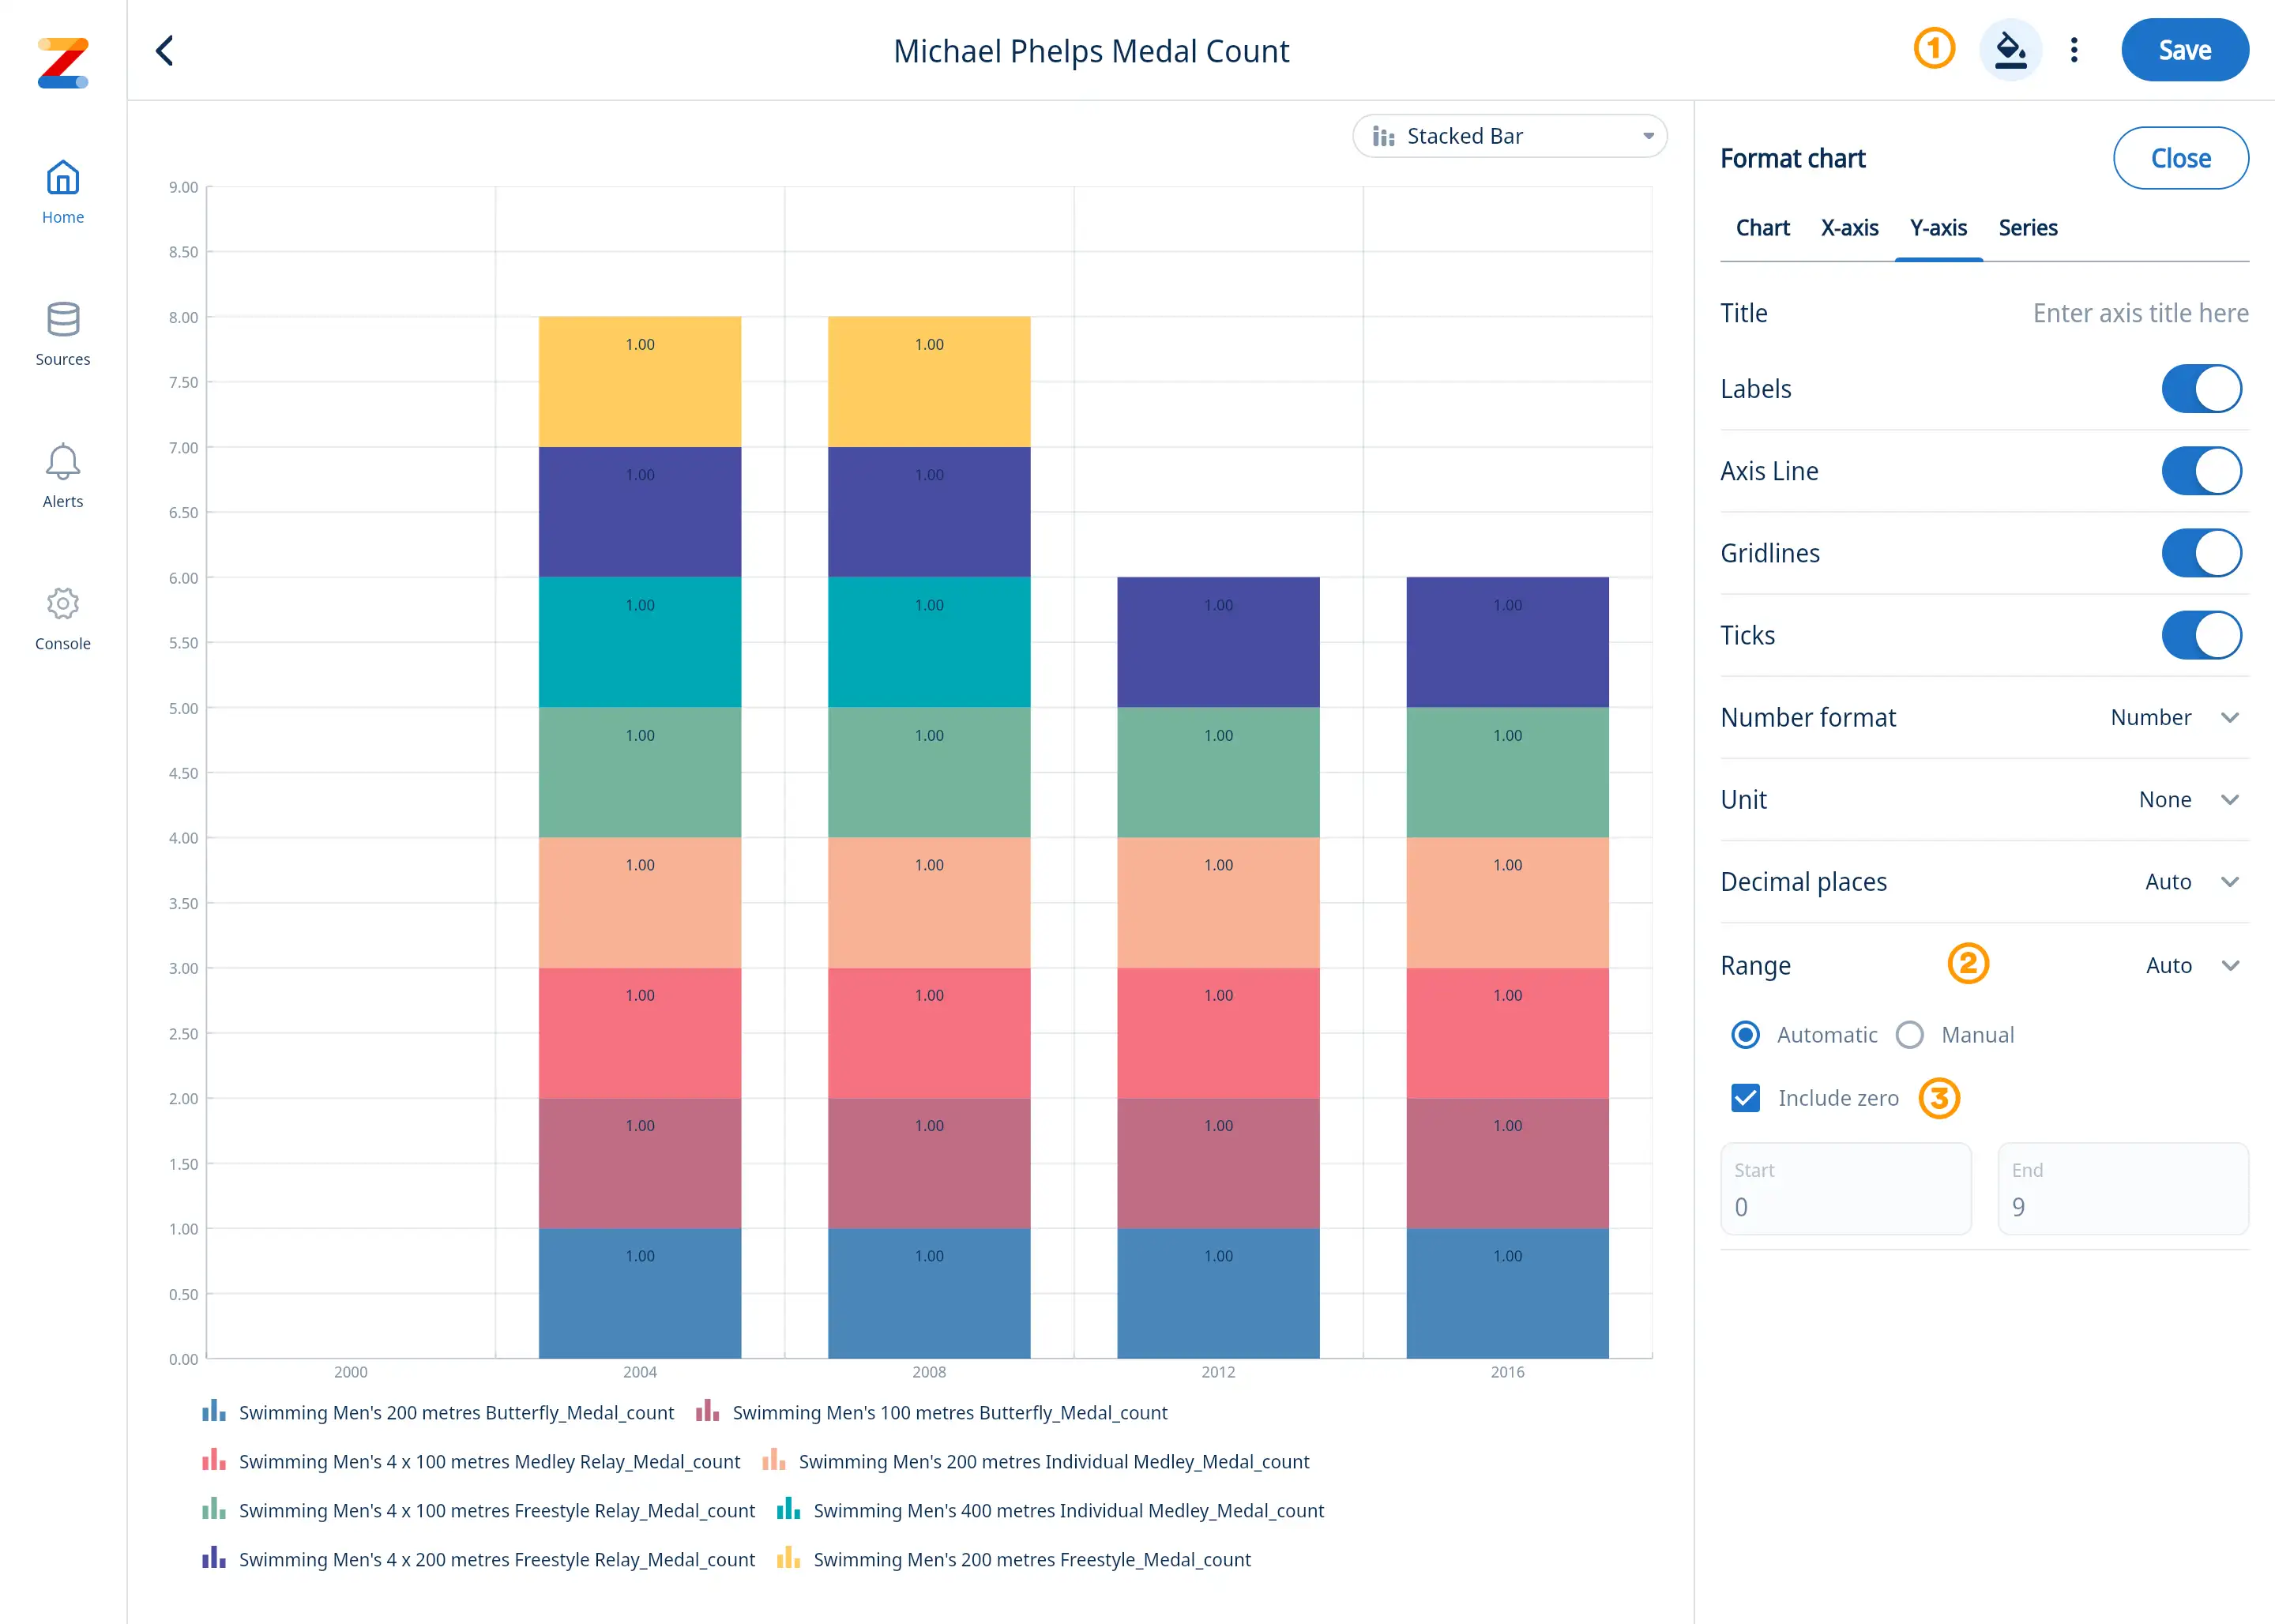
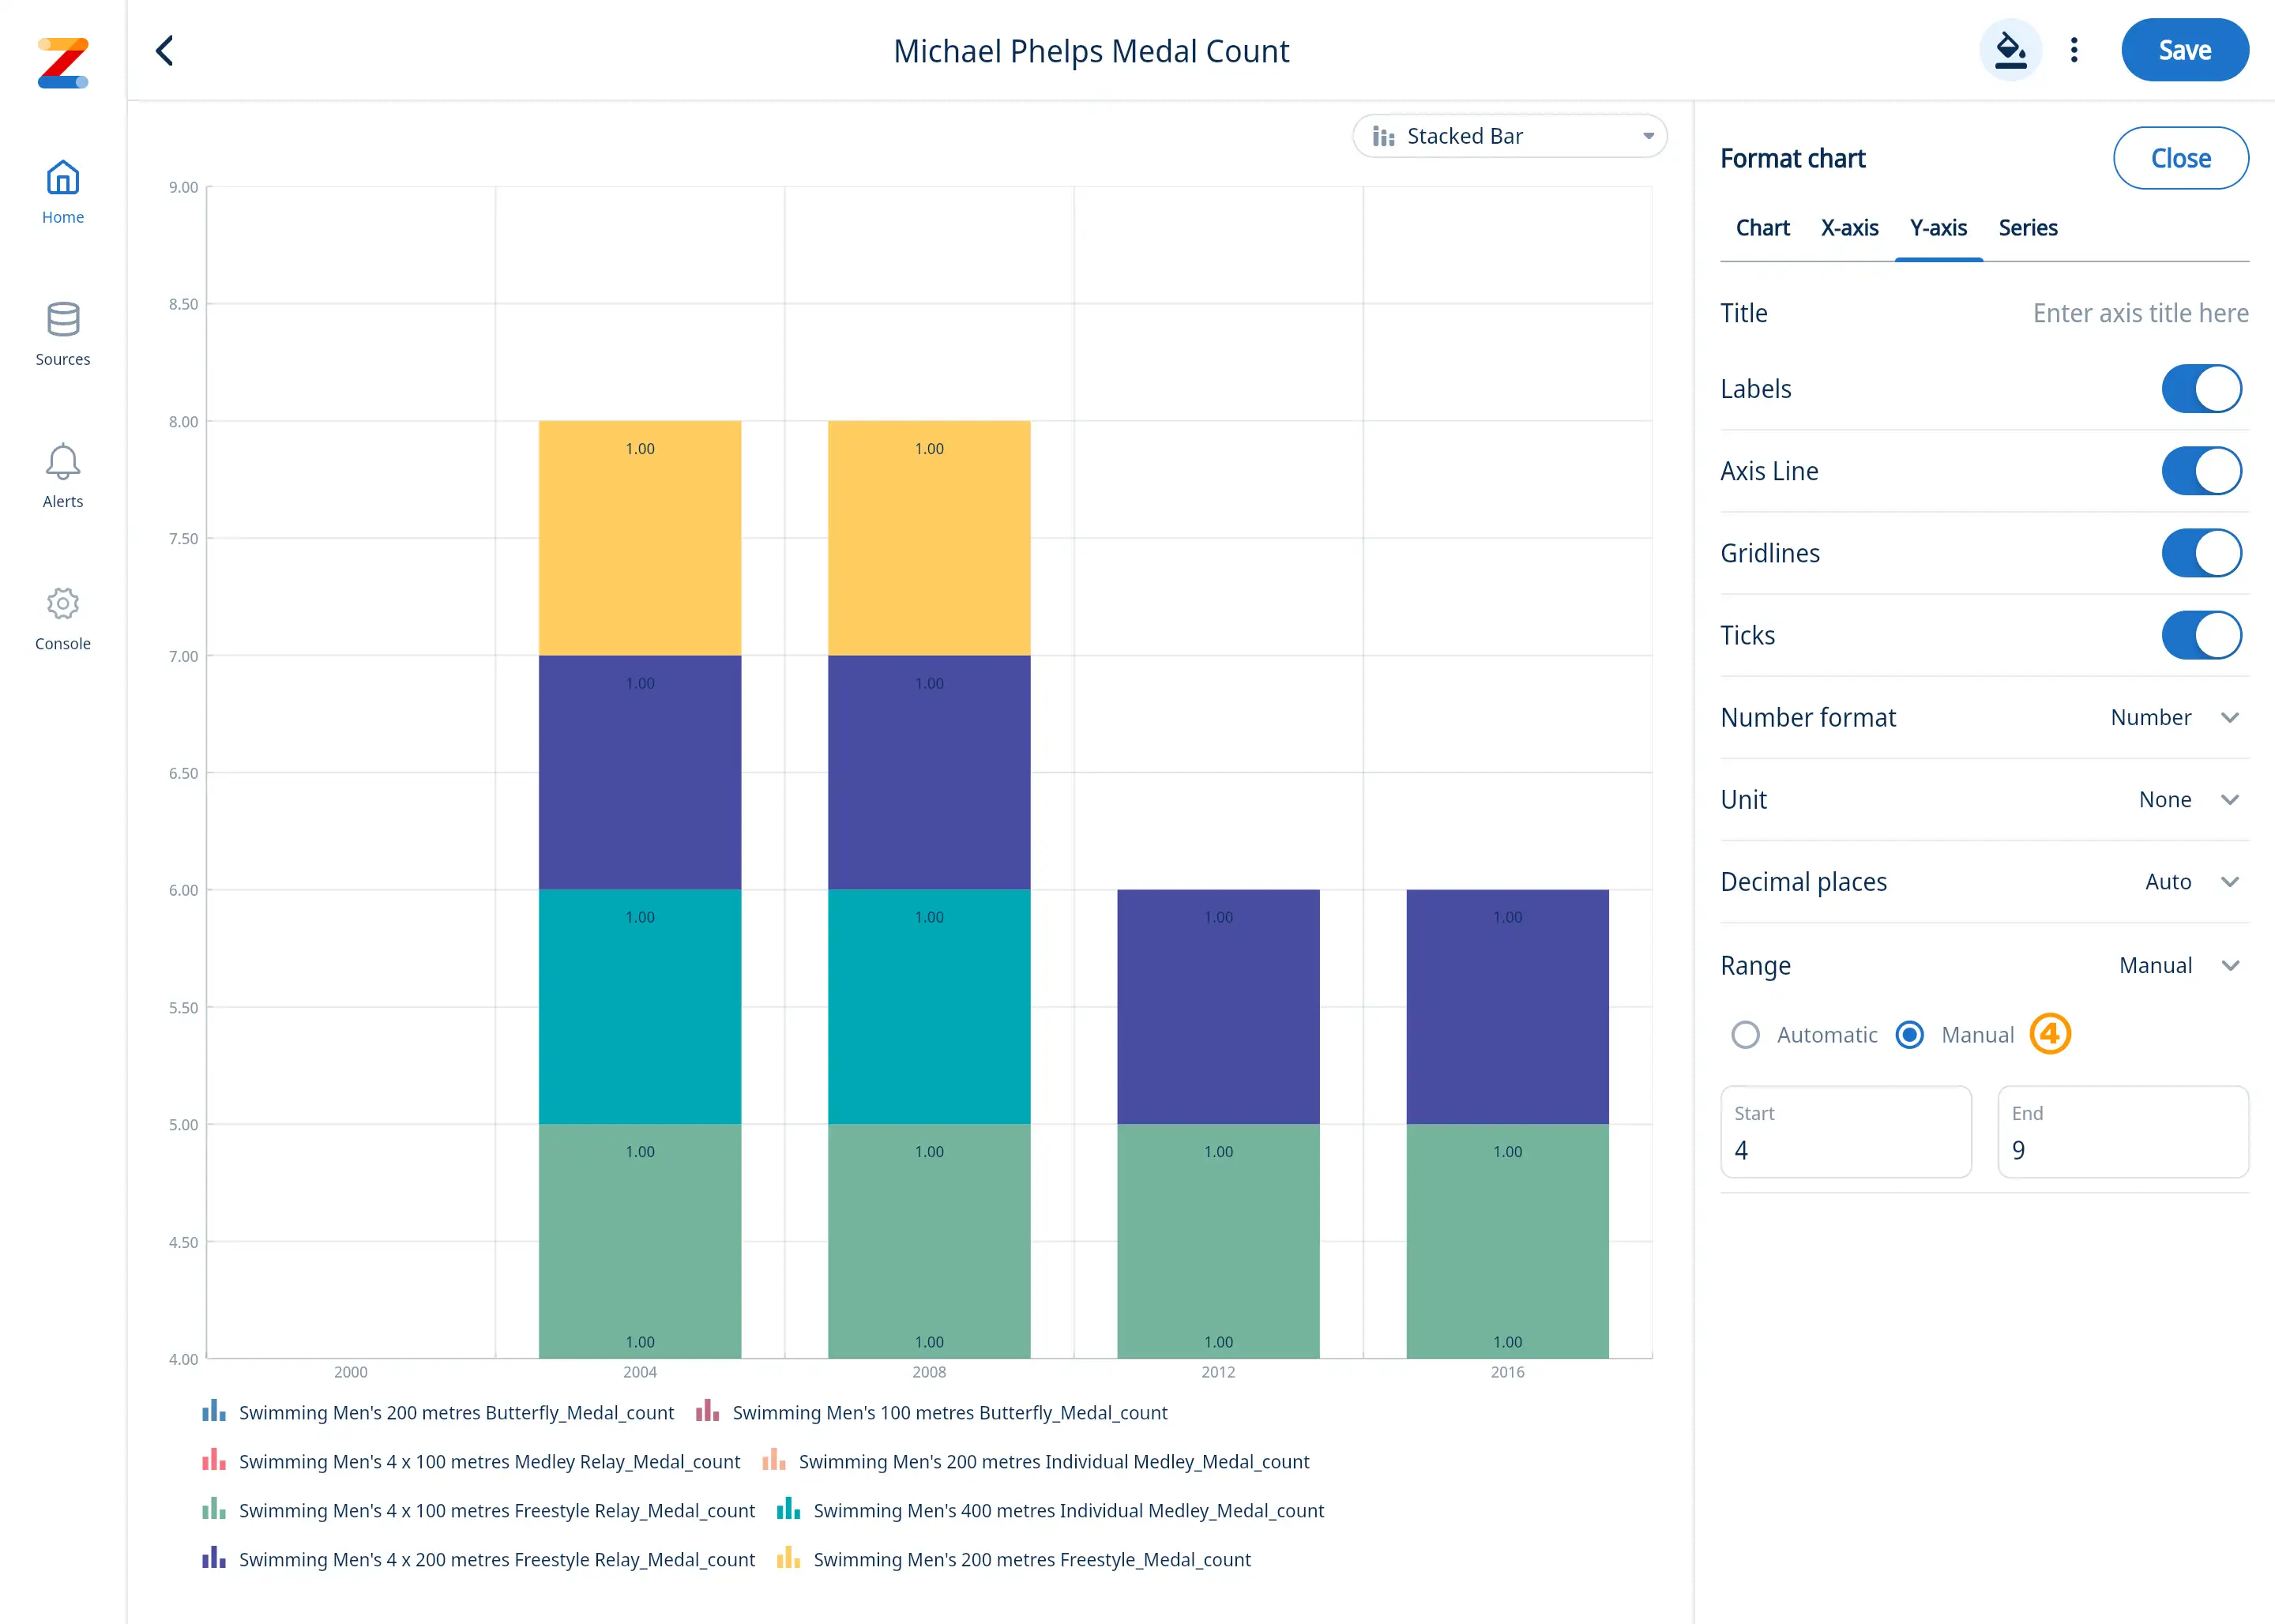
Format: X-Axis Label Intervals
Adjusting label intervals improves readability by preventing clutter and ensuring axis labels are legible. By increasing the interval, you reduce label overlap, making the chart easier to interpret. Conversely, decreasing the interval provides more detail but can make labels harder to read.
- When in edit mode, click the three dots then the ‘Format Chart’ option [1], then ‘X-Axis’
- Go to ‘Label Intervals’ and activate toggle [2]
- Adjust slider (1 = Show all labels, 10 = Show every 10th label)
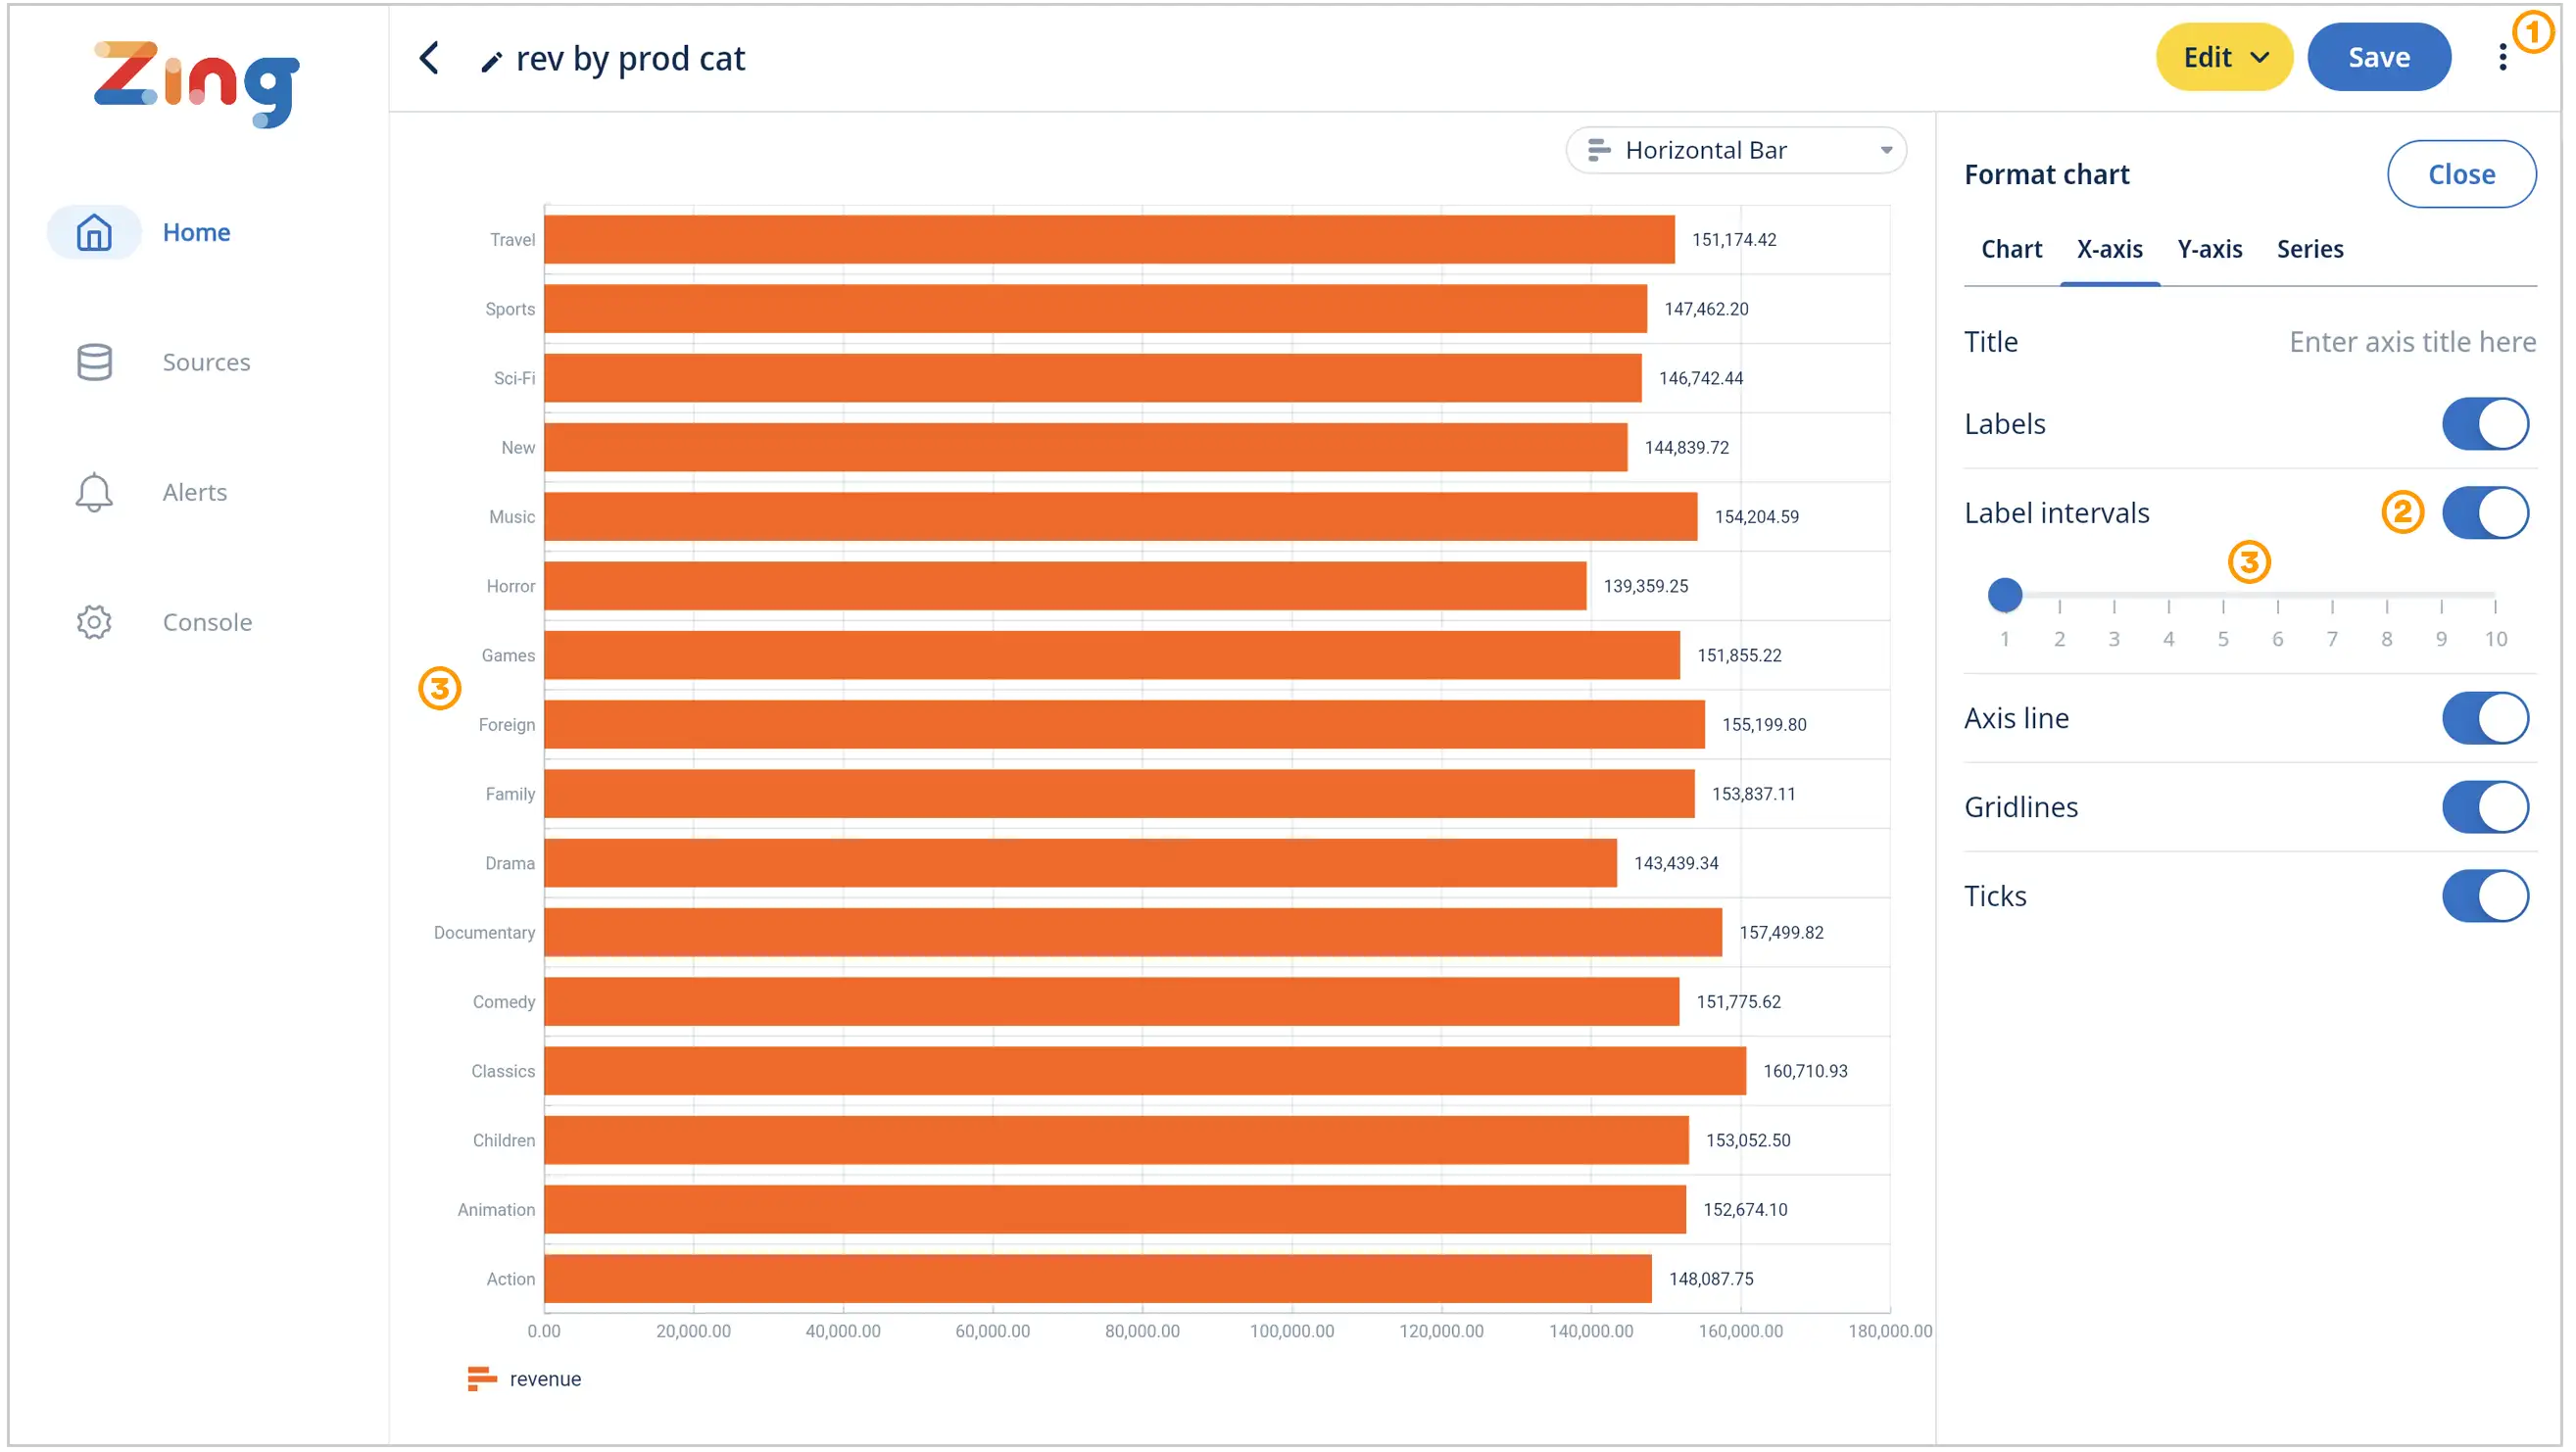
Heatmaps & Conditional Formatting
Zing supports heatmap formatting on data tables – letting you see at a glance outlier values, and the the distribution of values. A heatmap represents data values in a table format, using varying colors to signify differences in intensity, frequency, or magnitude.
Get started
- Select a data source
- Select and drag data fields into a data table
- Click on the paint icon on a numeric column and select to highlight background cells or values
- To customize the colors of your heatmap go to format and switch to manual
- Select your custom colors to build your heatmap. You can have coloring applied to the values or to the background, and Zing will automatically ensure that the text color is legible against light or dark dark background colors
- Save your heatmap
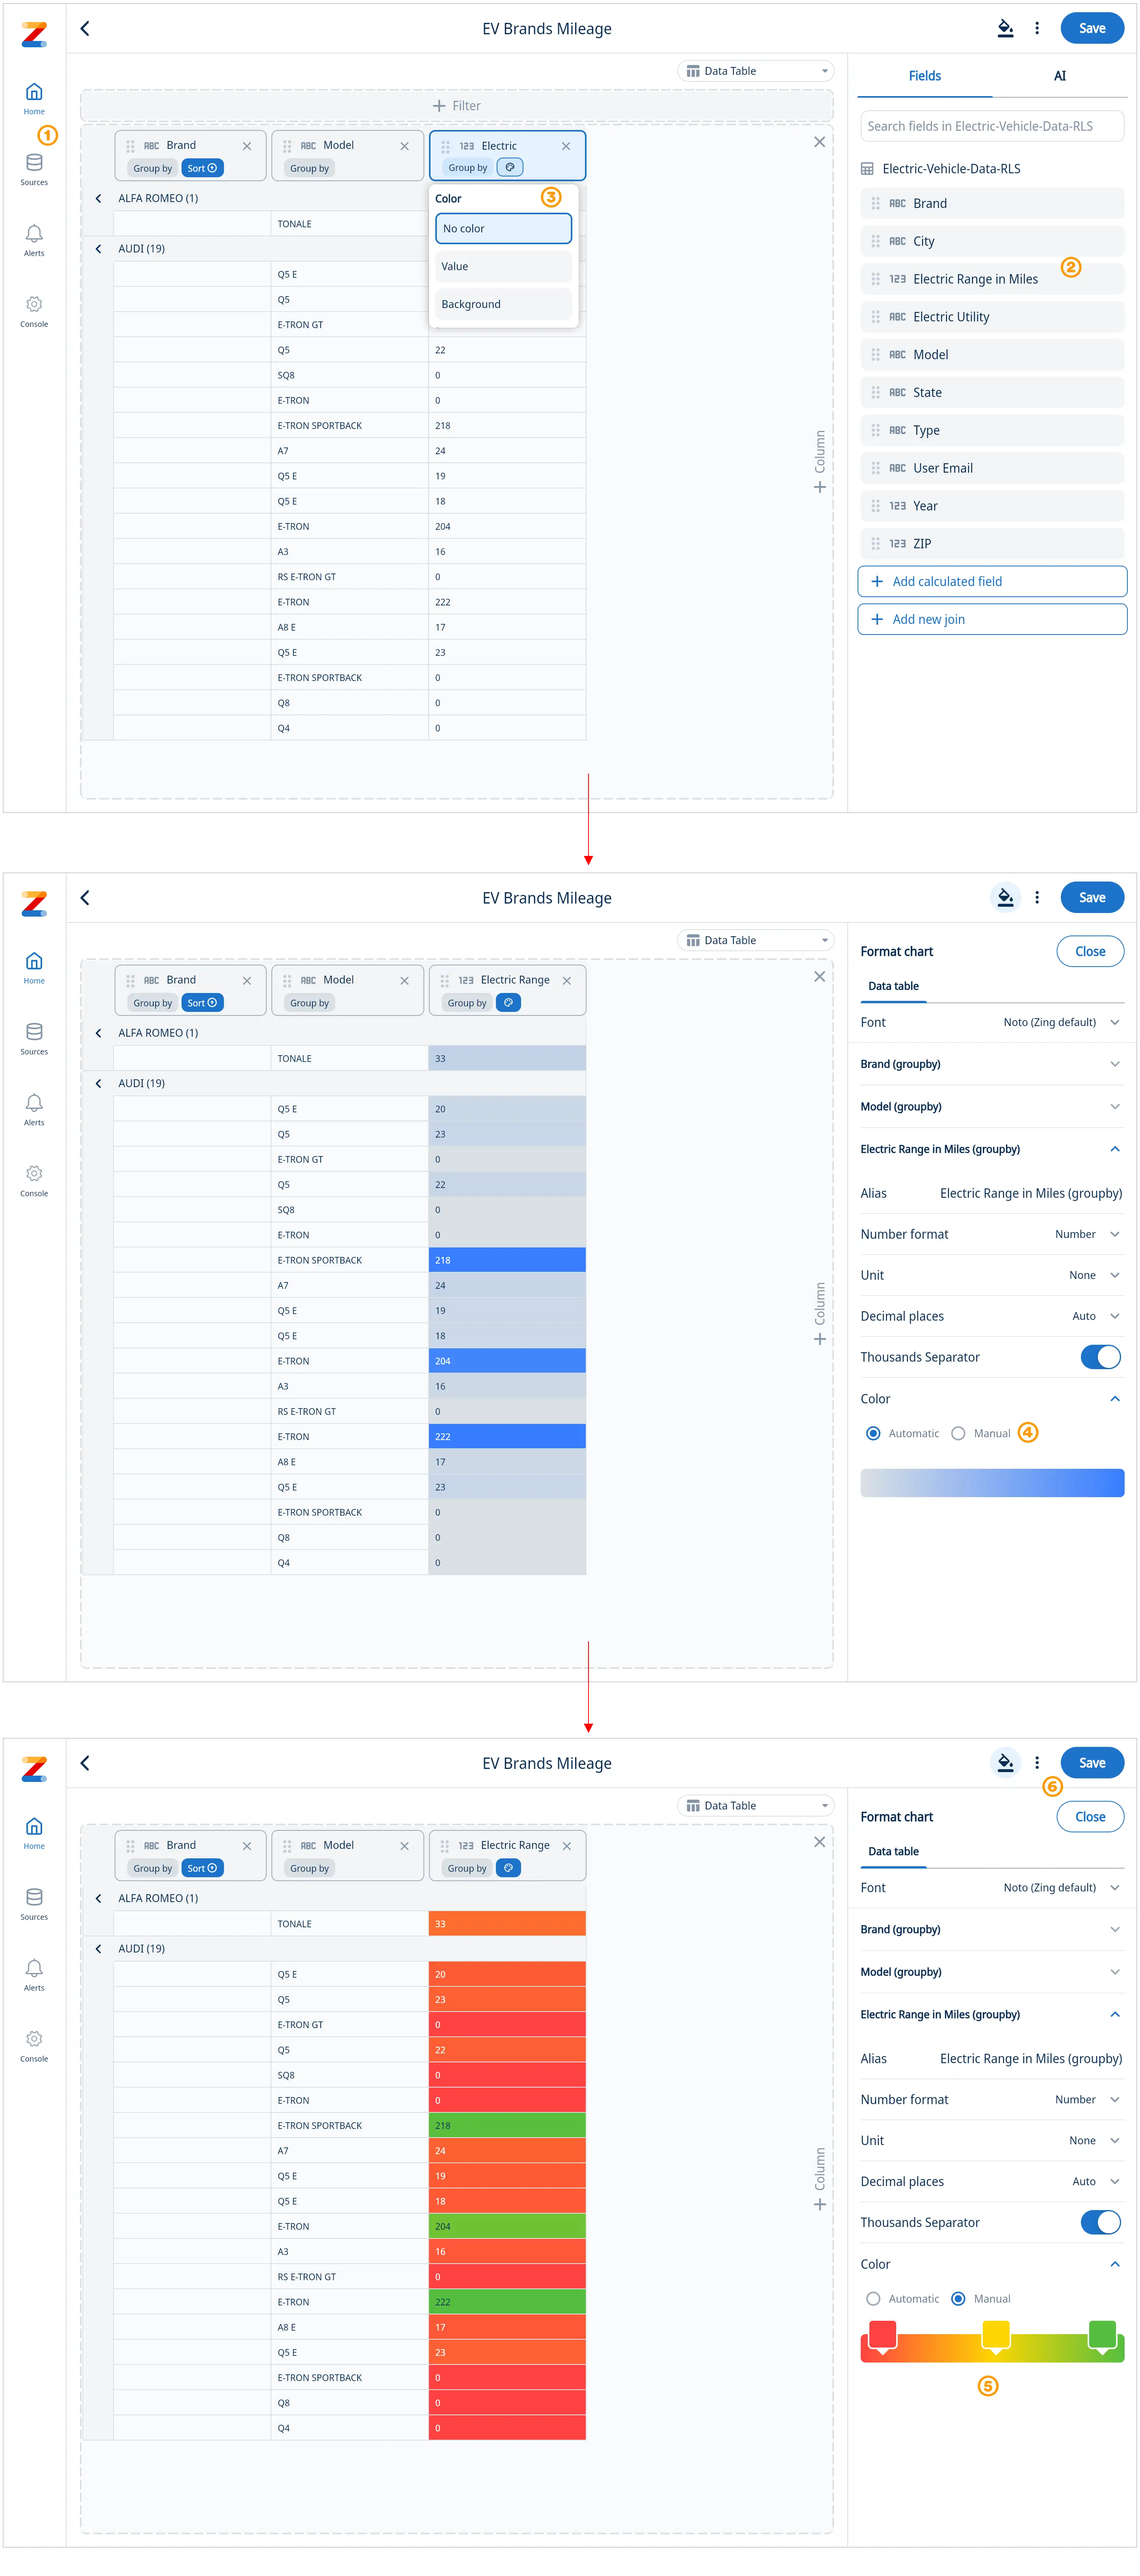
Geo Heatmaps
A geo heatmap overlays data intensity onto a geographic map, using color to represent variations across locations. From hotspots of customer activity to cold zones of underperformance, geo heat maps make data trends instantly recognizable.
Get started
- Select a data source that contains Latitude and Longitude for every location
- Select and drag the Latitude and Longitude fields into the chart builder
- Select and drag a field to separate the data by color (and size if your data supports it)
- Save your chart
- See your map with color coded data points and use the legend to quickly identify location based patterns
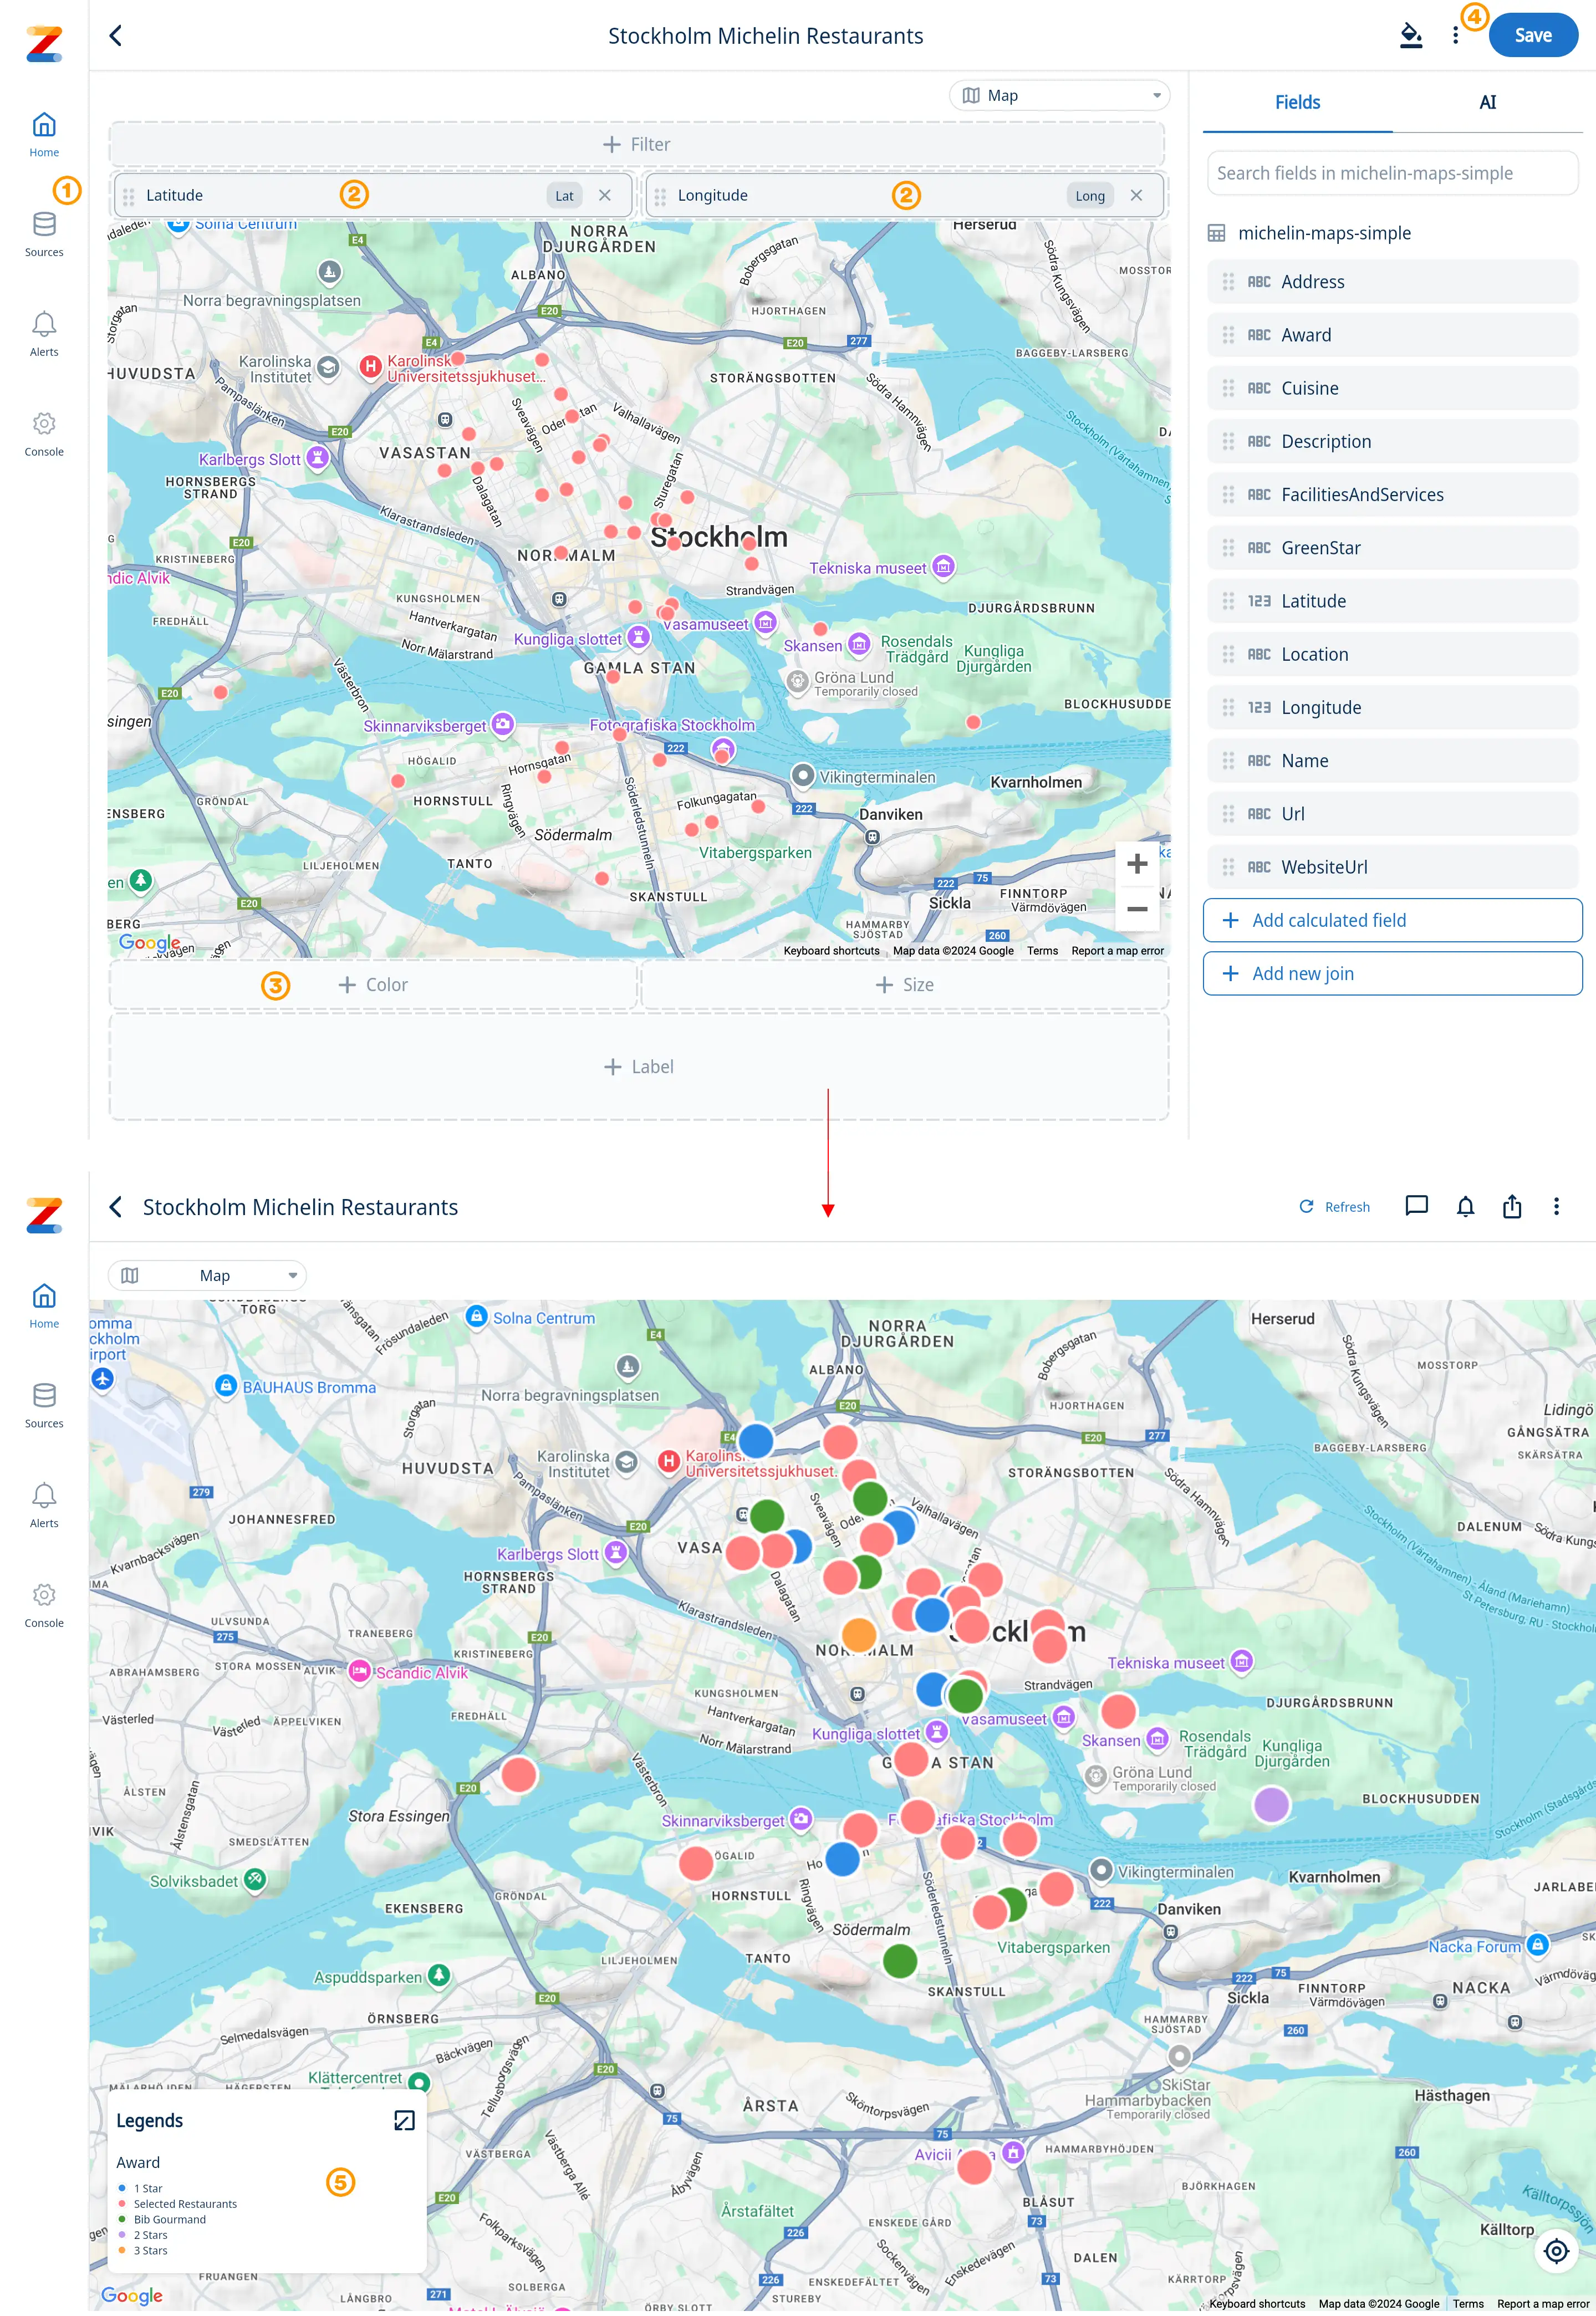
Funnel Charts
Funnel visualizations are a specialized chart type that visually represents a series of stages in a process. .
Get started
- Ask a question with natural language, or select a table/view from data sources
- Select “Funnel” from the chart menu
- Select and drag a field to the Y-axis and X-axis to build your funnel
- Select the format tab to fine tune your chart
- On the “Chart” adjust sorting (sorted High » Low by default), turn the legend on/off or switch to a different if desired
- Select the “Series” tab to further fine tune the appearance of your funnel such as neck height, neck width, and gap ratio. “Explode” adds a gap between the funnel steps.
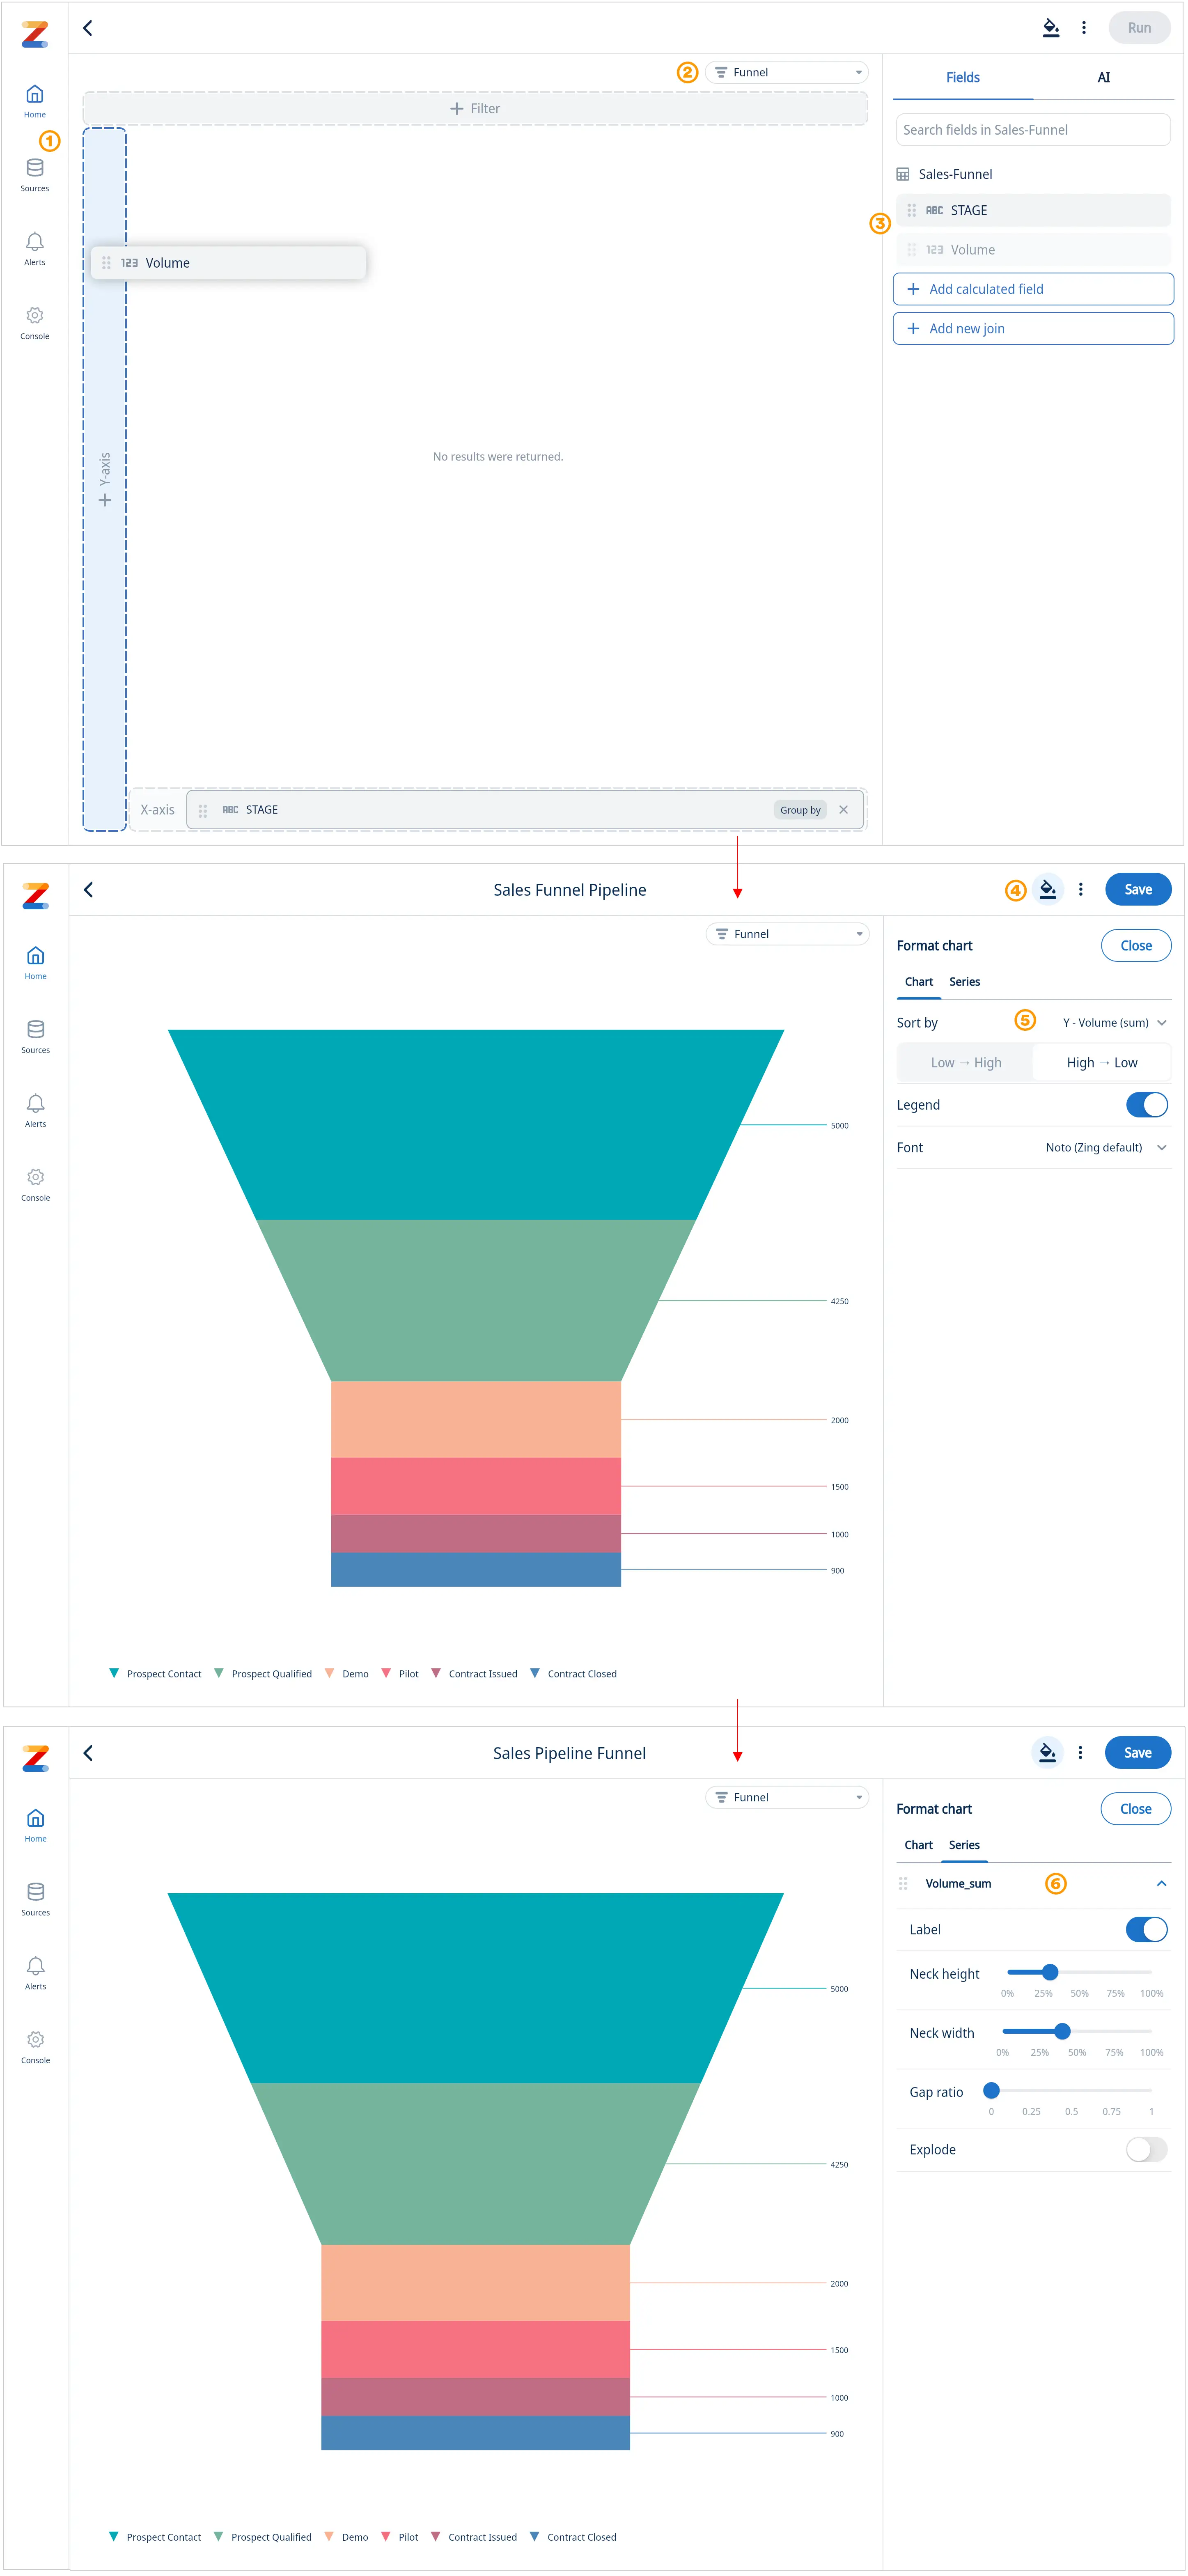
Hyperlink Formatting in Table Visualizations
Zing Data supports clickable hyperlinks directly within table cells. This allows users to add links to tables making it easier to connect your data with actionable context.
Get Started
-
Plain URLs
If a cell contains a text string that begins with
http://orhttps://, it will be rendered as a clickable link. -
HTML
<a href>Tags<a href="https://example.com">Text to Display</a><a href="https://example.com" target="_blank">Open in New Tab</a>* The optional
targetattribute is supported (_blank,_self, etc.).
Example
| Displayed Text | Field Text |
|---|---|
https://api.example.com/docs | https://api.example.com/docs |
| Internal Report | <a href="https://reports.example.com/q1" target="_blank">Q1 Report</a> |
Support Ticket | <a href="https://support.example.com/ticket/123">Ticket #123</a> |
10 - Dashboards
Dashboard previews are shown on your home feed, alongside questions and tables. You can search across saved dashboards, questions, and tables using the search bar at the top.
Creating a dashboard
Dashboards can be created, edited, and viewed on iOS, Android, and the Web.
To create a dashboard:
-
Go to the Zing web console or the Zing Data iOS / Android app.
-
Tap the ‘+’ sign on the upper right of the dashboard section on the home screen. This will open up a blank dashboard canvas.
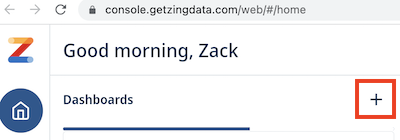
-
Drag saved questions from the right side list of questions onto the live dashboard canvas to the location you want the question card to appear on the dashboard.
From here you can drag the question card to any location on the canvas, and resize it by dragging a corner. Tap the trash bin icon to delete a question card.
-
Name your dashboard (you must do this before saving)
-
Tap ‘Save’ to save your dashboard.
If you’re creating a dashboard from mobile, the process is the same as above, except questions are shown in a list at the bottom of the dashboard creation screen and are added to a dashboard by dragging them onto the dashboard canvas.
Editing a dashboard
To edit a dashboard, simply click on the dashboard to enter the dashboard screen. Then tap the pencil icon to edit.
- Question cards can be resized by dragging the corners.
- Question cards can be deleted from a dashboard by tapping the trash can icon.
- Question cards can be moved by dragging the header.
Notes about how dashboards work
- When you open a dashboard, Zing will query your data source(s) live, so that dashboards are always populated with the most up-to-date data.
- If you leave the dashboard loaded on the screen for a while, or are within a single session you’ll see the version of the dashboard from when you first clicked on the dashboard in your session. You’ll also see a ’last refreshed’ time at the top.
- Dashboards can have question cards from any mix of data sources.
- A dashboard canvas is 12 squares by 12 squares and a question card can be sized as small as 3x3 or as large as 12x12. So a dashboard can up to 16 question cards (12x12=144 / (3x3=9).
How dashboards display on mobile and web
Questions cards within a dashboard intelligently re-flow depending if you’re accessing the dashboard on web or mobile and the available screen space.
There is no need to build different versions for mobile and web – a single dashboard design fluidly scales across device types:
- On mobile, a maximum of question cards will shown side by side so they are large enough to be easily readable. If the dashboard was designed with more than two question cards, the question cards flow vertically for easy scrolling.
- On web, up to four question cards will be shown side by side.
Interacting with a dashboard
Dashboards aren’t just a collection of questions – they’re live and interactive.
Just tap on a question card to see that question full-screen and see comments and alerts associated with it.
From the question, you can also do the following on iOS, Android, and the web:
- Zoom in / out
- Change the chart type
- Turn on/off data series
- Add alerts for push or email notifications when new data comes in which meets criteria you set (up to every minute or as infrequently as every month) including:
- Percentage change (up or down)
- Percentage increase from previous value
- Percentage decrease from previous value
- Absolute amount increase
- Absolute amount decrease
- Going above a fixed value
- Dropping below above a fixed value
- Sort based on X or Y values
- See the data as a table
- Copy the question and modify or build on it
- Tap into specific values to see more detail
- Save down an image of the graph
- Export a CSV of the data
Sharing a dashboard
- Click on a dashboard on your home screen.
- Click on the Share icon.

- Type the email address(es) of the users you want to share the dashboard with.

- A user can be invited as a “Viewer” or an “Editor” to a dashboard.

- Select the role and click on the Arrow icon to share the dashboard with the user(s).
- The list of users the dashboard is shared with will be shown in the Share Panel. The role of the shared users can be updated here. You can also revoke access to the dashboard for a particular user by clicking on the dropdown in front of the user and selecting “No Access”. You can share the dashboard with the entire organization by selecting a role under the organization dropdown.

- The shared dashboard will appear in the user’s homescreen.
- If you share the dashboard with a user who does not have an account with Zing, they will receive an invitation to join Zing and they will be added to your organization as well.
10.1 - Controls
Create interactive filters on dashboards so people can apply filters to one or multiple questions in a dashboard quickly. This works for all questions in Zing created with natural language, or with the visual query builder.
Quick summary:
- Have control widgets that apply to one, multiple, or all questions on a dashboard
- Include control widgets:
- Controls can be simple selections from a list, can be numerical comparisons, open text inputs, or specific dates
- Allow/disallow:
- Search of values within a filter
- Default values for a filter
- Showing Null values in a filter
- Multi-select of values
Add a new control to a dashboard
Controls are basically filters, customized for dashboard purposes. With Zing’s dashboard controls you can navigate your data with
Create a linked dashboard control
This allows a single dashboard widget to control multiple tables, views, and charts. This works even with nested fields (E.g. city field nested under state field), and you designate one table.field as the primary which is used for showing values from that field in the drop-down to a user.
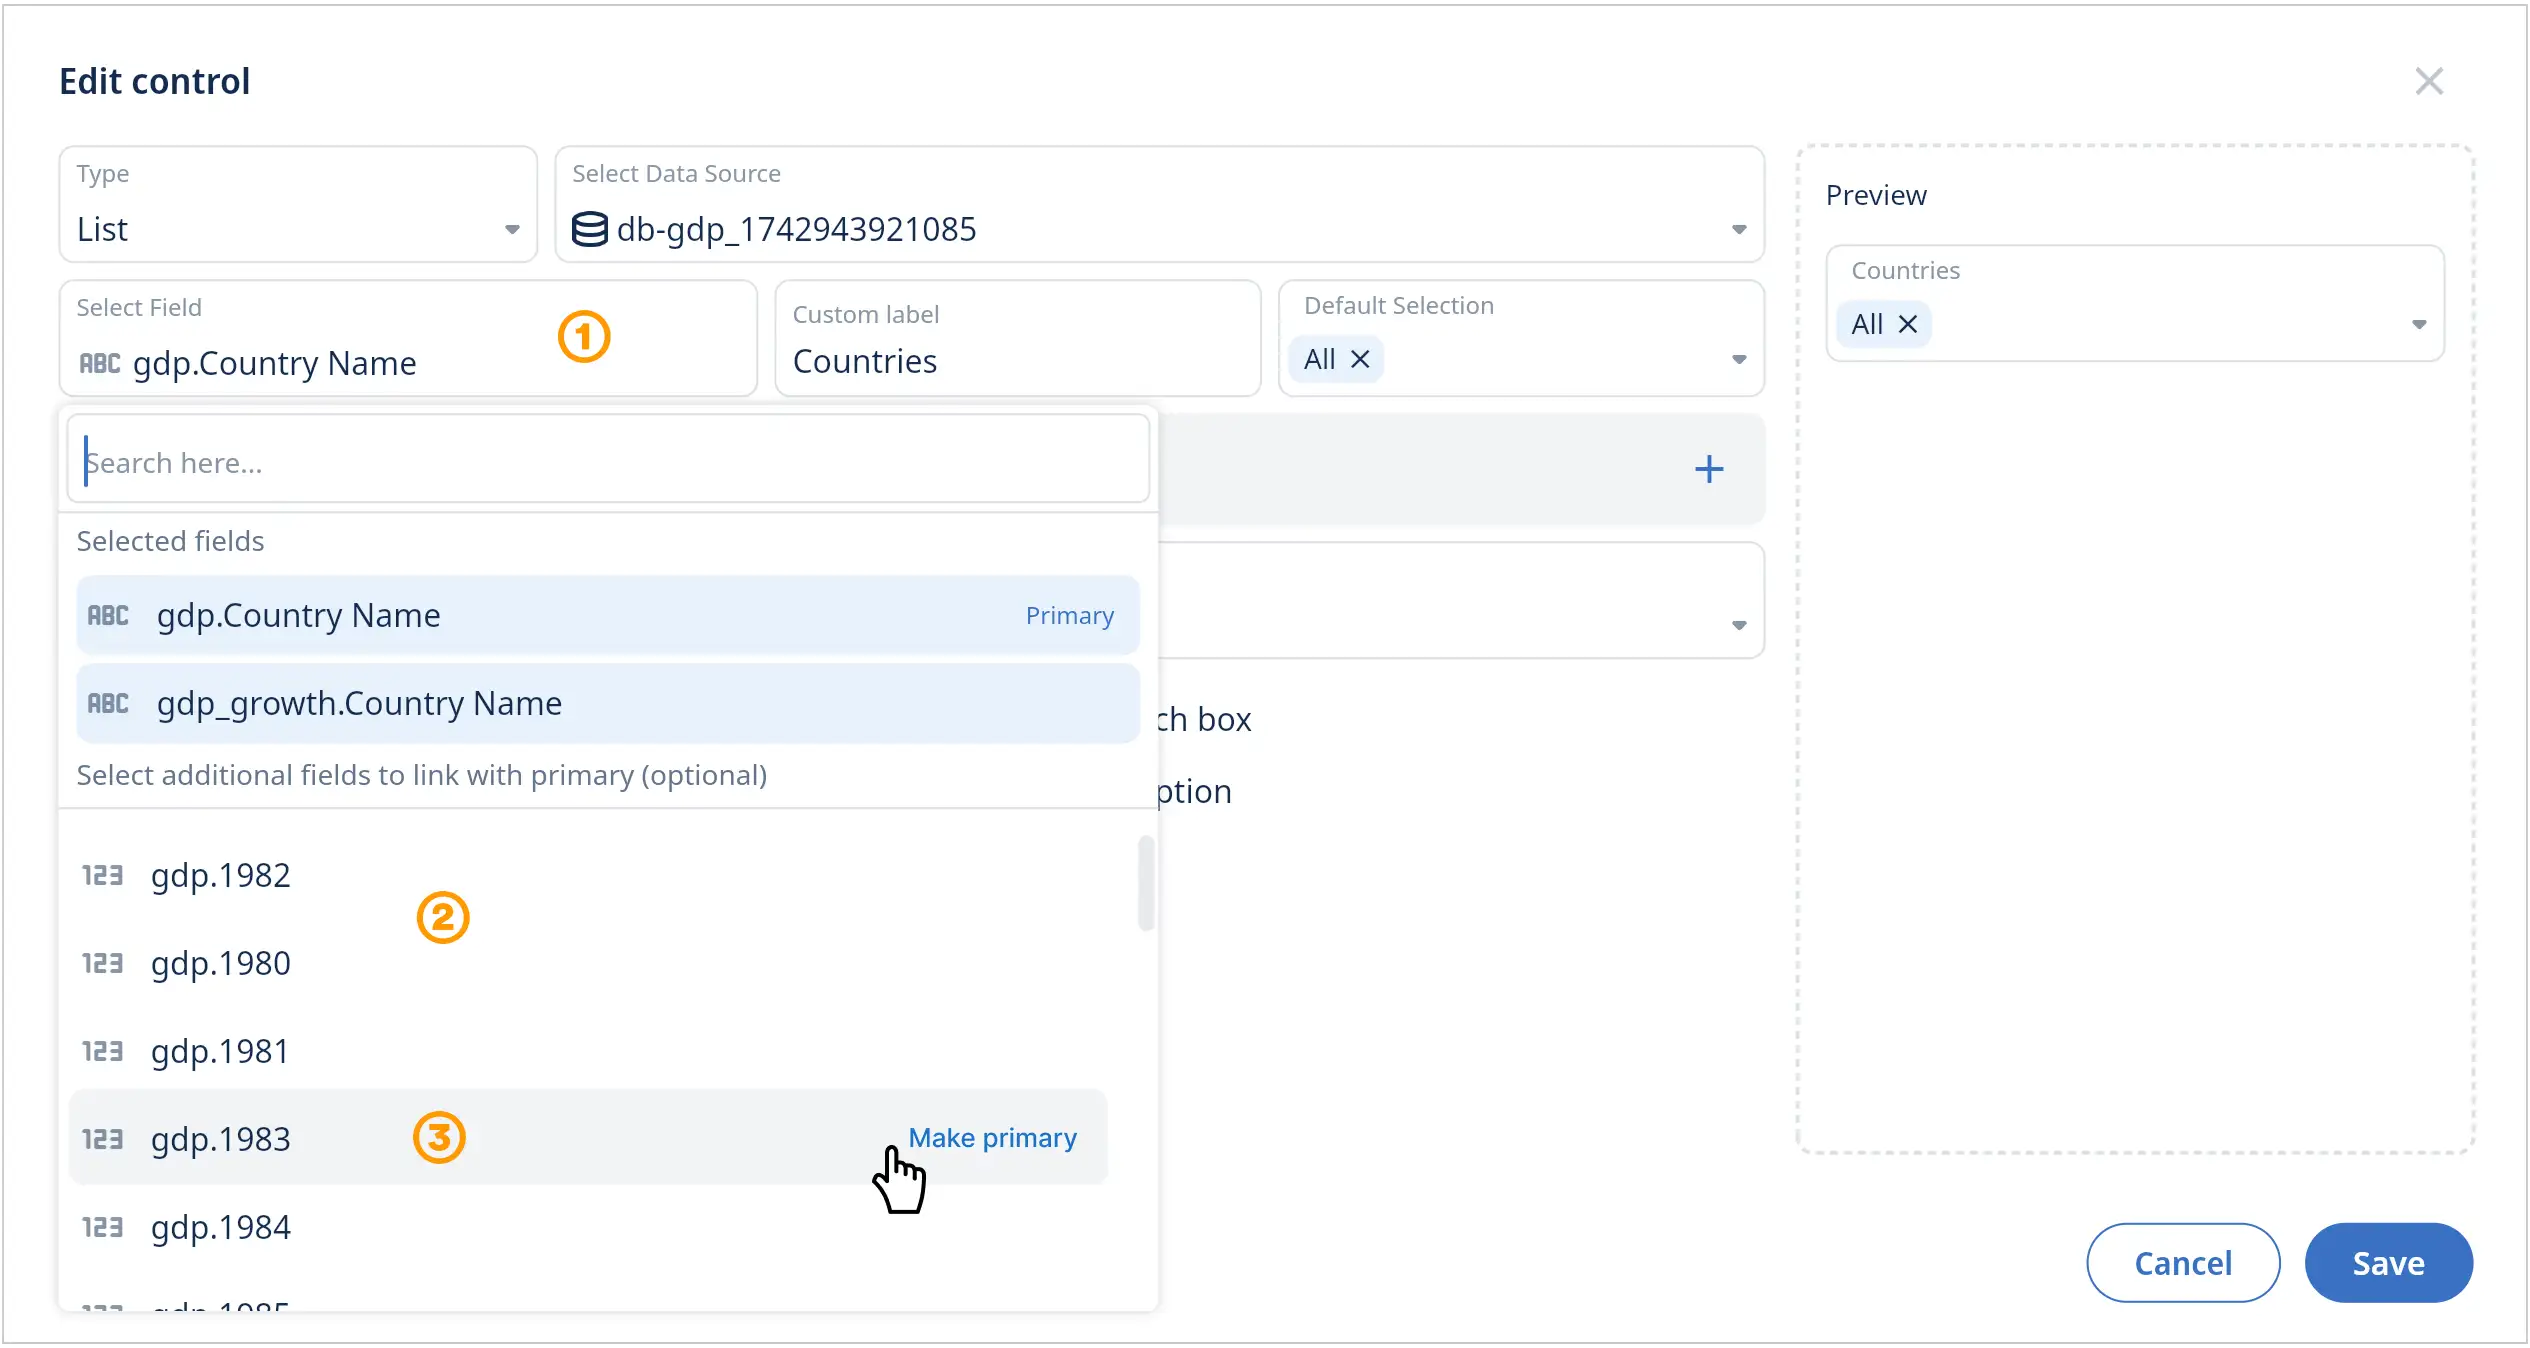
- Add a new control widget to your dashboard or edit an existing one and select the field menu.
- Select your first field from the menu (this will be the primary field).
- Optional: Select additional fields from different tables to link to the primary field.
You can easily edit or select another field in the menu and make it the new primary field. Click ‘Save’ to update the control widget. - Now, one control widget can update multiple charts in your dashboard that use the linked fields.
- Verify the filters are working as expected for all linked fields and charts.
List
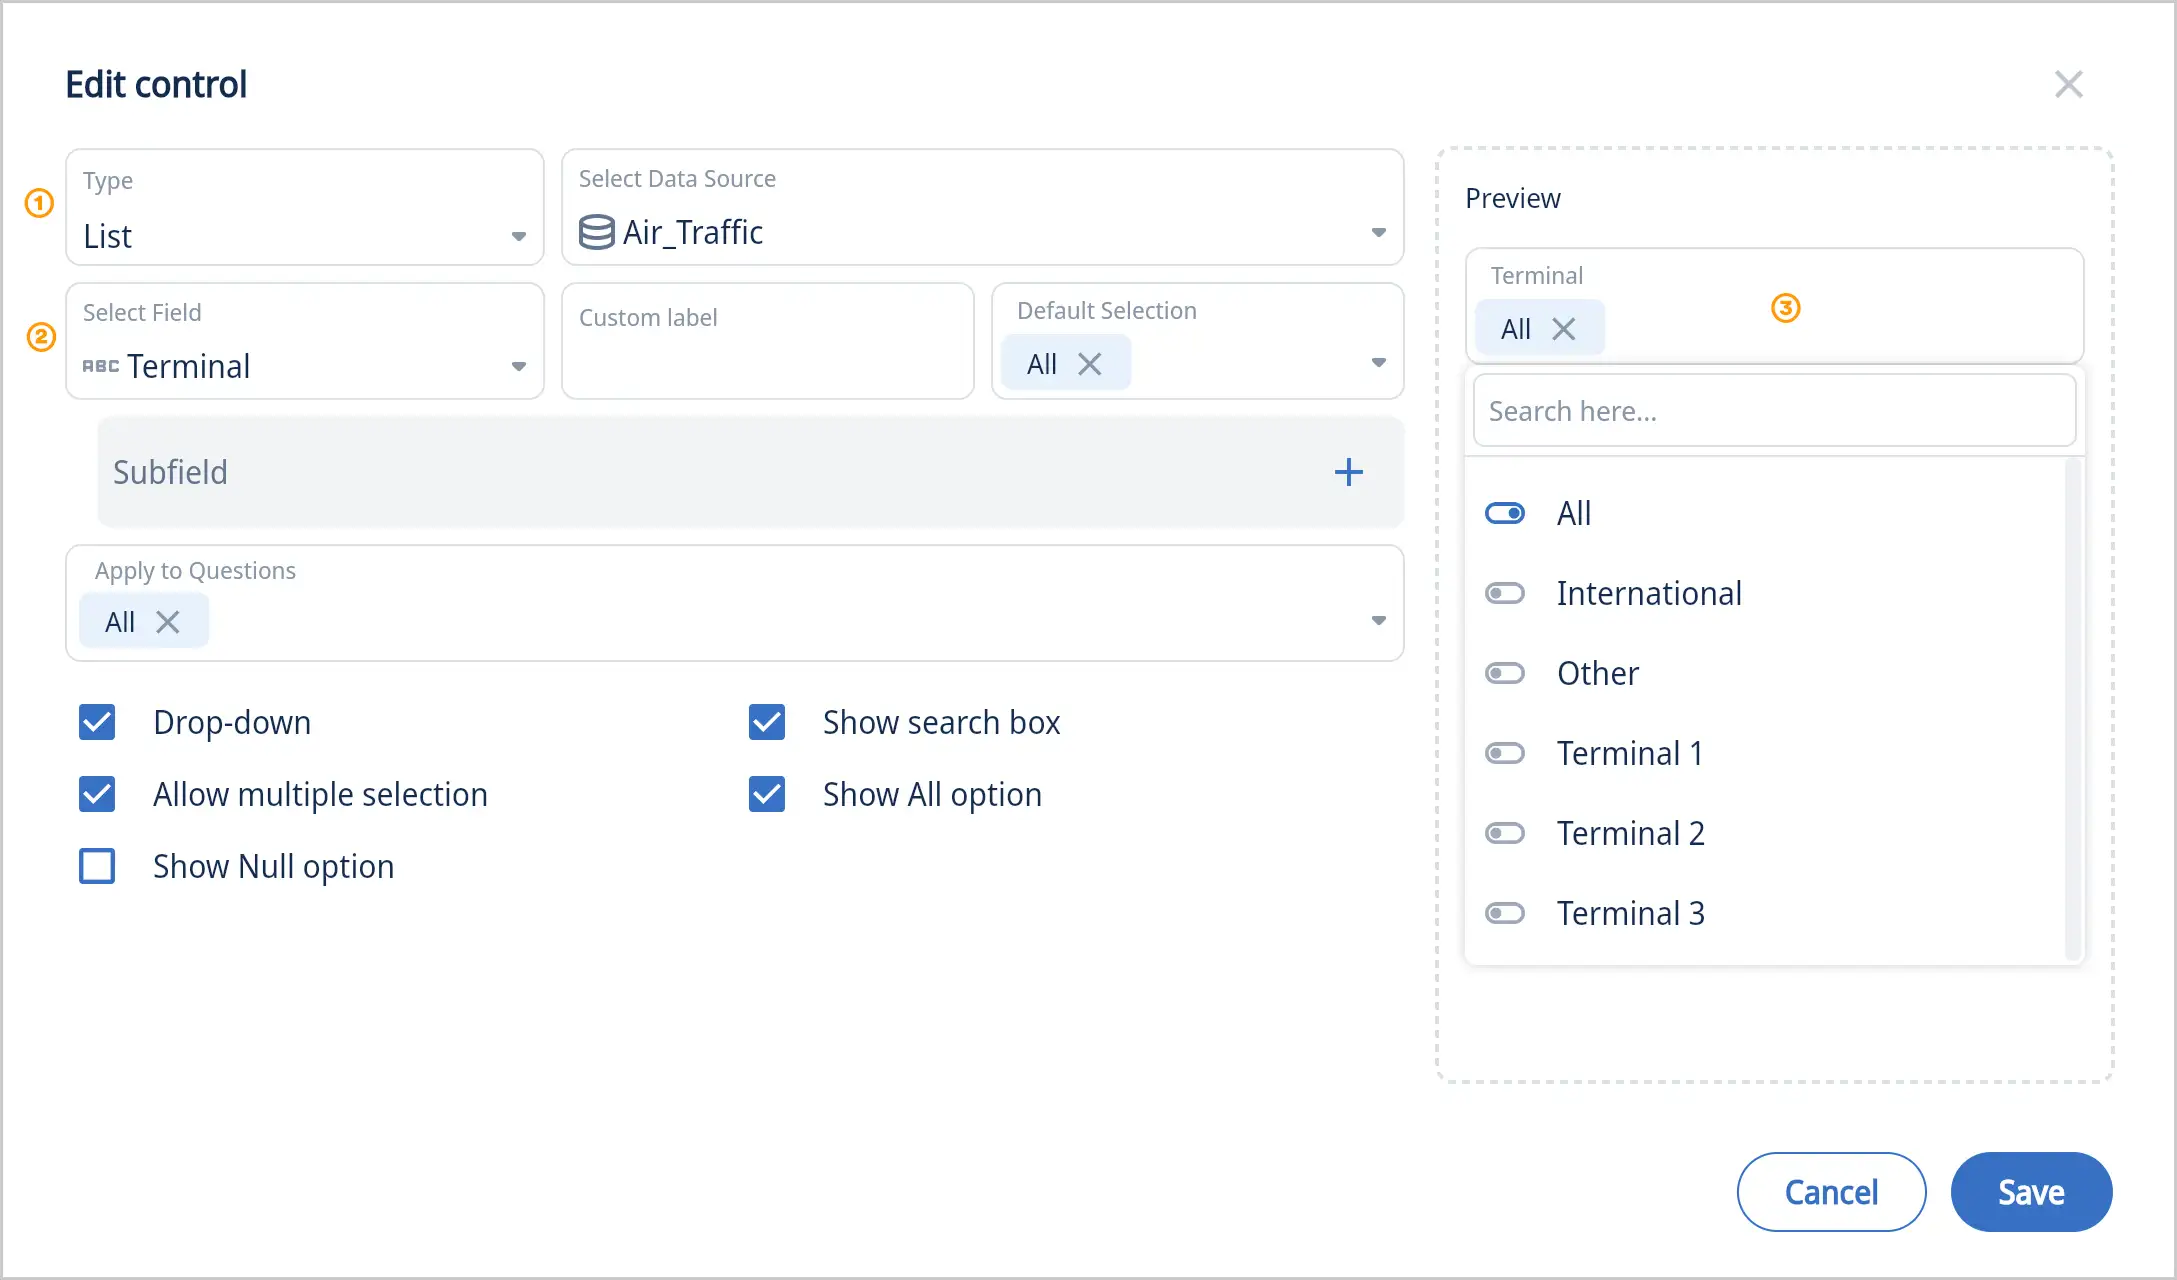
- Select the control type “List”
- Select a field
- Preview the new control with your data
Extra options:
- Uncheck “Drop-Down” to get a simple list vs a drop down menu
- Uncheck “Allow multiple selection” so a user can only select one item
- Check “Show Null option” if the data includes null and you want to make it available
- Uncheck “Show search box” if your list is really short and search is not really needed
- Uncheck “Show all option” if you don’t want that all items can be selected all at once
List with a second list (subfield)
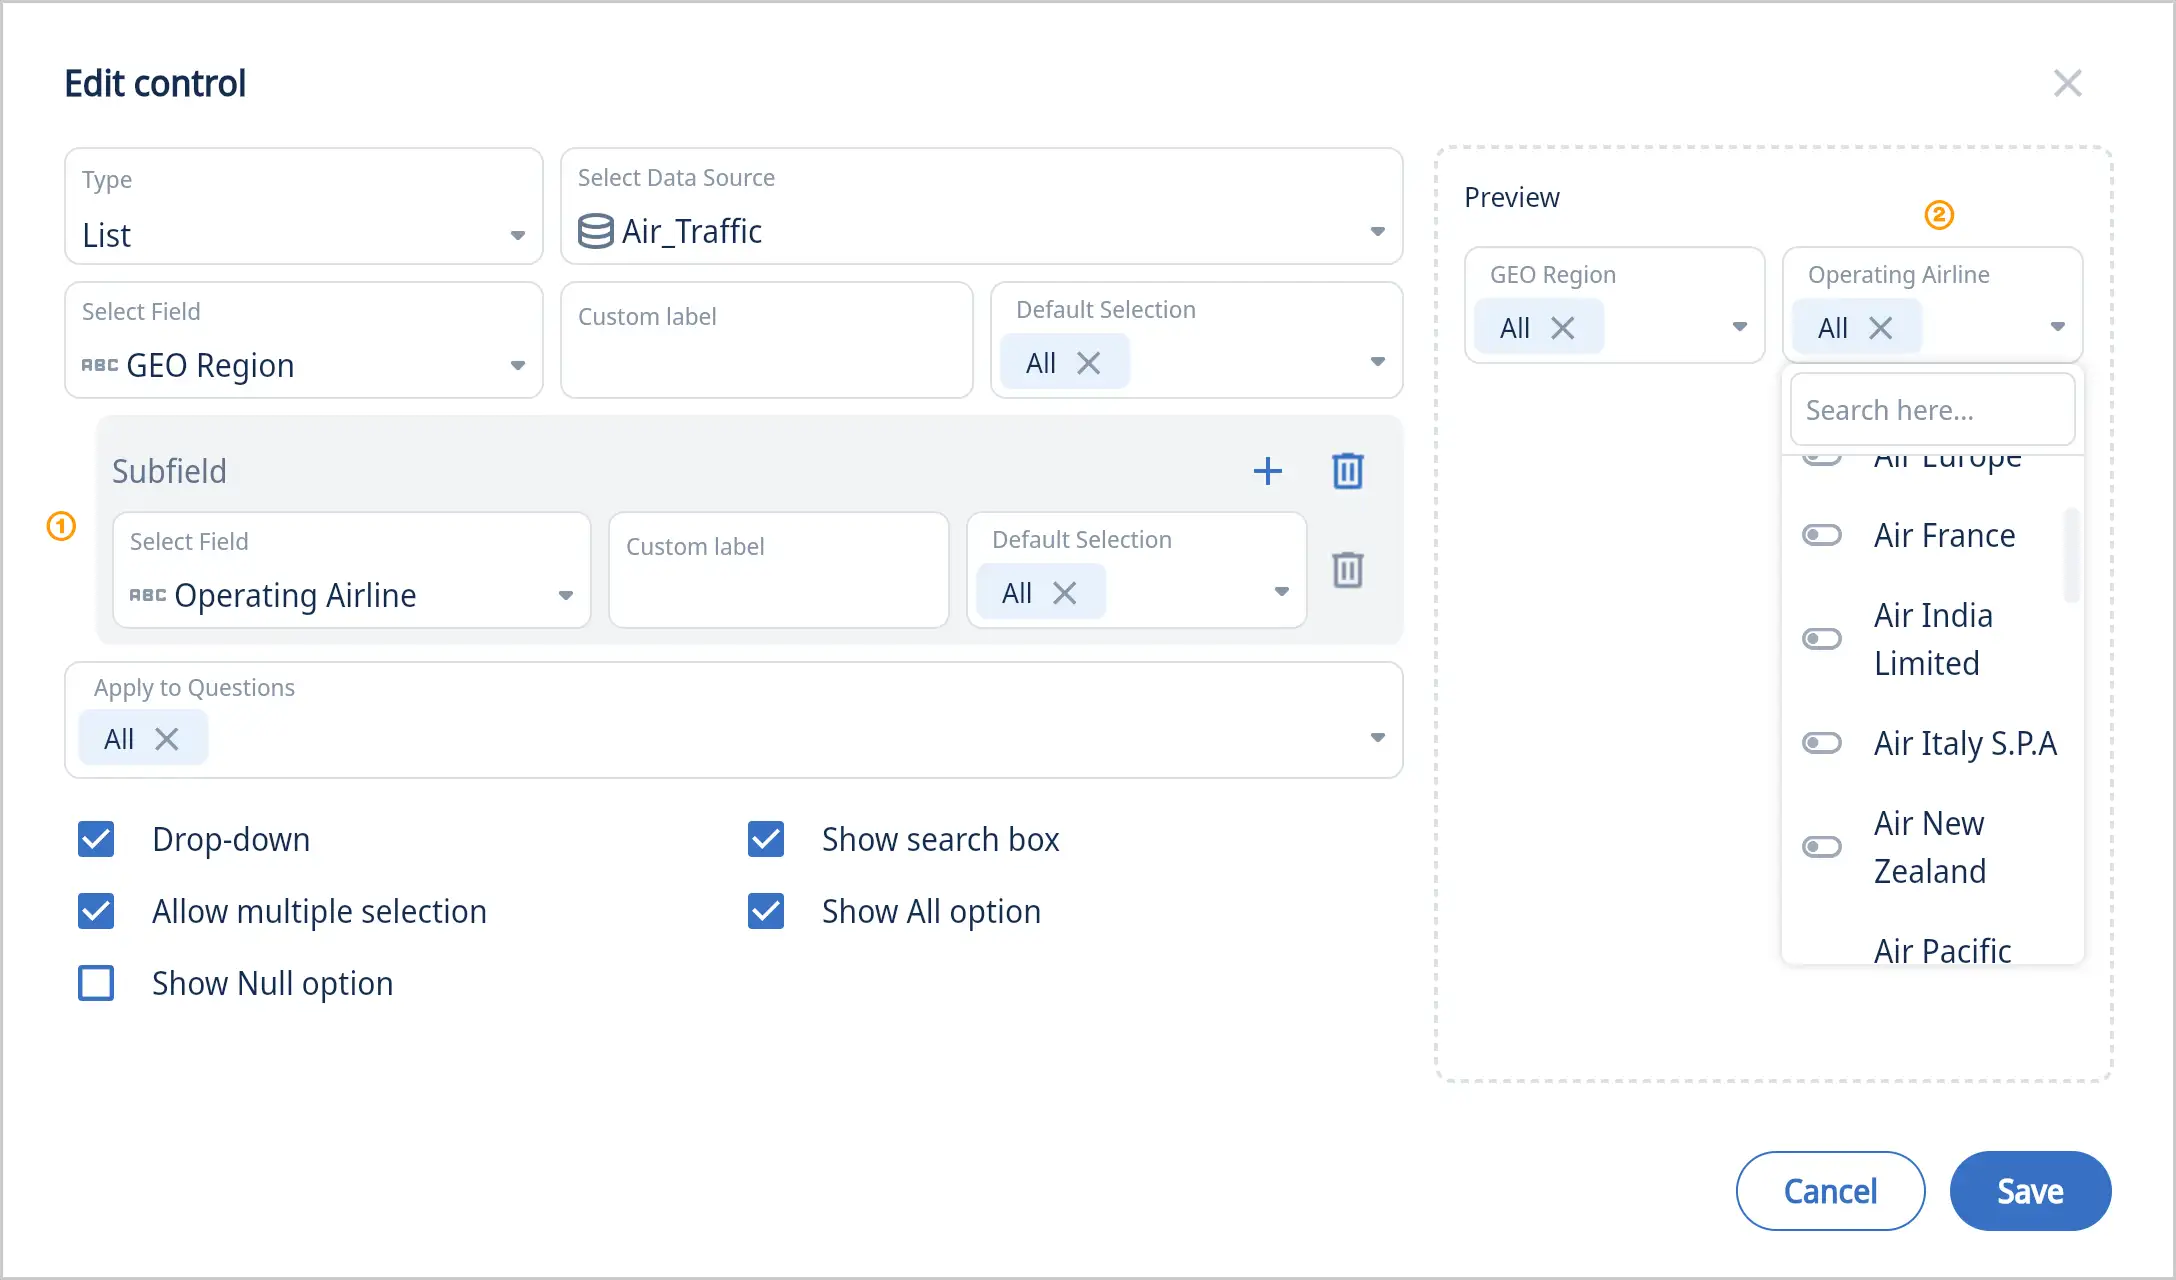
Add a subfield if you want a second list in your dashboard. Example as shown above with Regions in first drop-down menu and Airlines in second drop-down menu
List with no drop-down
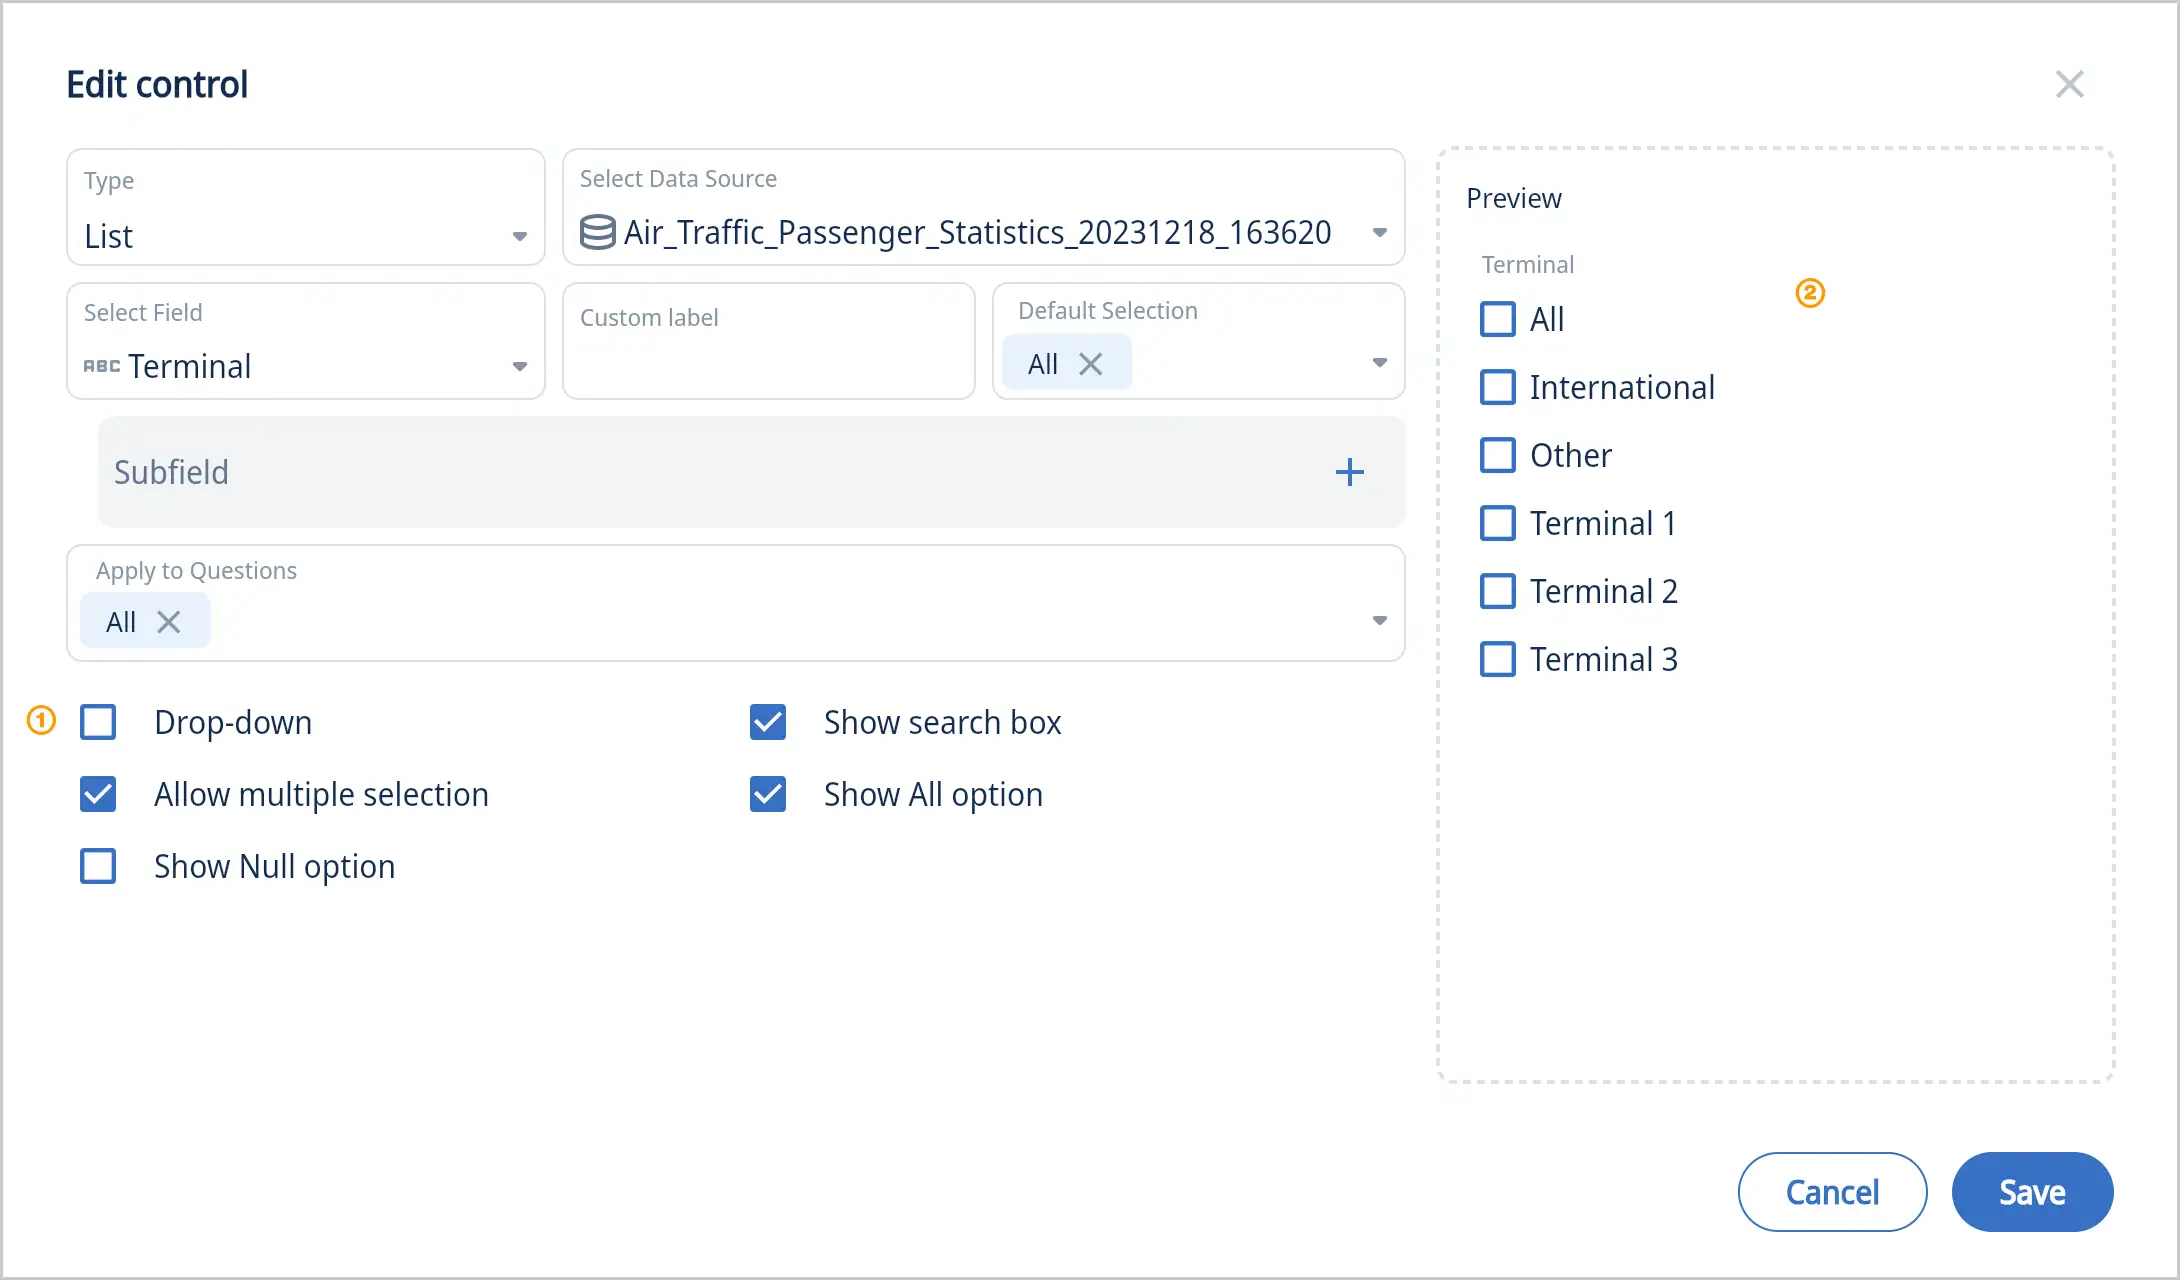
Example above is showing a list with “Drop-Down” unchecked. Great for short lists and quick access.
Text
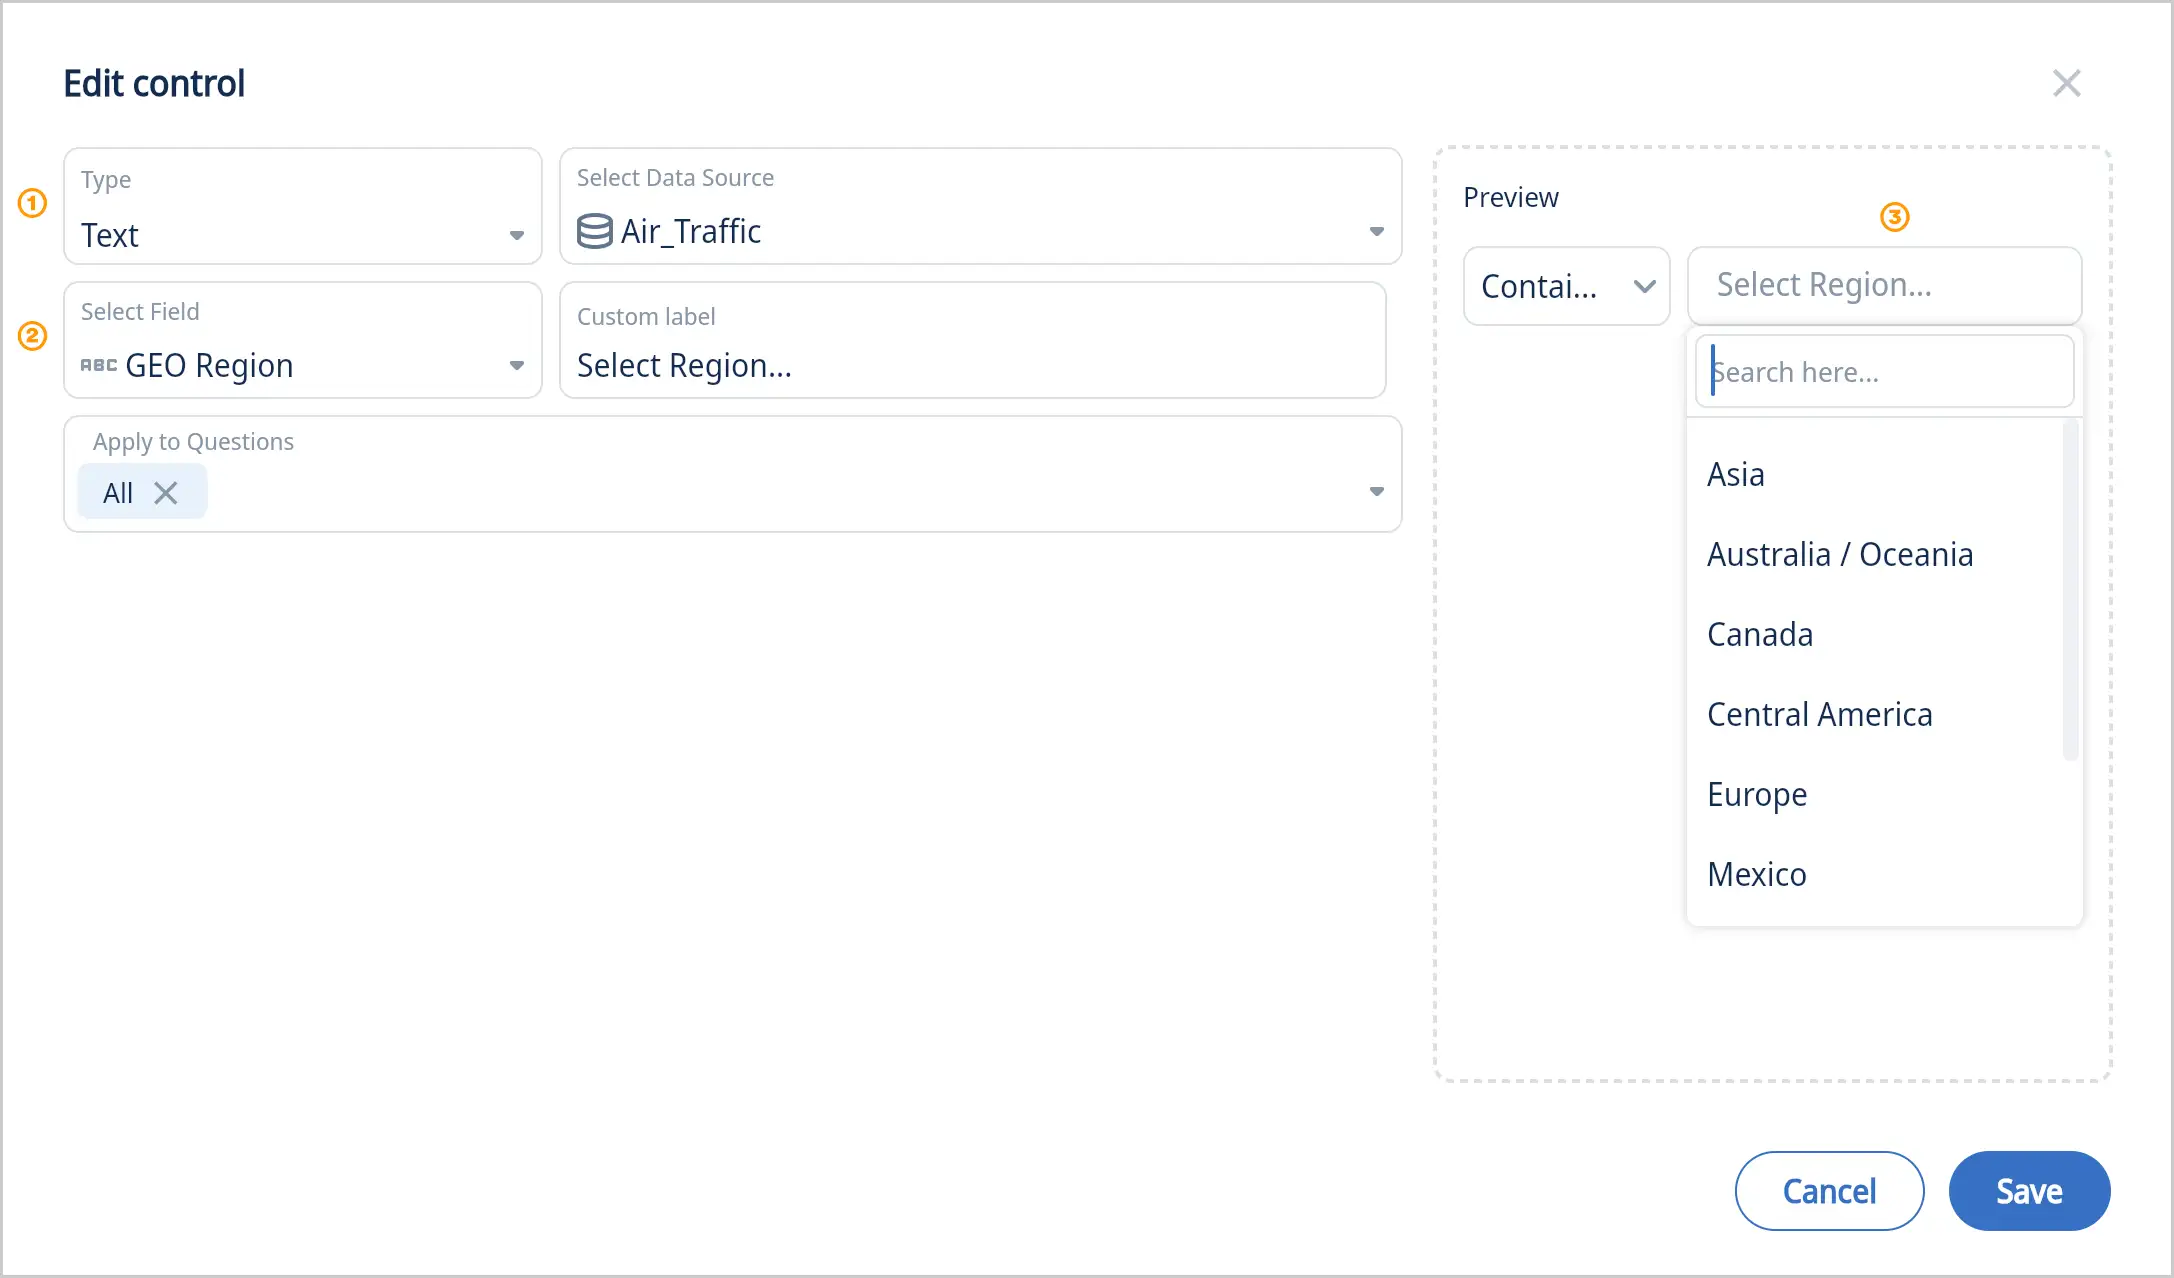
- Select the control type “Text”
- Select a field
- Preview the new control with your data
Number
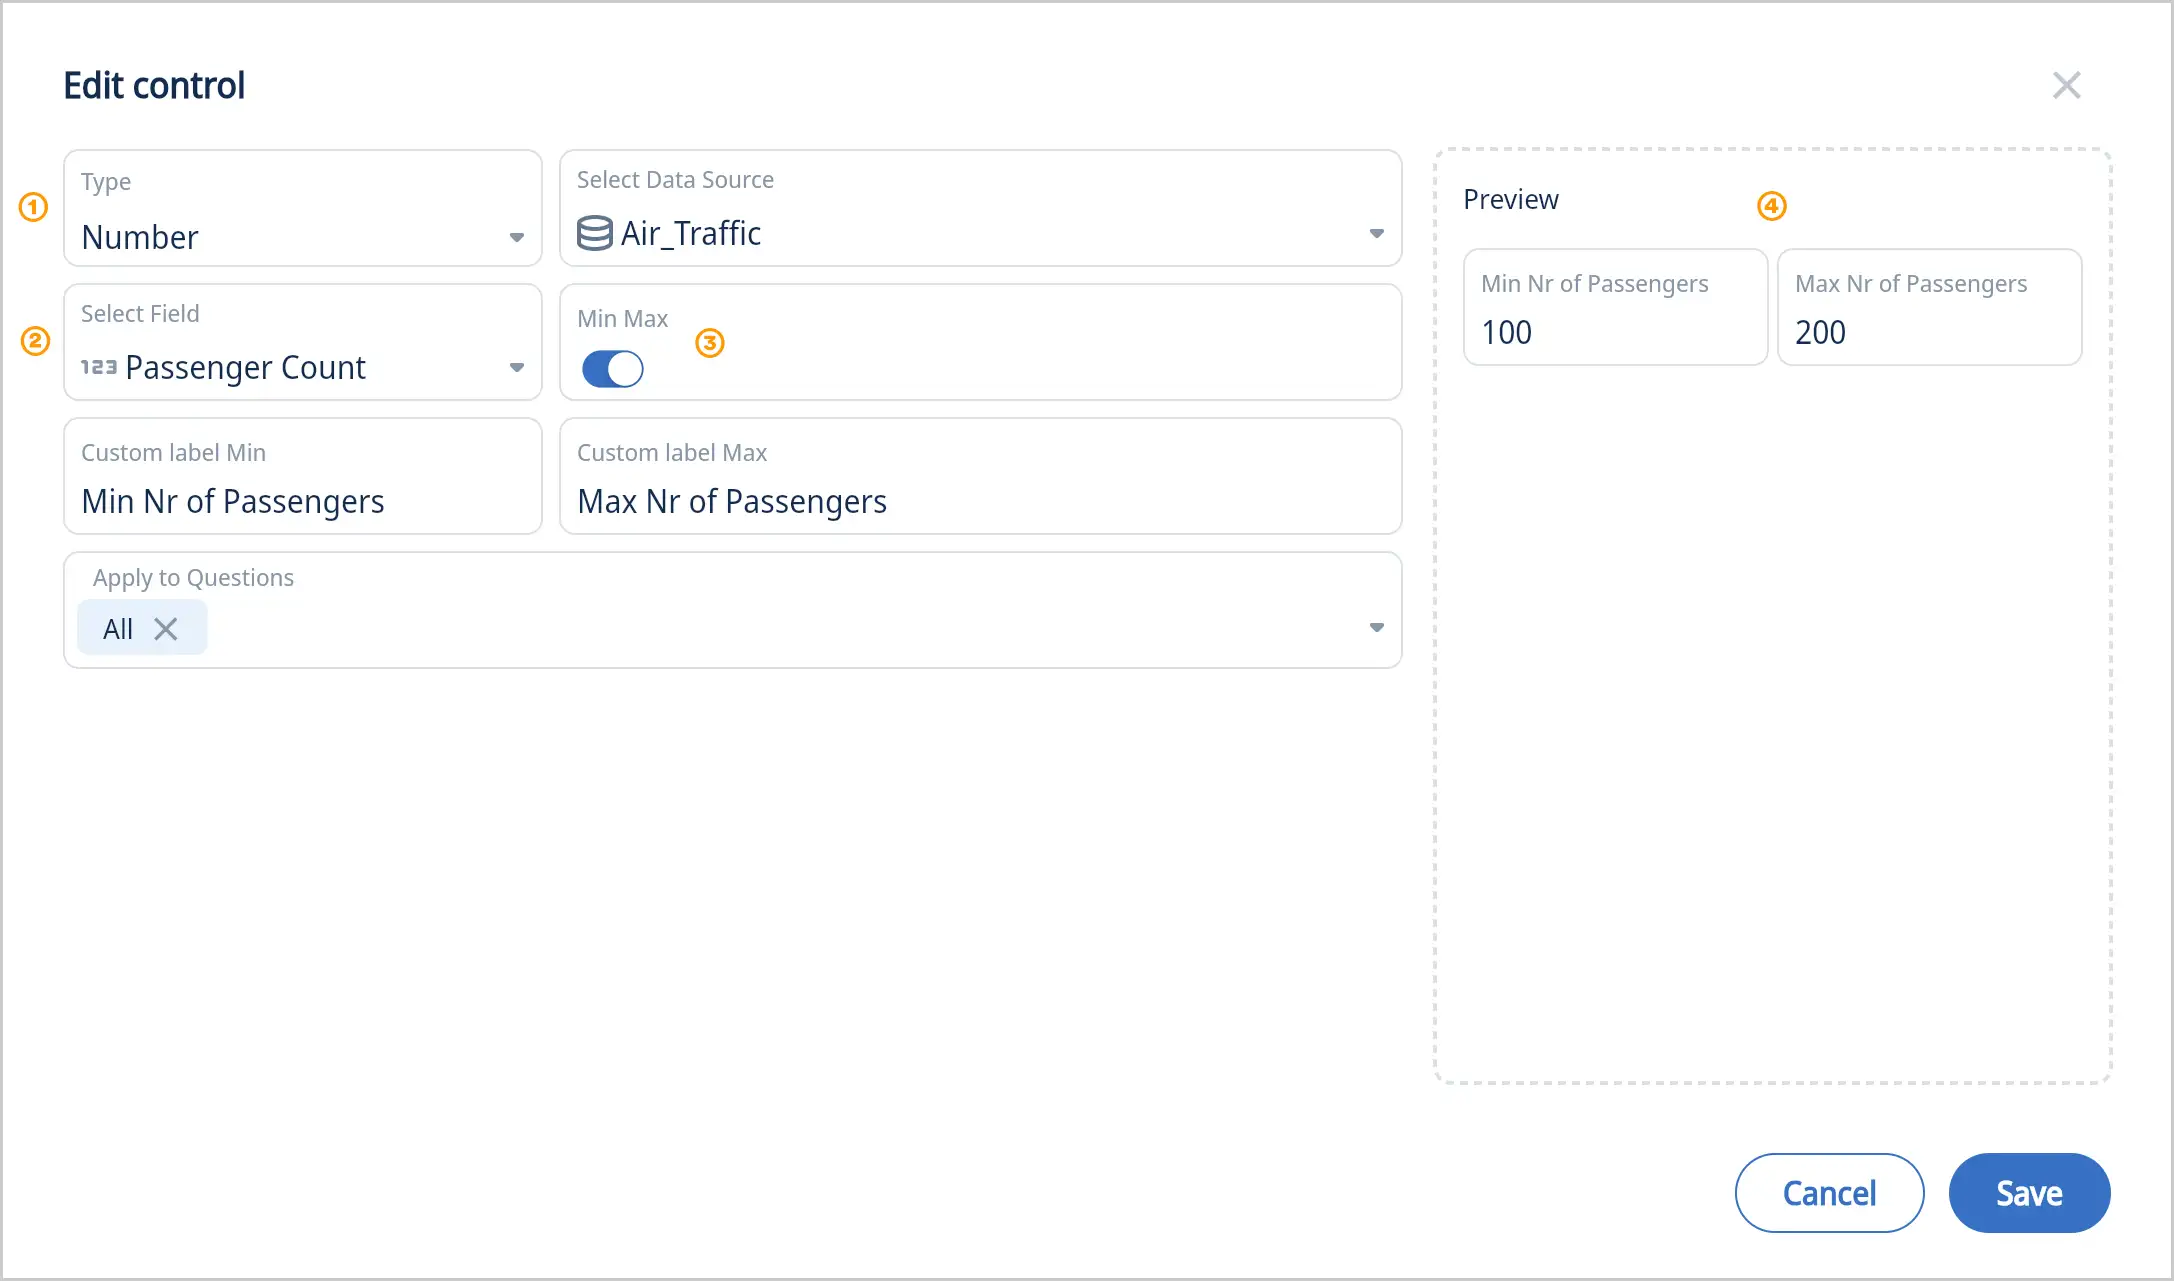
- Select the control type “Number”
- Select a field
- By default the number control is for a single value. Select “Min Max” to limit results in the selected range.
- Preview the new control with your data
Date Range
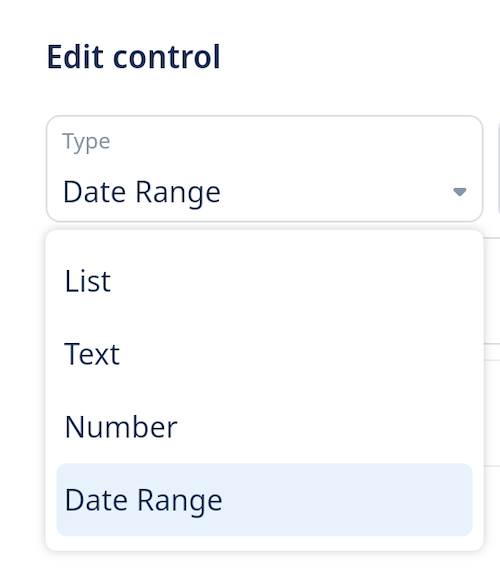
-
Select the control type “Date Range”
-
Select a field
-
Choose from:
- Single date
- Standard comparisons: is, is not, after, before
- Inclusive options: after (inclusive), before (inclusive)
- Data validation: is empty, is not empty
- Range filtering: between, not between
- Relative dates:
-
Week to Date (Starting Sunday)
-
Current Week (Starting Sunday)
-
Week to Date (Starting Monday)
-
Current Week (Starting Monday)
-
Month to Date
-
Current Month
-
Quarter to Date
-
Current Quarter
-
Year to Date
-
Current Year
-
Between a relative date (e.g. past 7 days) and future days (e.g. next 7 days)
-
Past, Future
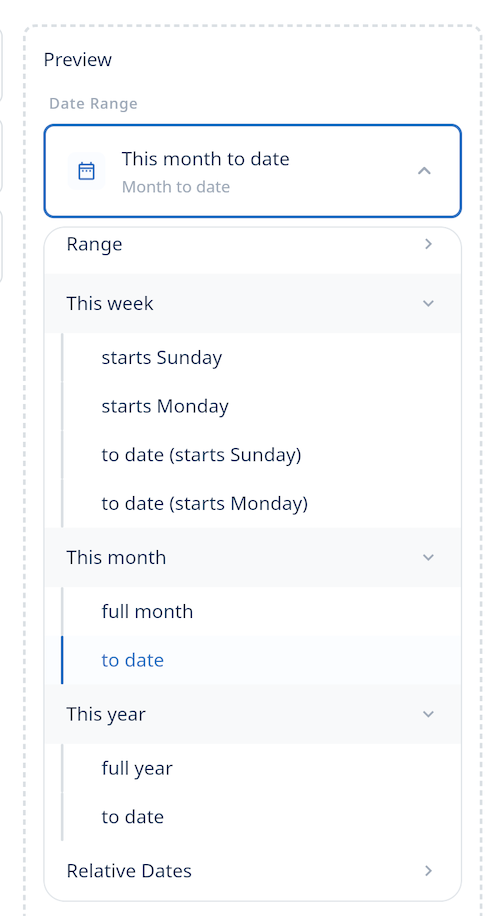
-
-
Optionally, specify a time comparison range
-
Previous period
-
Previous year
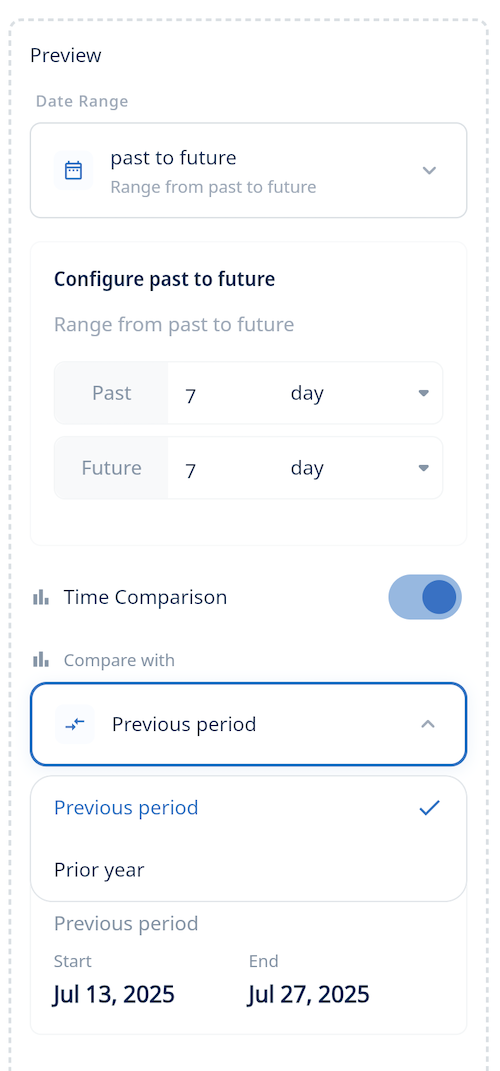
-
-
Preview the new control with your data
Please note: with date range people can select from “is, is not, after, greater than or equal, before less than or equal, is empty, is not empty, between, not between, relative date”
Enhanced Dashboard Controls:
Sticky Filters when Opening Questions
 When you click into a question from a dashboard:
- The dashboard’s filter values now appear at the top as editable drop-downs
- You can modify these without returning to the dashboard
- The question auto-refreshes with the new filter values
This avoids the back-and-forth between dashboards and questions, saving time and clicks. This upgraded dashboard controls make filtering smoother and more intuitive.
Integration with Other Capabilities
Your filters remain consistent even when using:
- Drill down to explore subgroups
- See values for a breakdown
- Exclude to remove a data point
You’ll keep your filter context throughout your exploration.
Scrollable Dashboard Cards
You can now scroll dashboard cards horizontally. This is especially helpful when viewing tables with many columns or wide visualizations.
10.2 - Add text, links, images and web pages to your dashboards
- Create a new dashboard or open an existing one.
- Select the desired widget from the widget library from the right hand panel
» see screenshot below. - Customize the widget with your content. You can upload images, write text, embed web pages, or link to another dashboard using the provided options.
- Position the widget on your dashboard to create the desired layout.
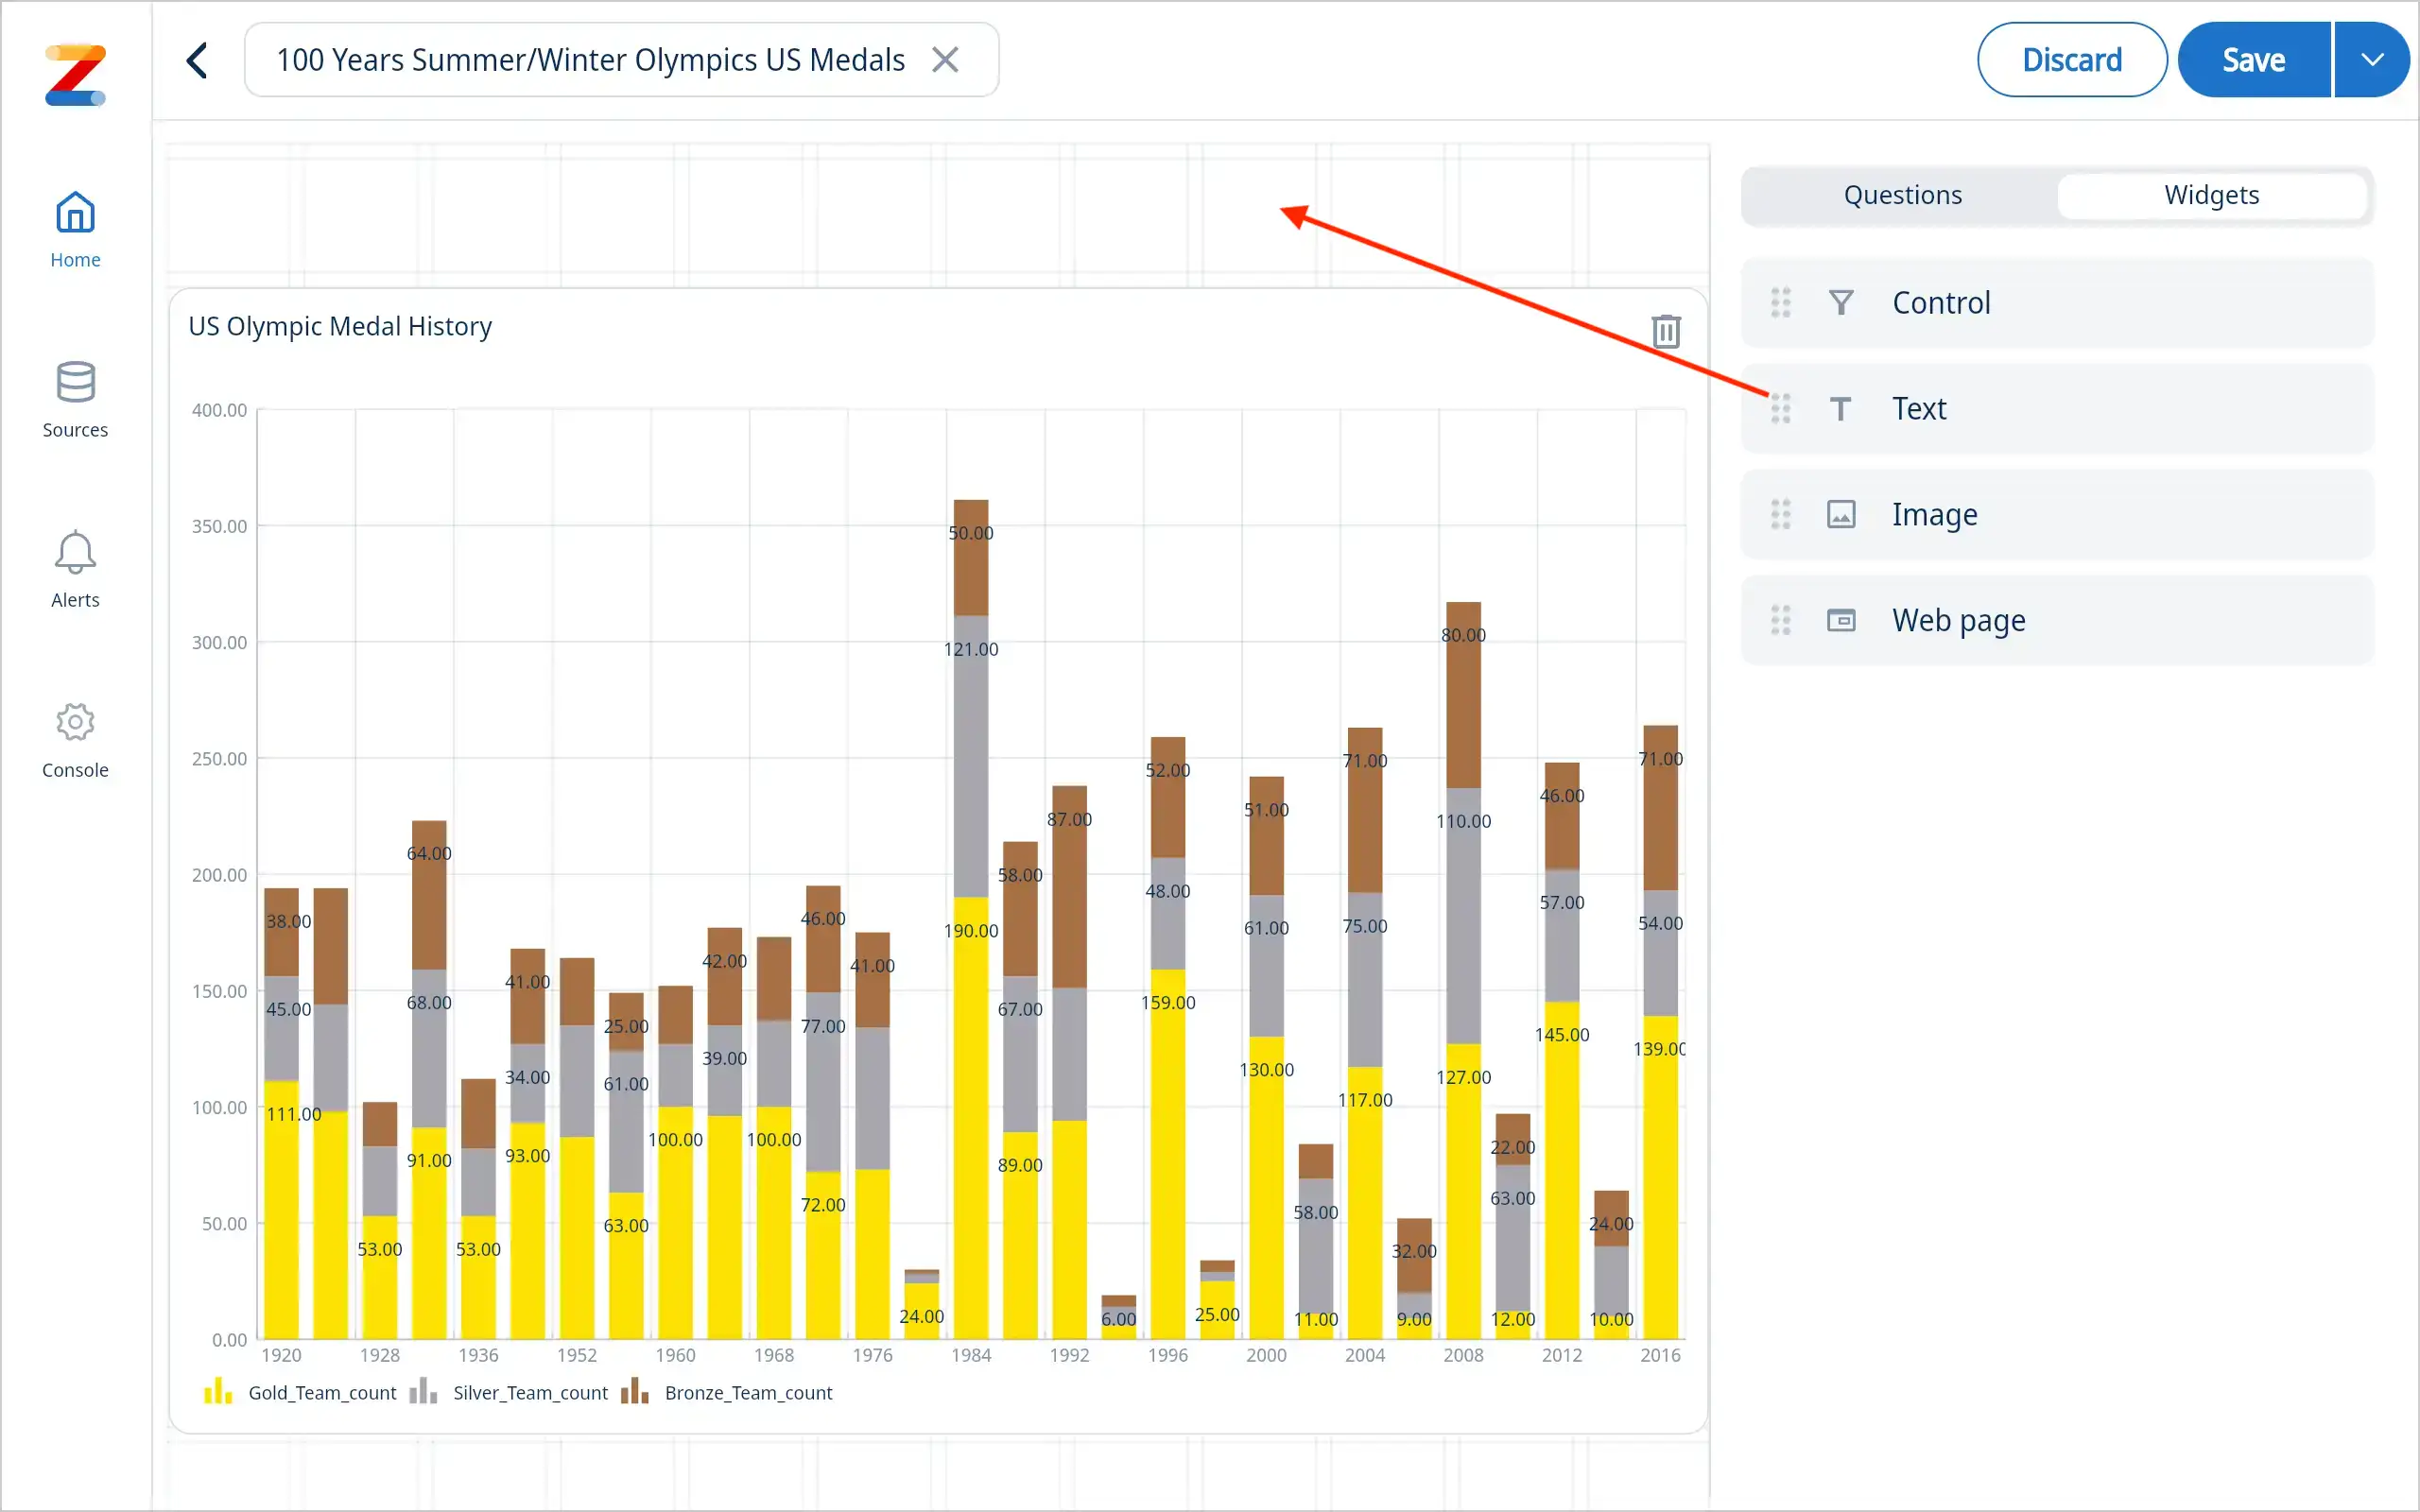
Add text: change font size, color, alignment and add links
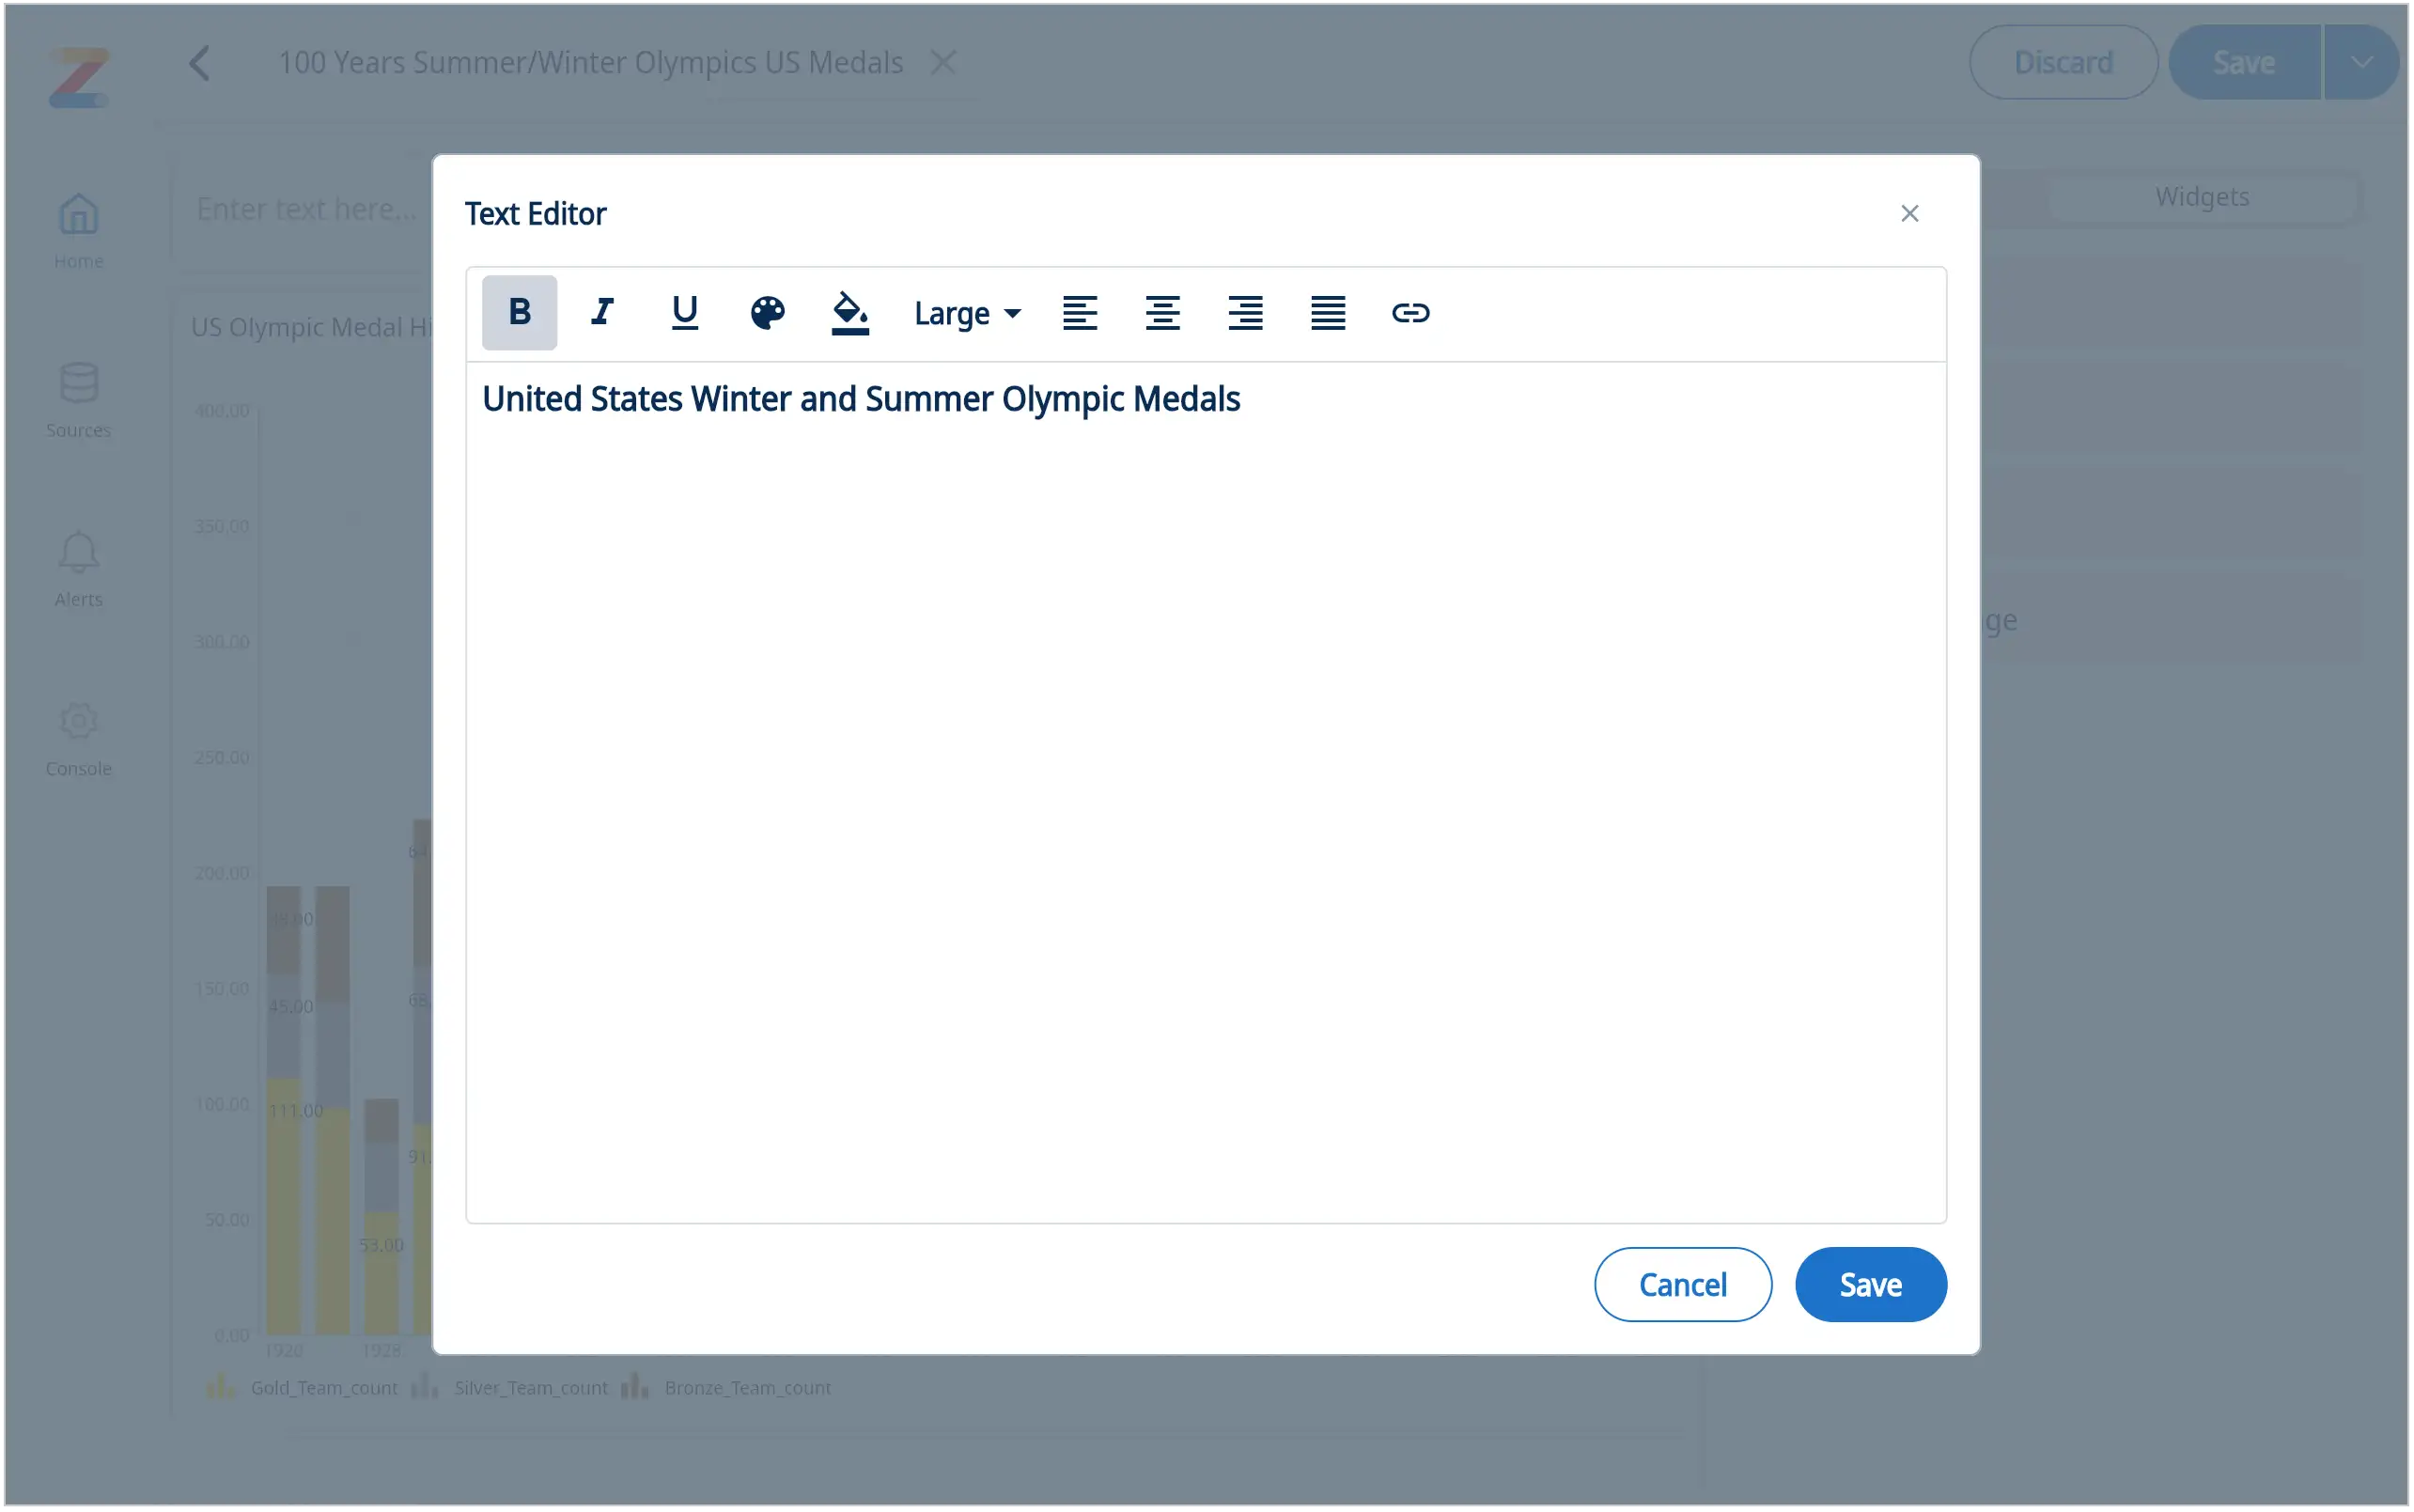
Add an image: resize and crop for the best fit
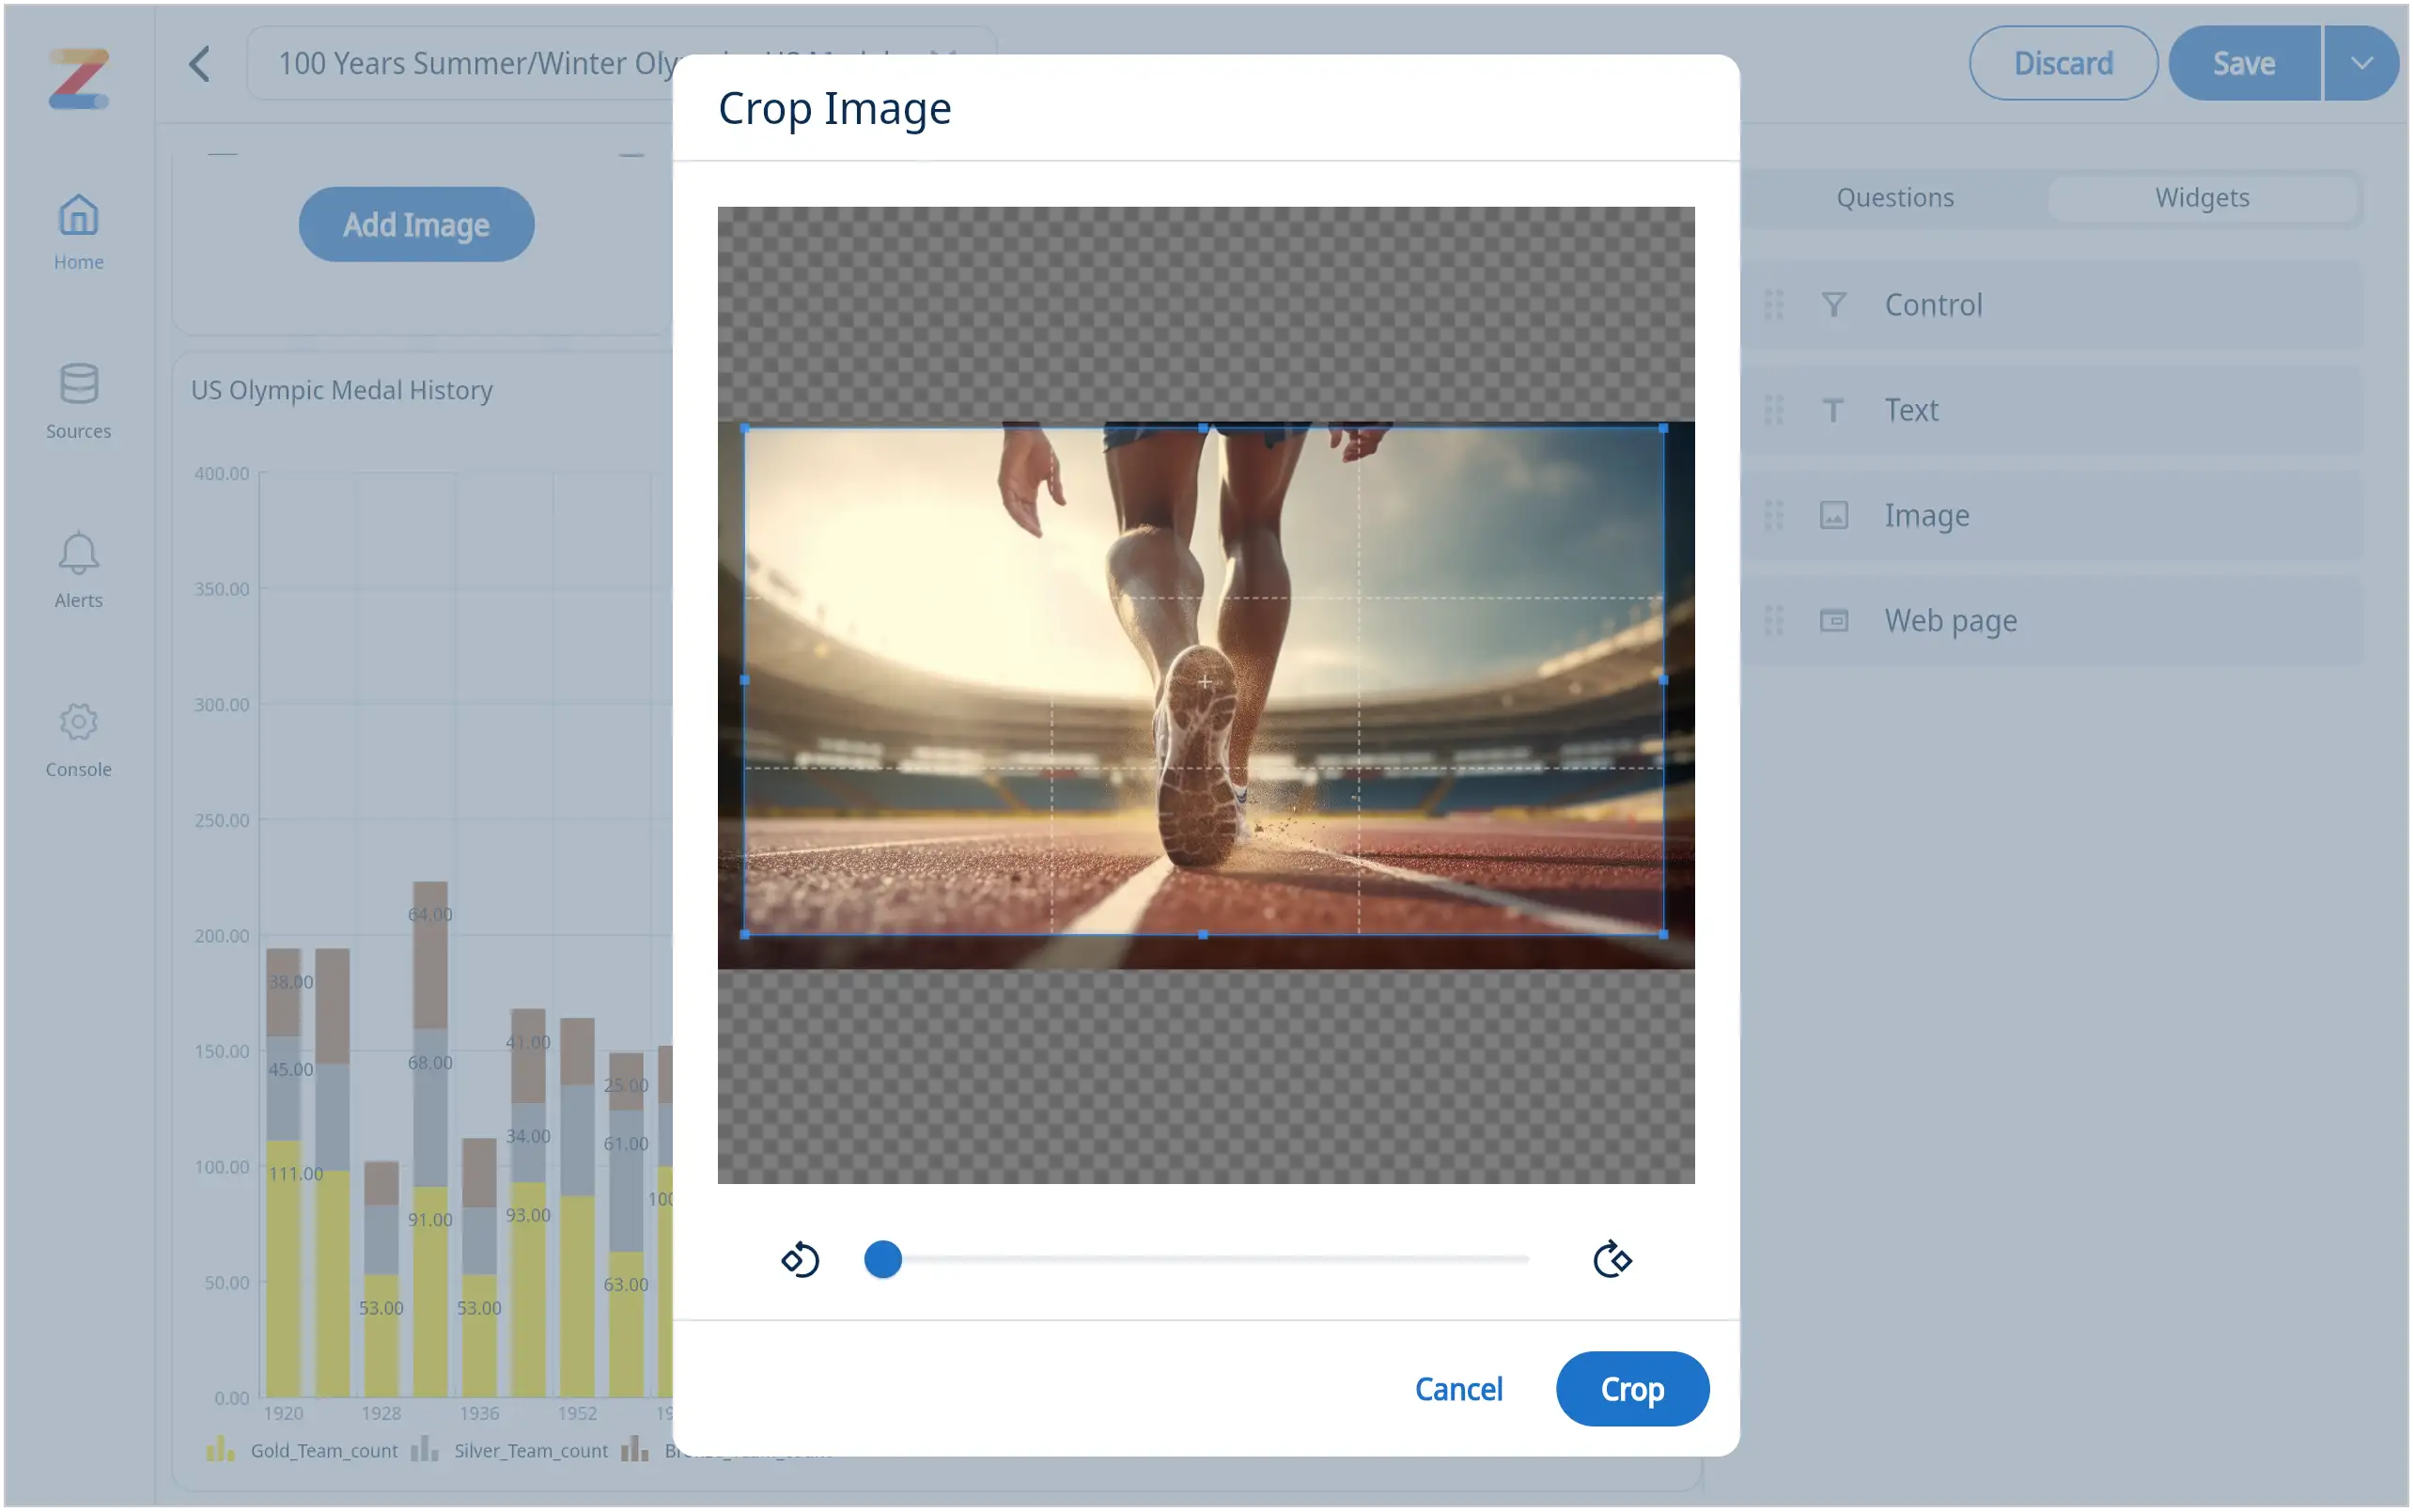
Add a web page
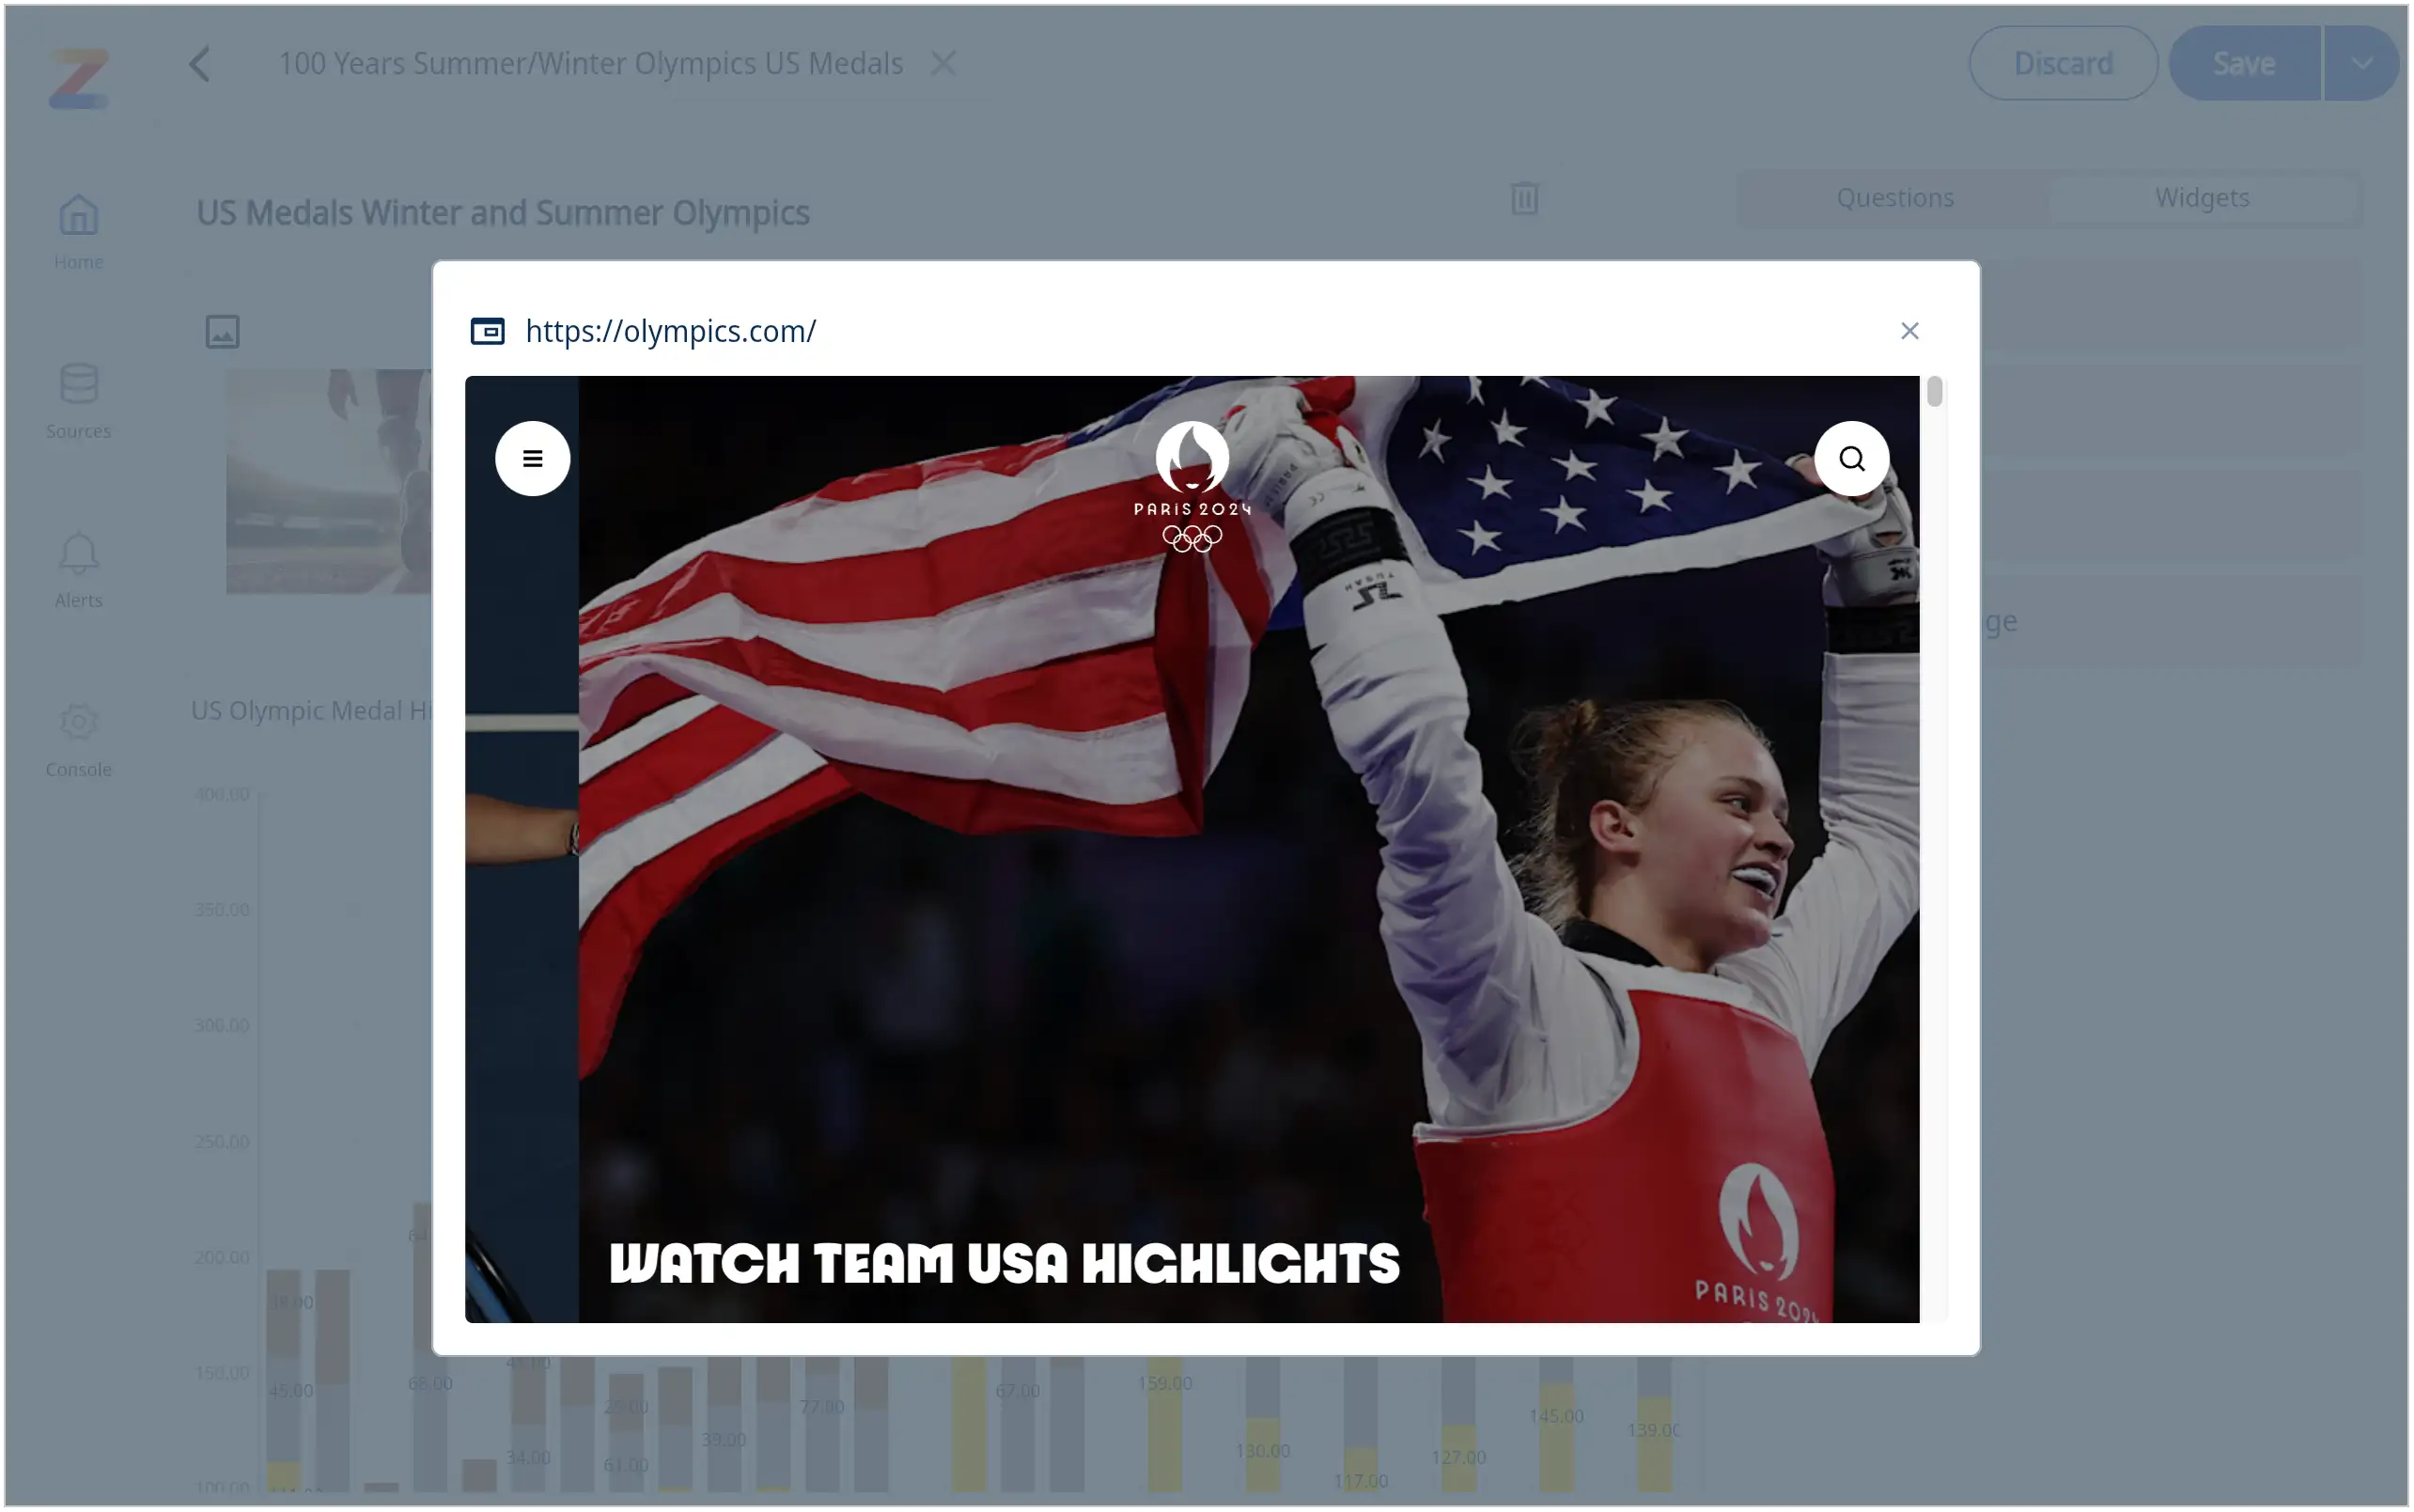
Here is a sports related dashboard example with custom text and images
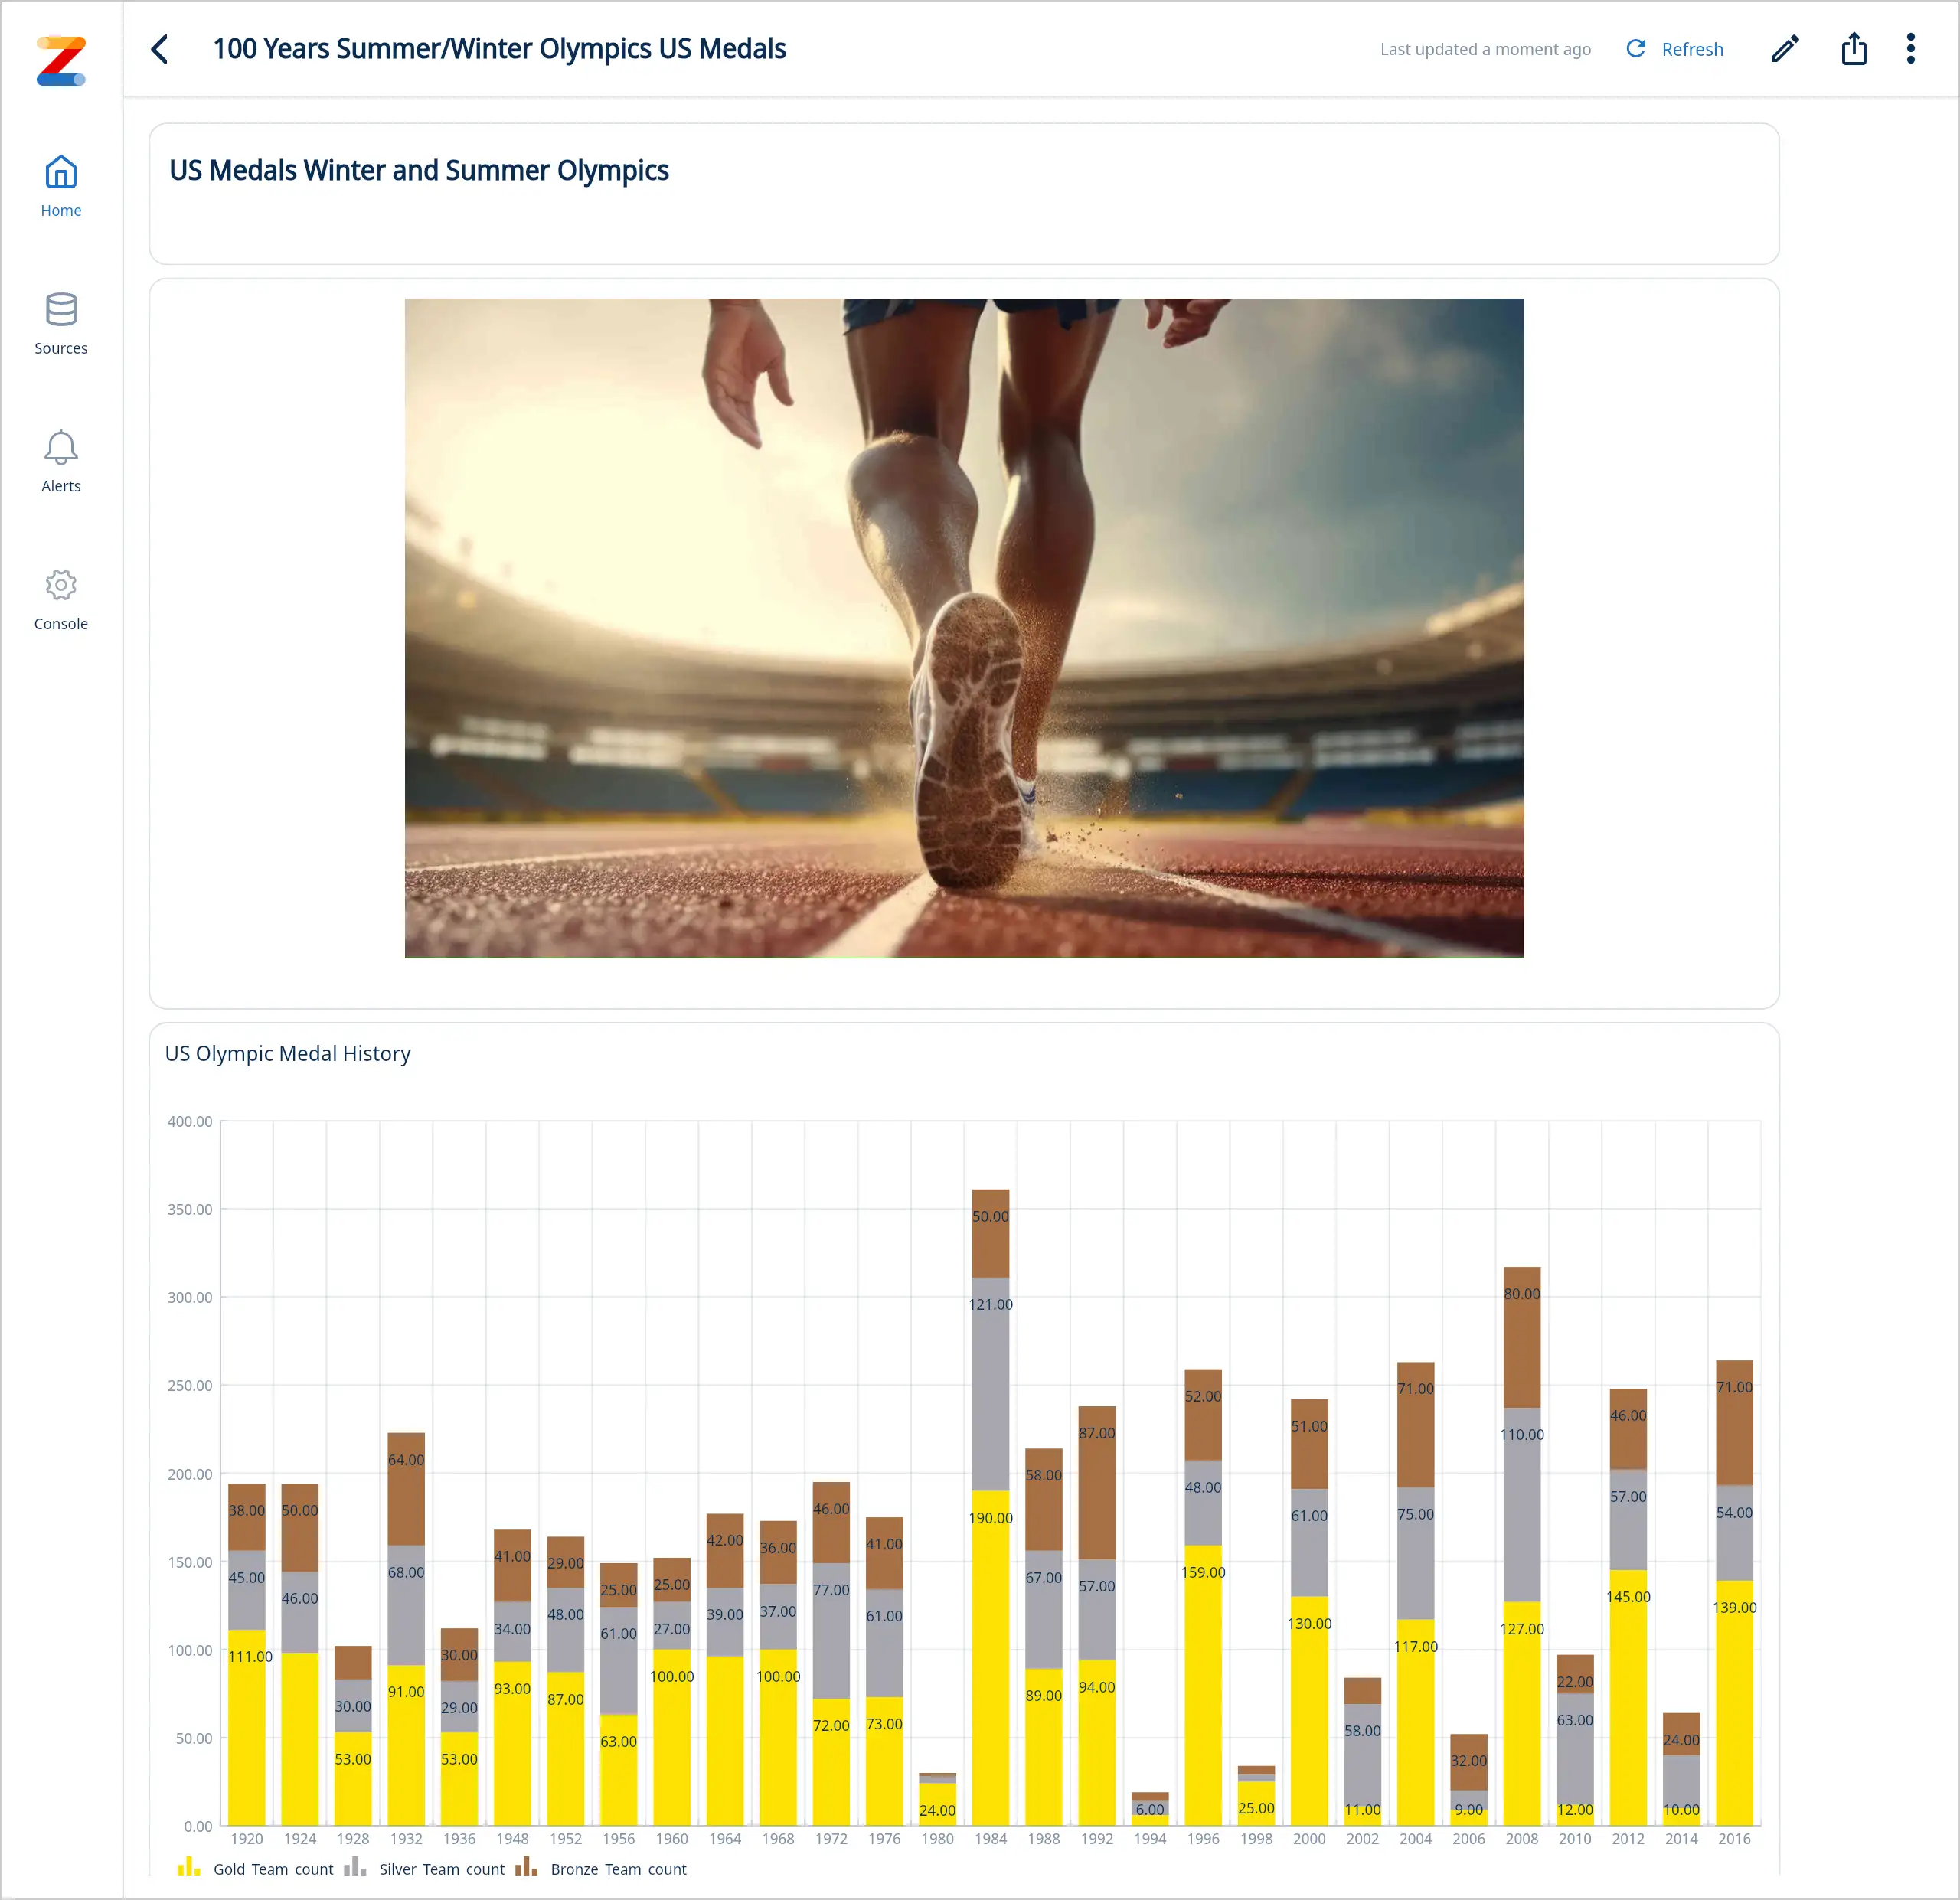
How to link dashboards
- Add a text widget to your dashboard
- In the text widget click Edit
- Enter single link or multiple links (you can link to multiple dashboards in one text box)
- Select link text and click on the link icon
- Select “Dashboard” radio button Select the desired dashboard from drop down menu
- Click “Ok”
- Click “Save” in the text editor window
Linked dashboard example
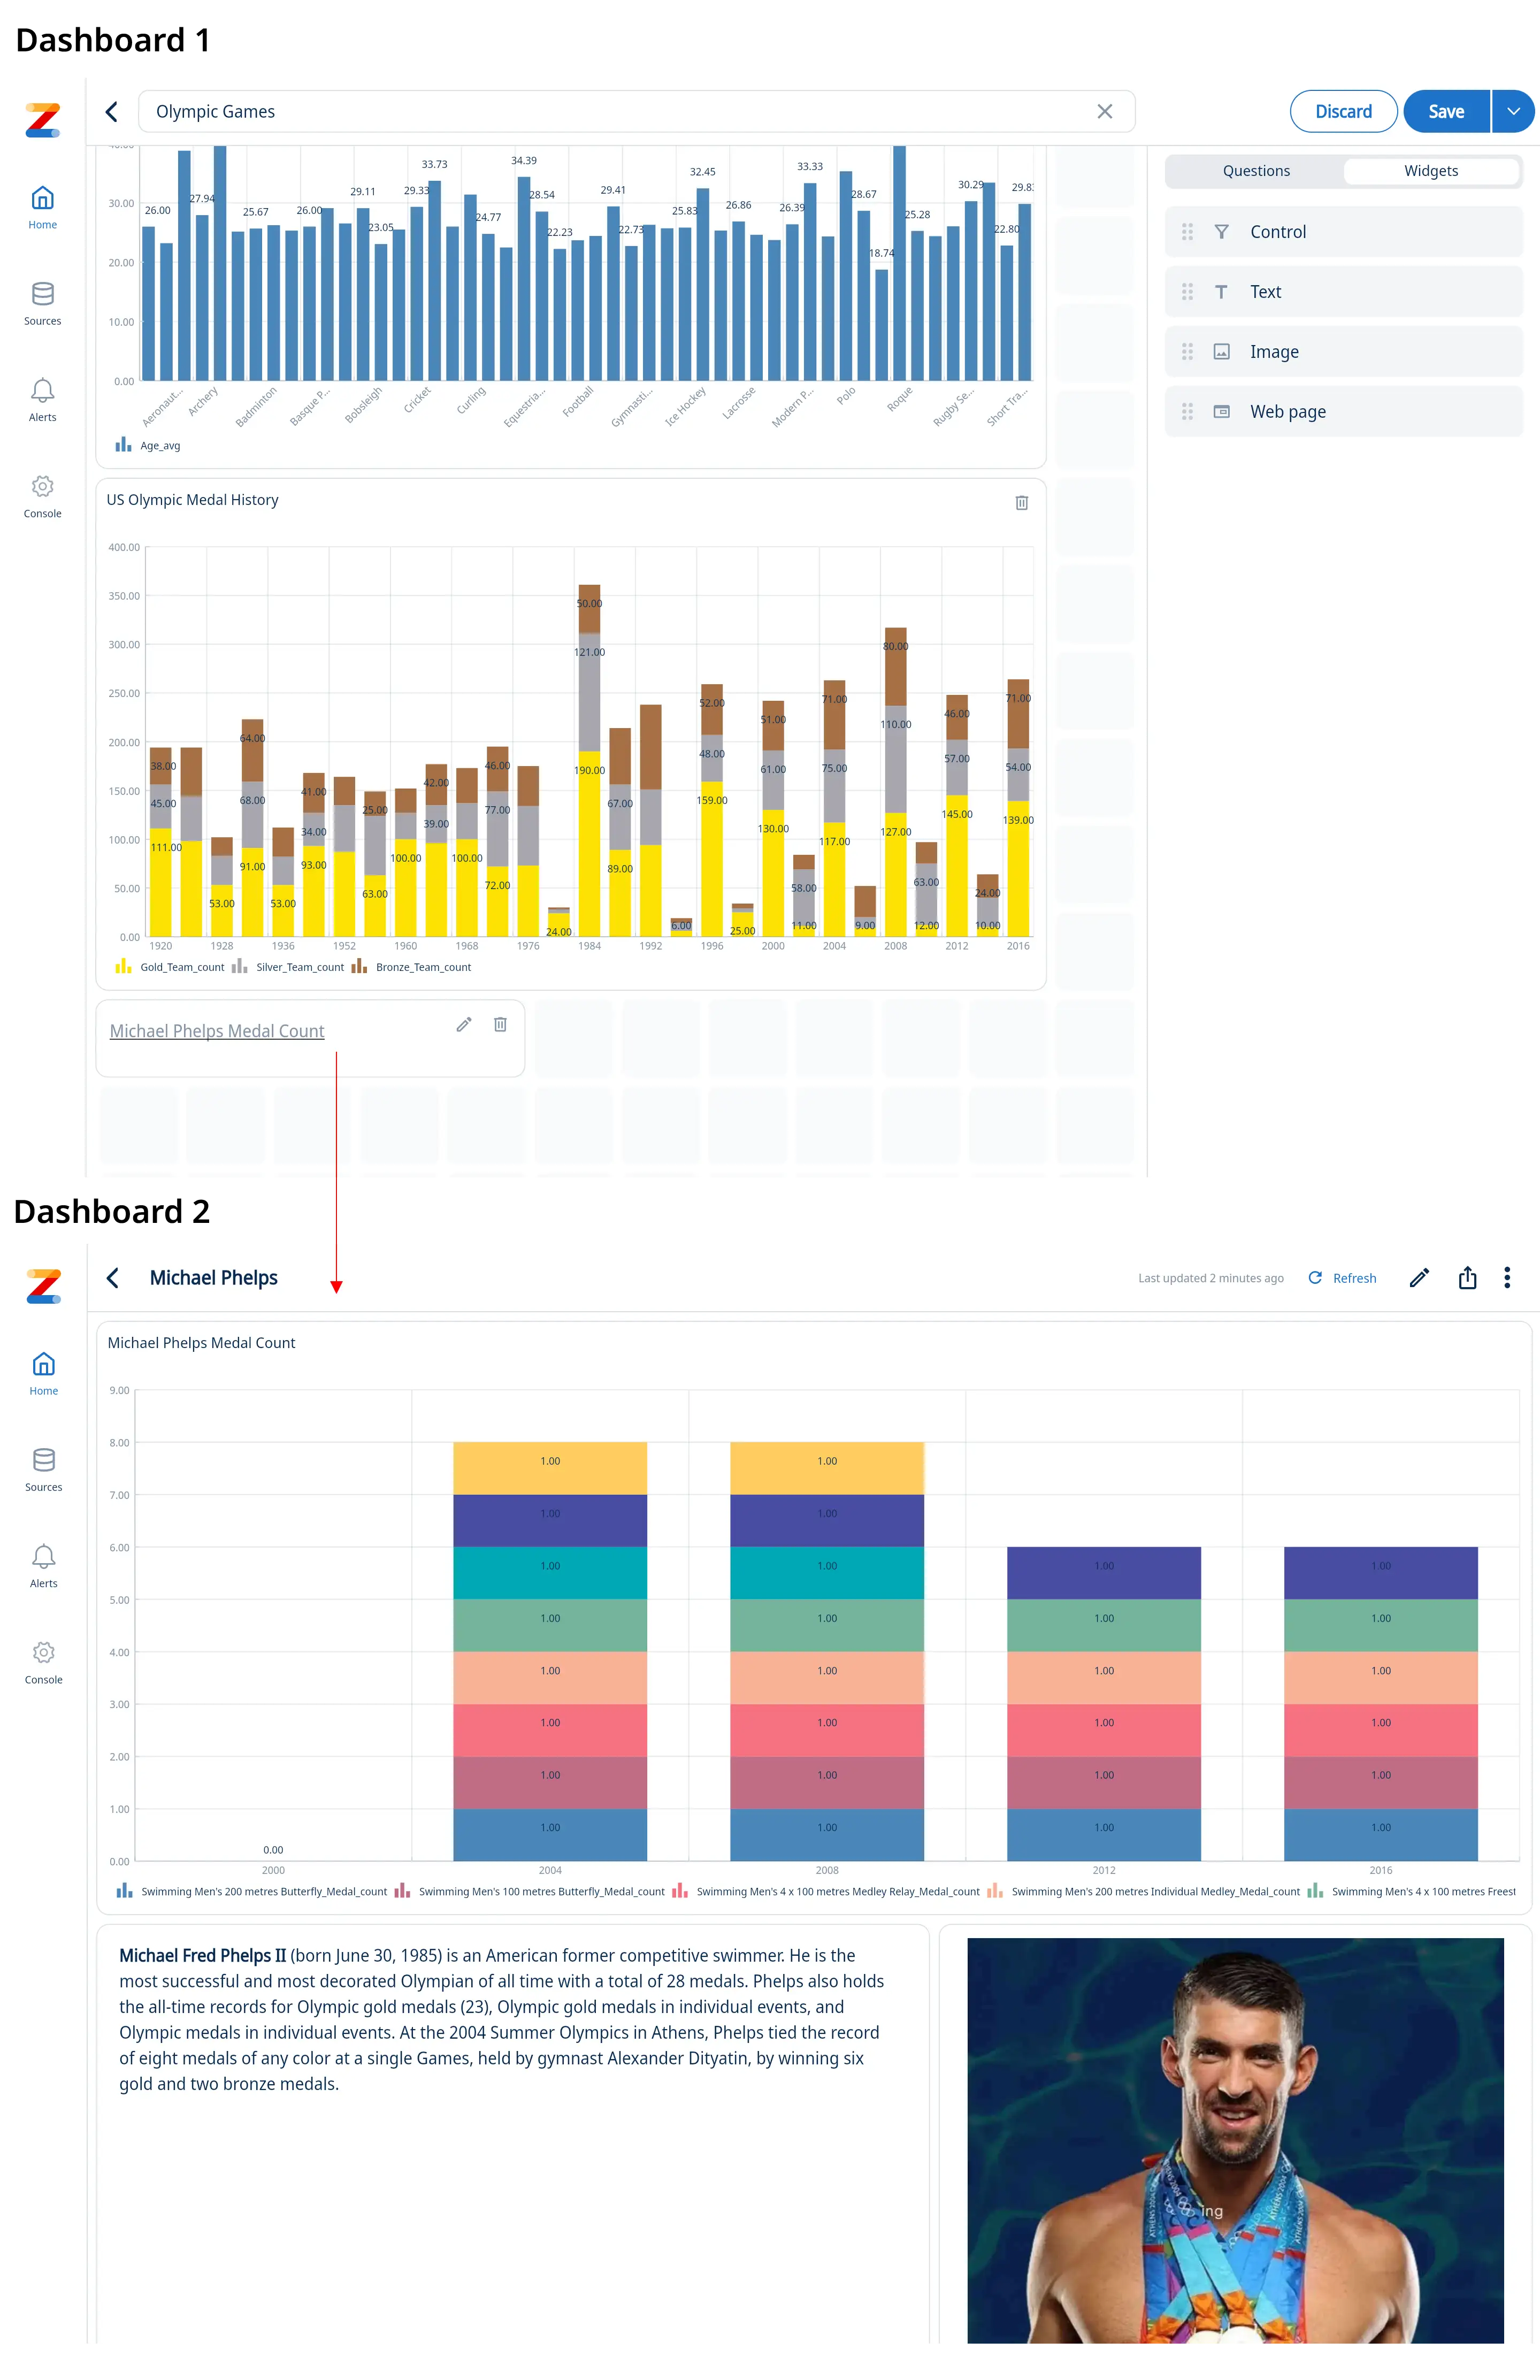
11 - Creating Alerts
Dynamic Alerts for Questions
Dynamic alerts notify you by push or email (or both) when new data comes in that that satisfies the criteria you set such as a percentage change or exceeding a threshold.
Alerts can be set up to check every minute, providing near real-time notifications, or as infrequently as once per month.
You can specify:
- Percentage changes (e.g. let me know when the number of visitors to my website changes more than 50% vs the previous day)
- Point changes (e.g. let me know when sales drops by more than $500 versus the previous day)
- Specific thresholds (e.g. let me know when inventory falls below 50 units for a fast-selling product)
- A time frequency (e.g. once every week)
To set up an alert
-
Tap on a graph and click the three dots on the top right of the screen. Select ‘Create new alert’.
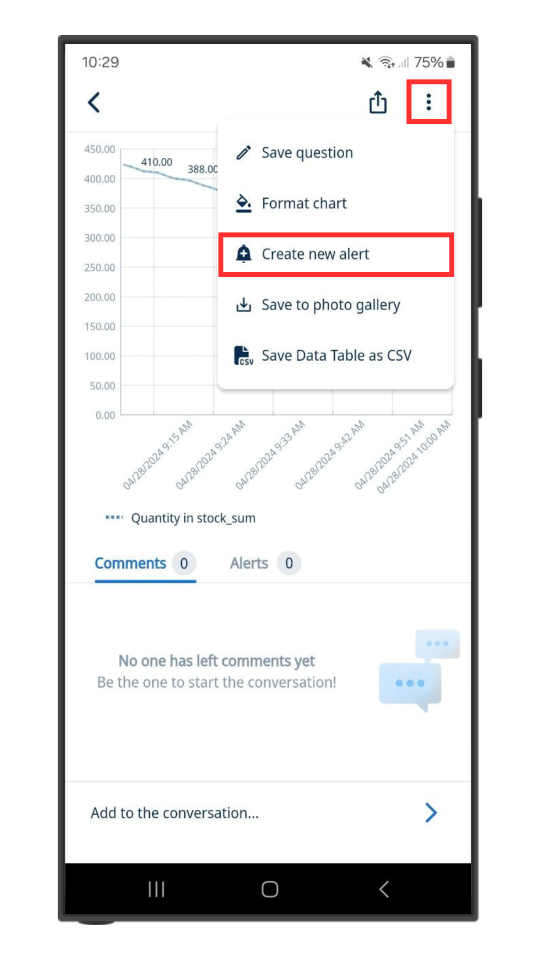
Alternatively, you can click on the ‘Alerts’ tab and tap ‘Create Alert’.
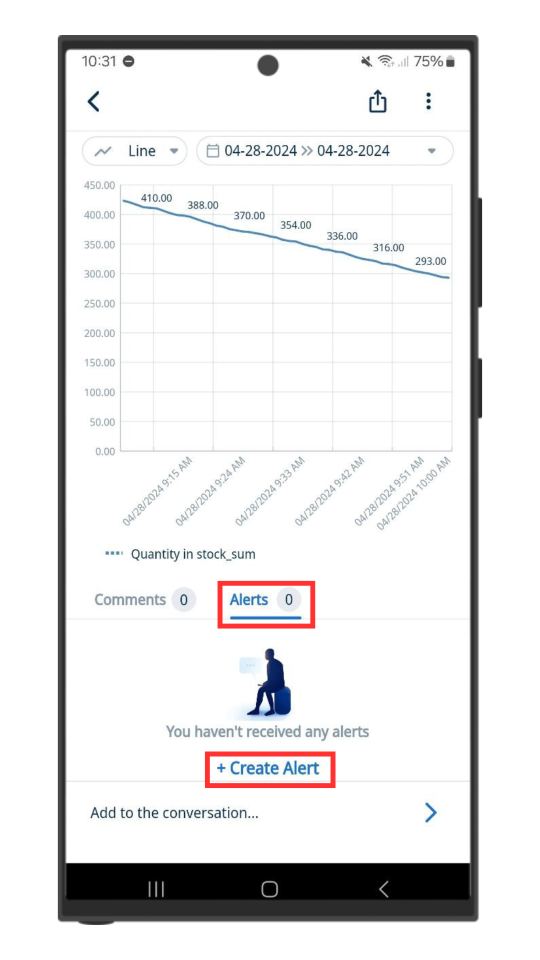
The third way you can do this is by tapping and holding a point on the graph. Select the ‘Create new alert’ button which pops up.
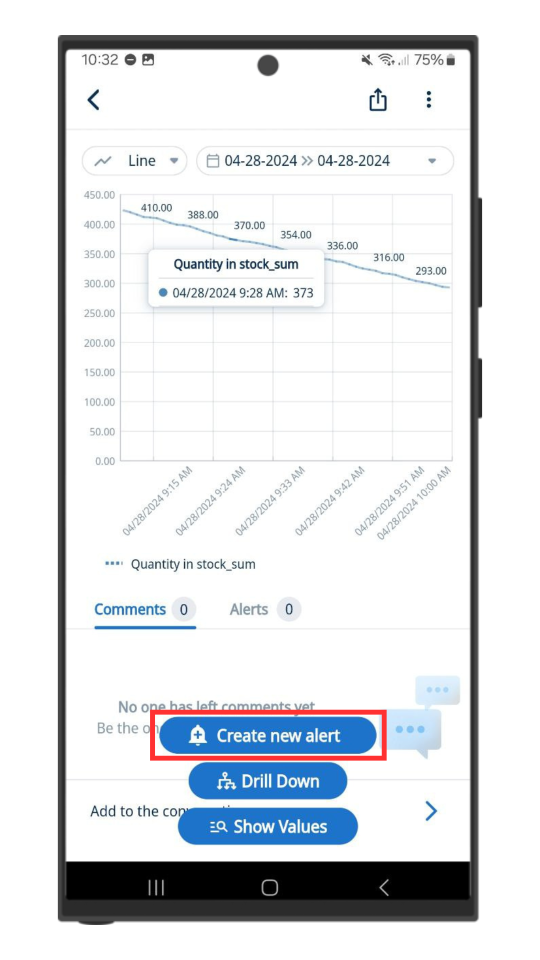
-
Choose the series you want to be alerted for (this is pre-populated for you based on what series you tapped on)
-
Choose the condition and amount:
-
Rises by is the percentage increase in the data you want to be notified about period to period, where period is defined as your x-axis granularity (e.g. day, hour, etc.). This calculated as a change relative to the previous period.
-
Drops by is the decrease increase in the data you want to be notified about period to period. This calculated as a change relative to the previous period.
-
Changes by is a percentage increase or decrease period to period. This calculated as a change relative to the previous period.
-
Is Above is a fixed number, and and you will be alerted when new data that is greater than or equal to that number
-
Is Below is a is a fixed number, and and you will be alerted when new data that is less than or equal to that number
-
-
Choose a notification type:
- Push Notifications
Note that you must enable push notifications for Zing for this to work. You can check if notifications are turned on in the settings tab. Push notifications are supported for iOS and Android, but not from the web interface. - Both
- Push Notifications
-
Choose an update frequency. This is how frequently Zing will check the dataset for new values against the alert conditions you’ve set. By default, Zing sets update frequency to match your x-axis granularity (e.g. minute / hour / day ), but you can change this.
Update frequency can be as frequent as once per minute, or as infrequently as once per month - just select what you’d like from the drop-down.
Note that a paid plan is required for alerts with frequency that is less than a day. -
Choose the recipients. By default a notification goes only to you as the creator of it, but you can specify multiple recipients if you’d like.
Note that if you’ve added row level security or row level filters, those filters are evaluated for each recipient so each user will get the results specific to their filters. -
Tap ‘Save’
Scheduled Alerts for Questions
In addition to dynamic alerts triggered by data changes, you can now configure scheduled alerts—alerts that run at a fixed time regardless of whether the underlying data changed.
- Scheduled alerts on questions allow you to receive recurring updates on key metrics, even if no data changes have occurred. For example, get a daily email with current revenue, inventory, or traffic numbers.
iOS Demo
Web App Demo
Scheduled alerts are especially useful for team reporting or routine check-ins, such as daily sales rollups or weekly operational metrics.
To create a scheduled alert:
-
Tap the three-dot menu at the top right
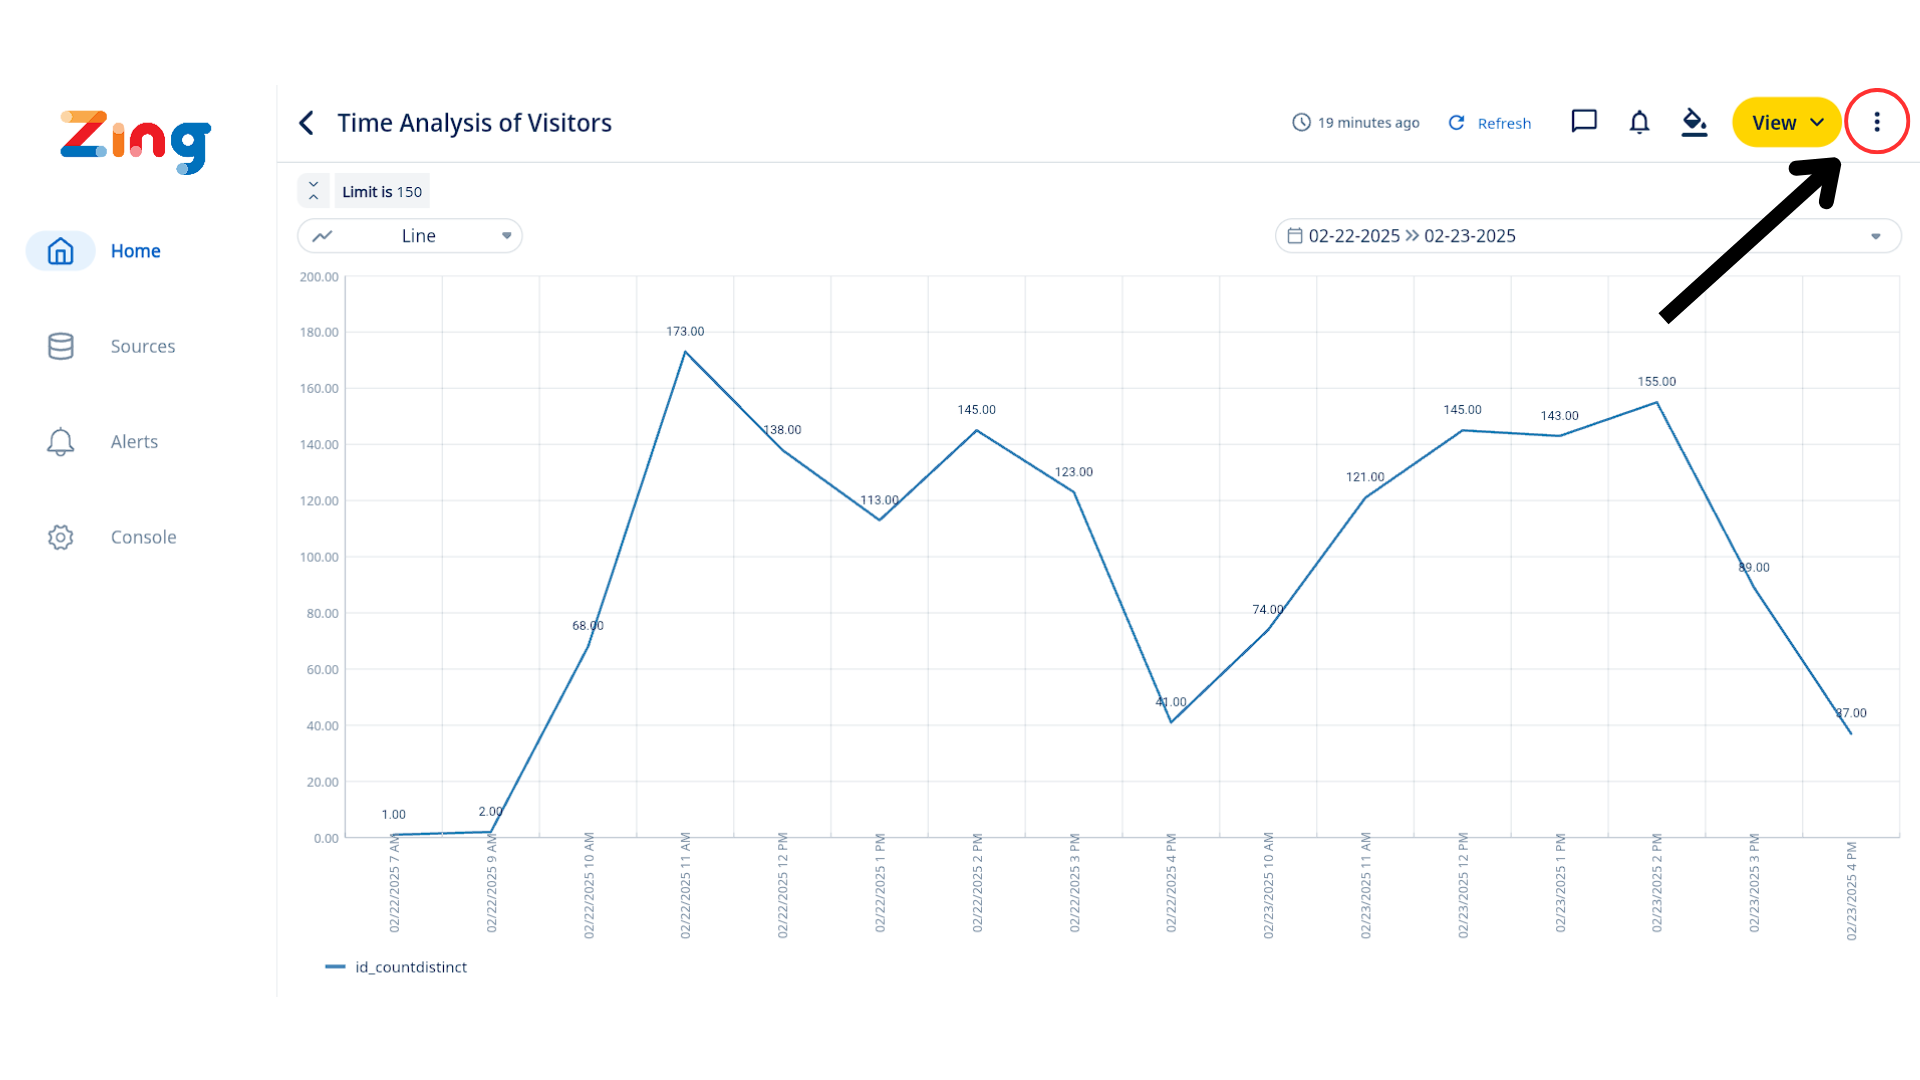
-
Under the dropdown menu, select “Create New Alert”
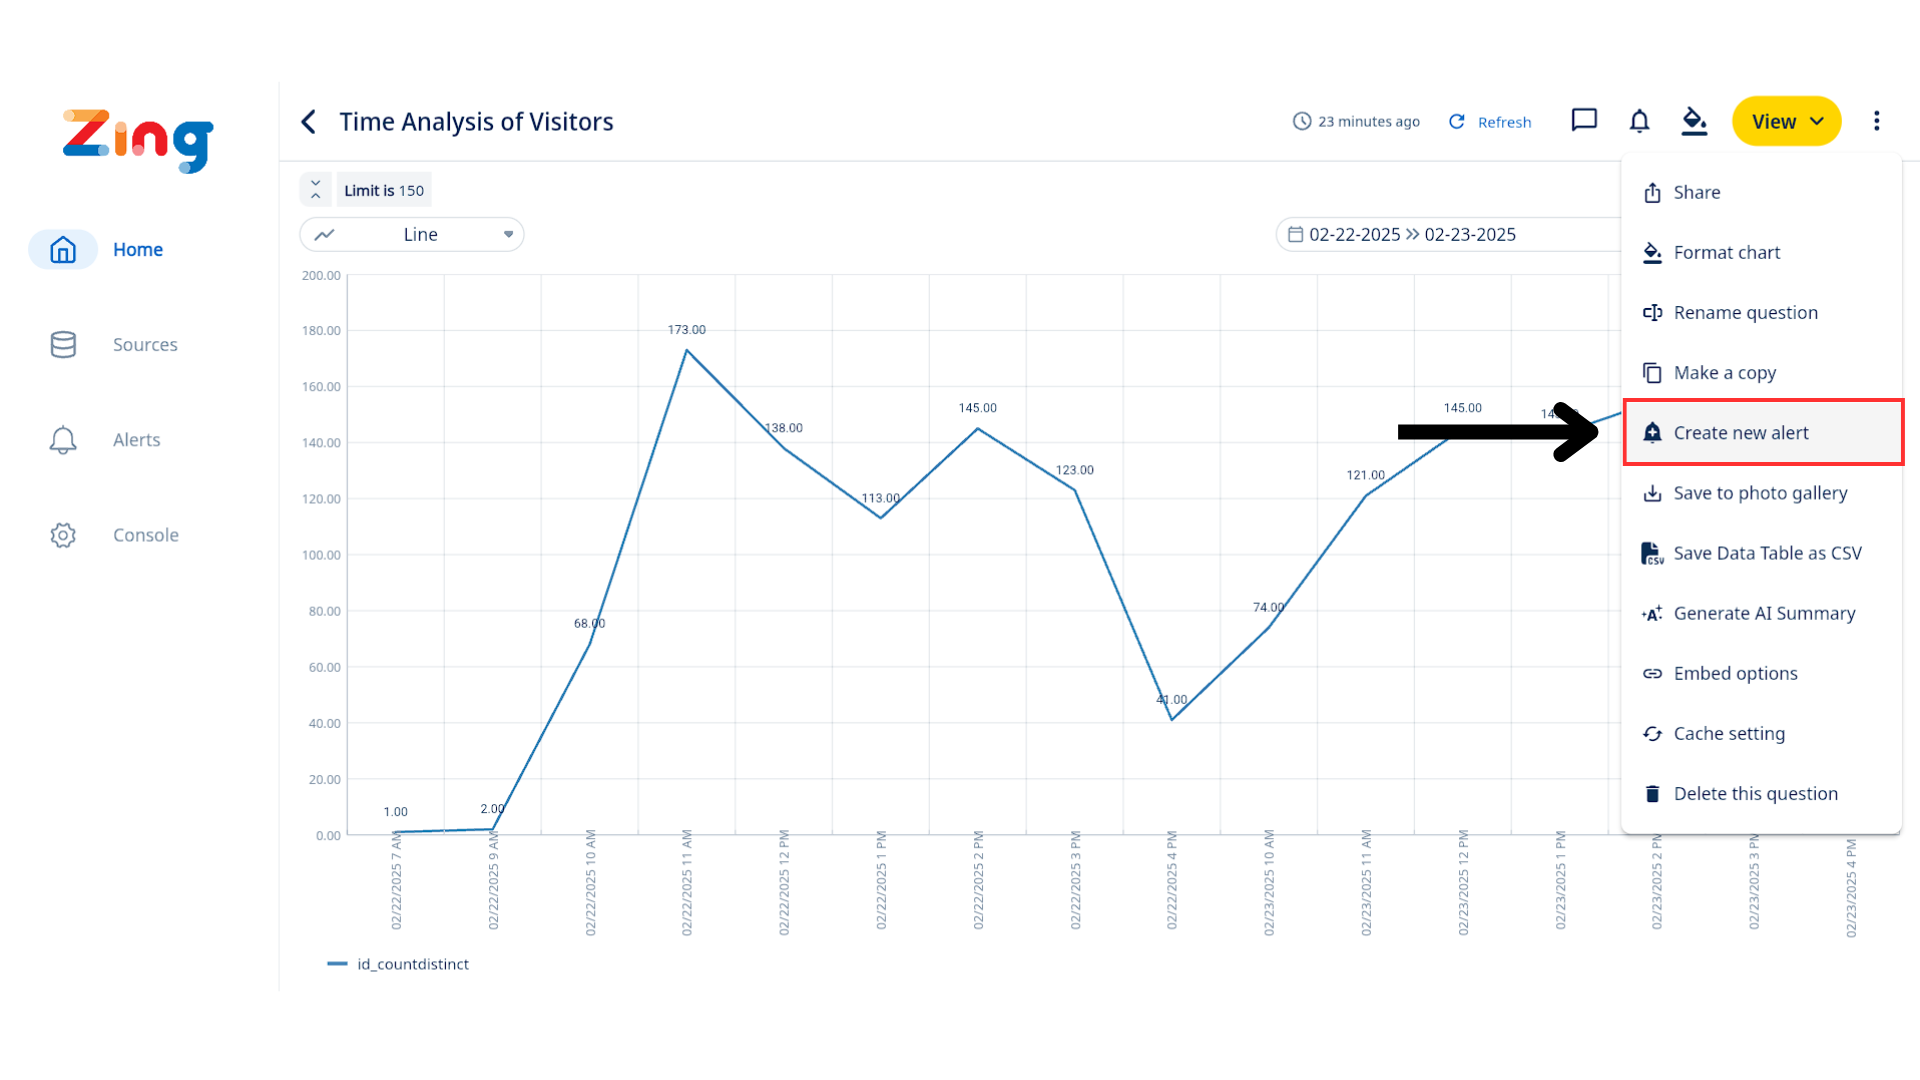
-
In the “Trigger” option, select “Schedule”
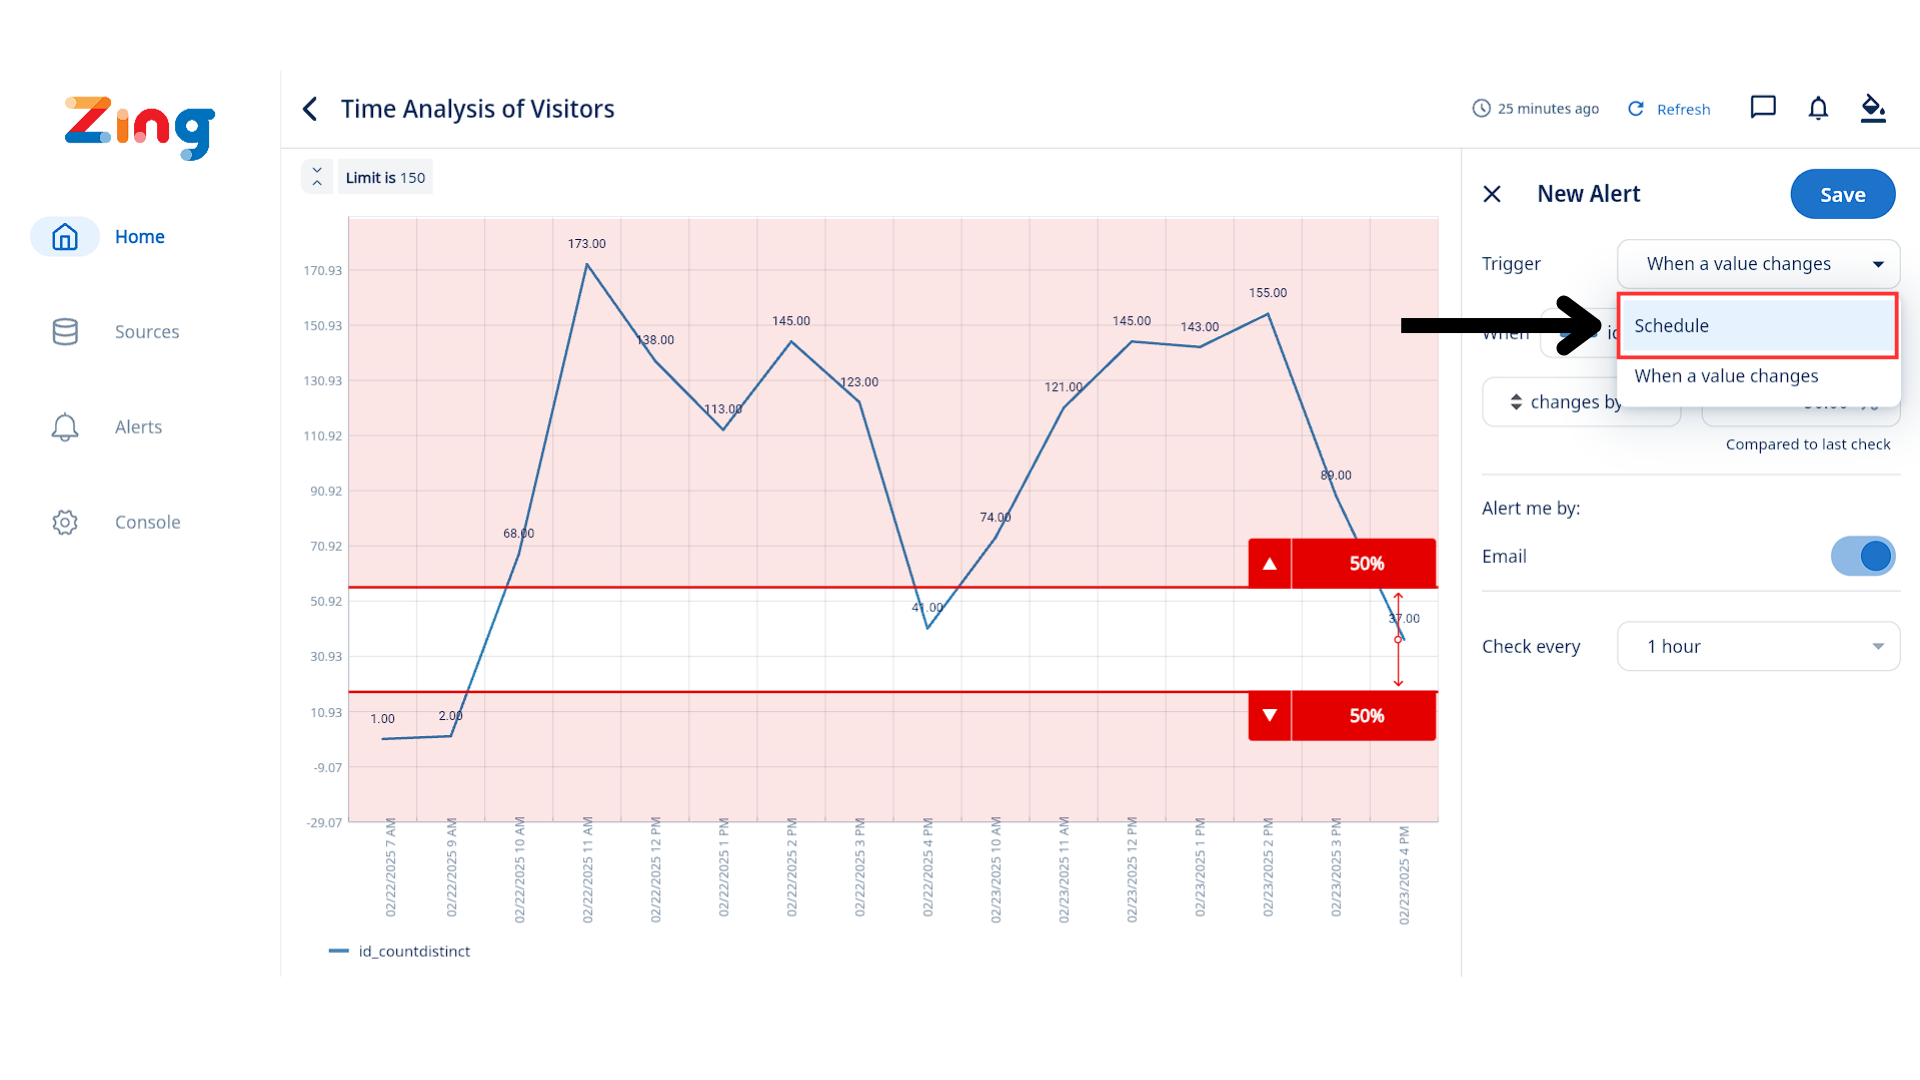
-
Choose the delivery time (e.g. 8:00 AM every weekday).
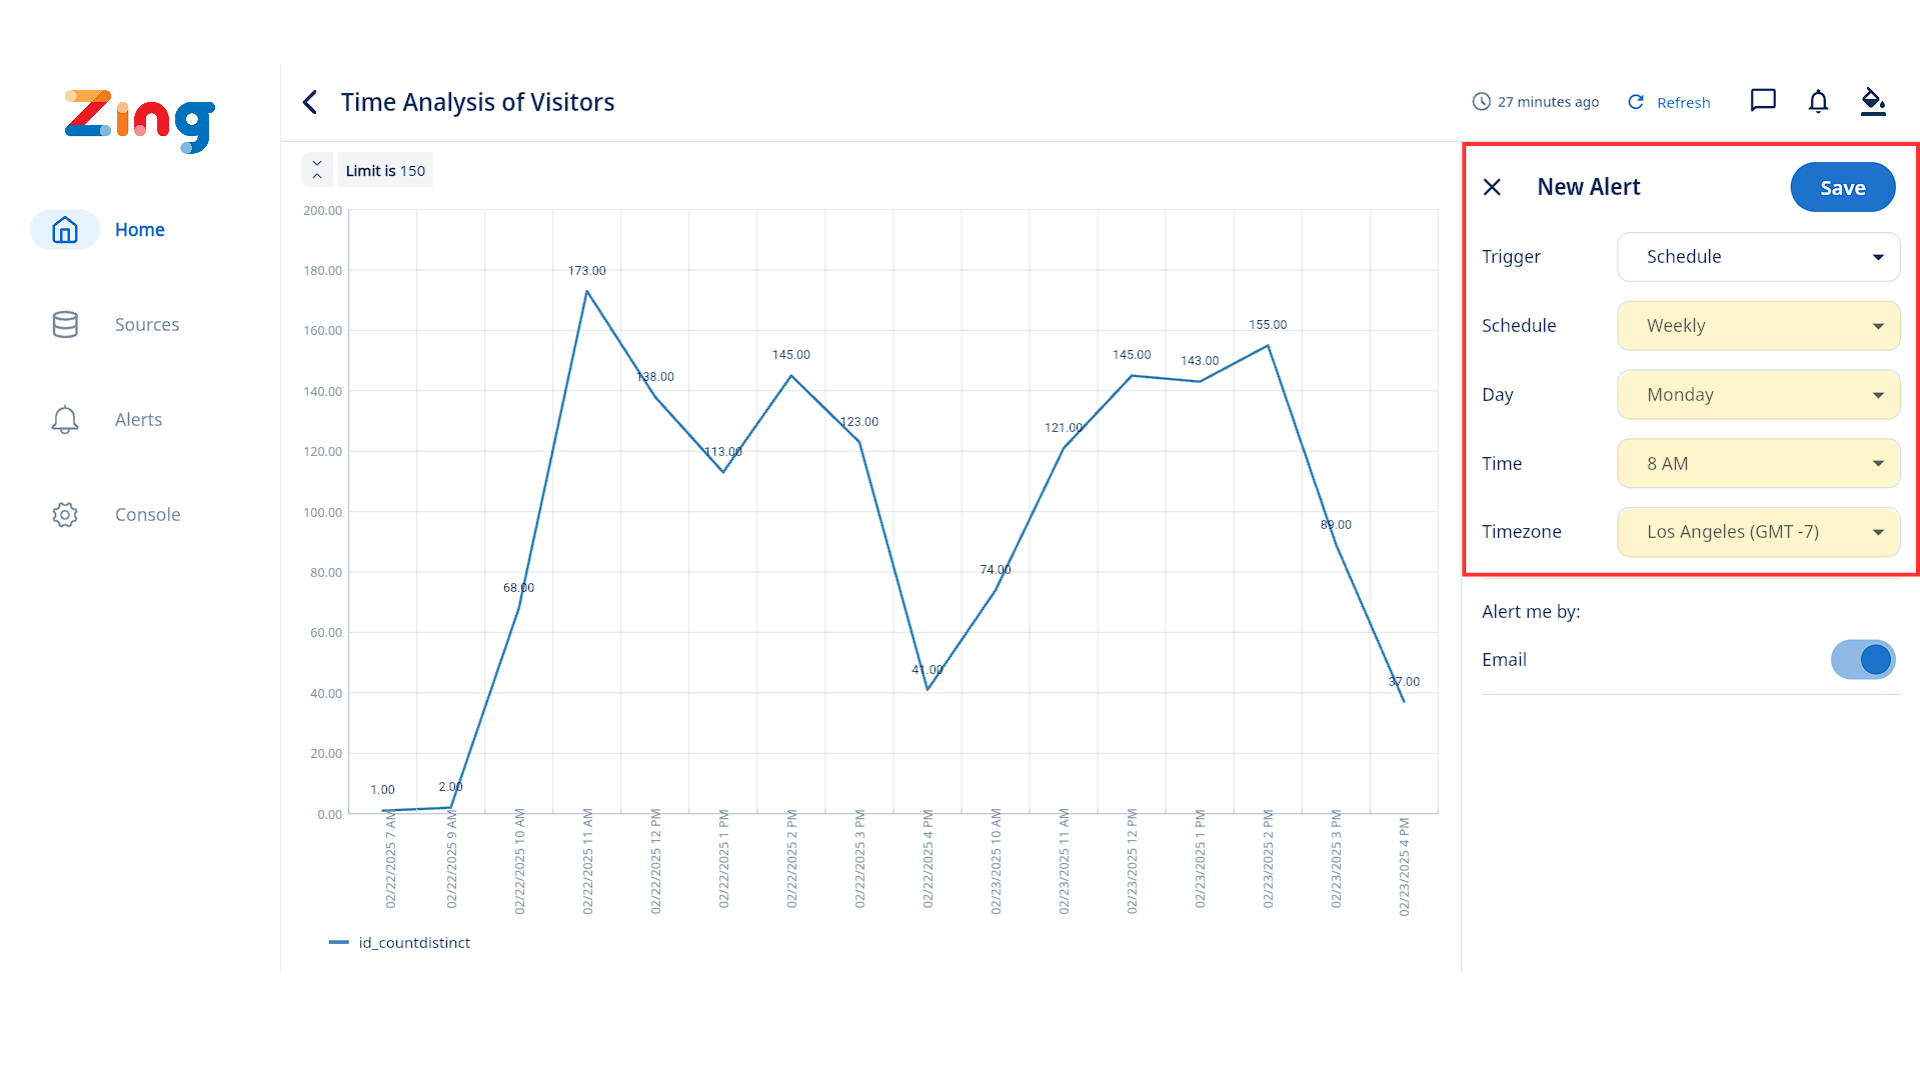
-
Choose the suitable delivery method (Notification & Email).
Email Options: If “Email” is selected as an alert method, new toggles will be visible under “Email options”:
- “Include image”:
- Default State: Off
- Action: Toggling this ON will instruct the system to generate and attach a snapshot of the relevant chart to the alert email.
- “Include CSV”:
- Default State: Off
- Action: Toggling this ON will instruct the system to generate and attach a CSV file of the data associated with the alert to the email.
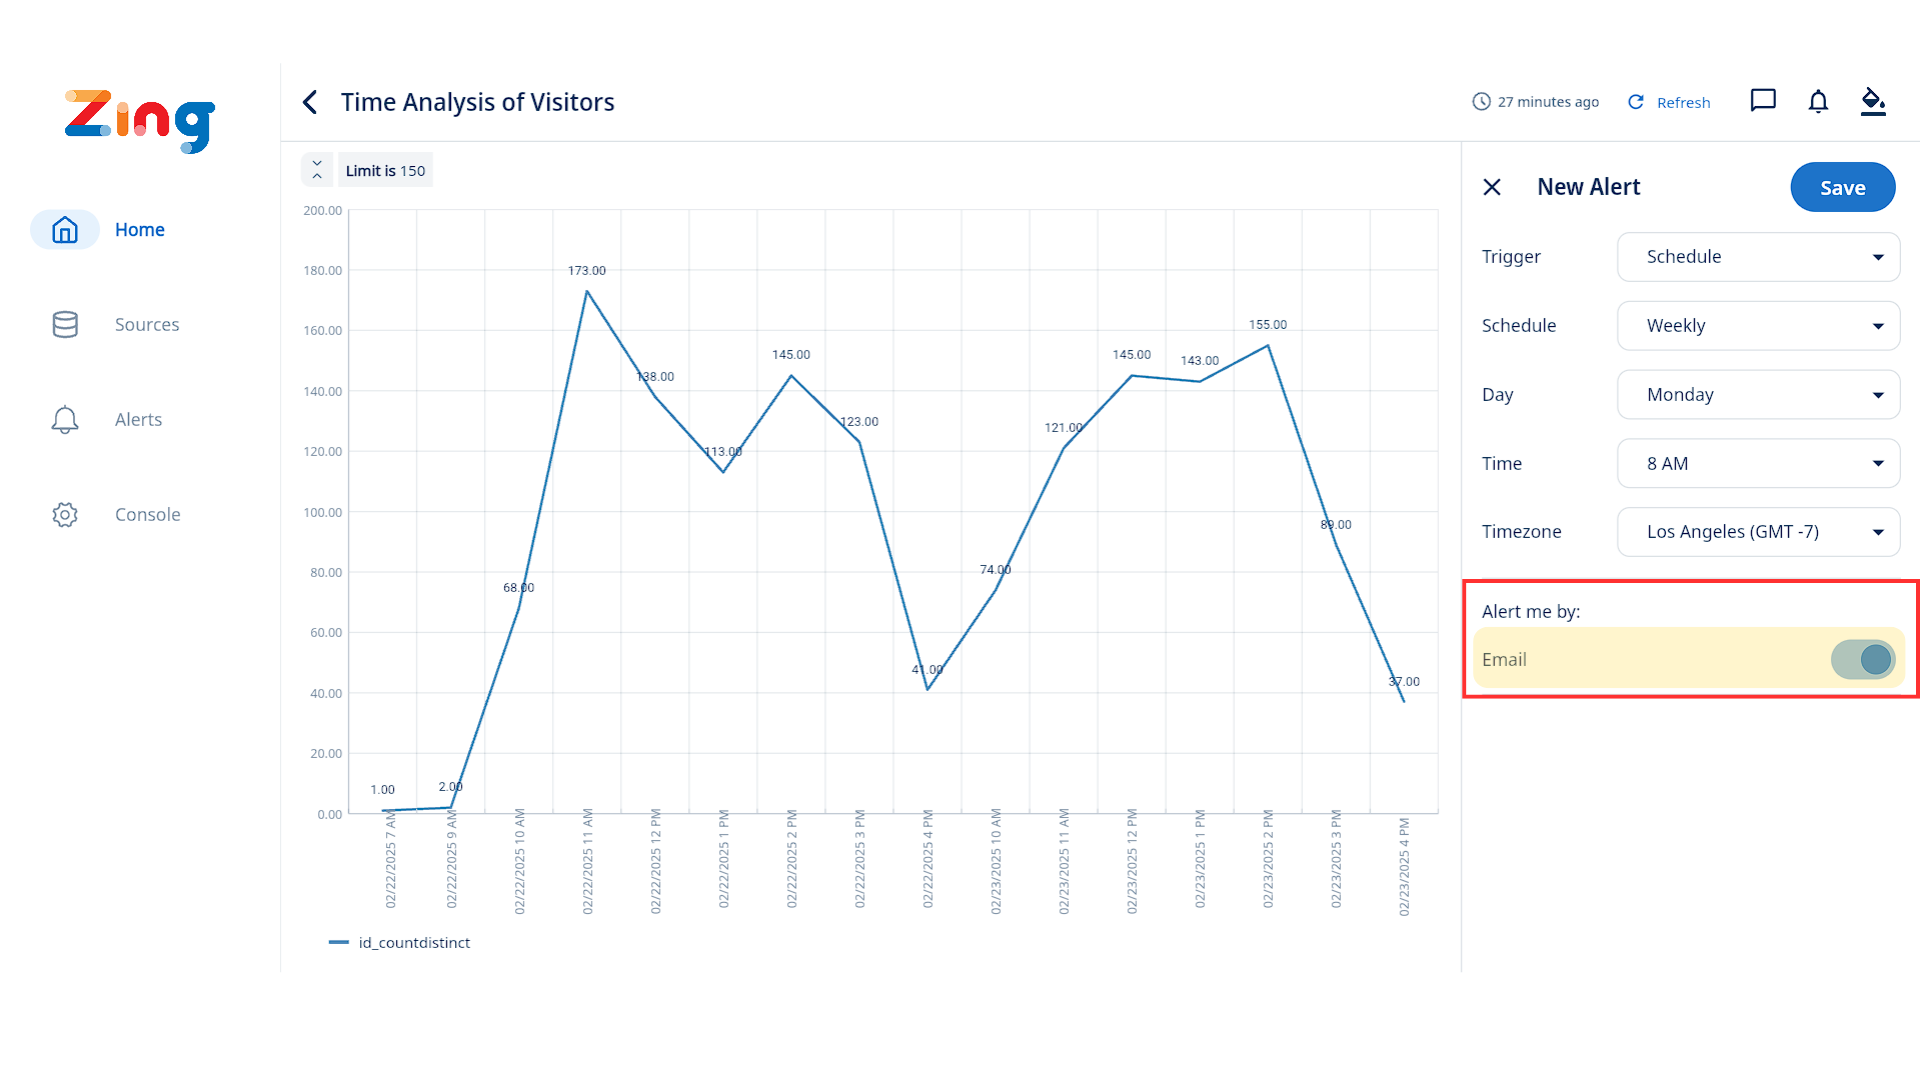
- “Include image”:
-
Tap Save.
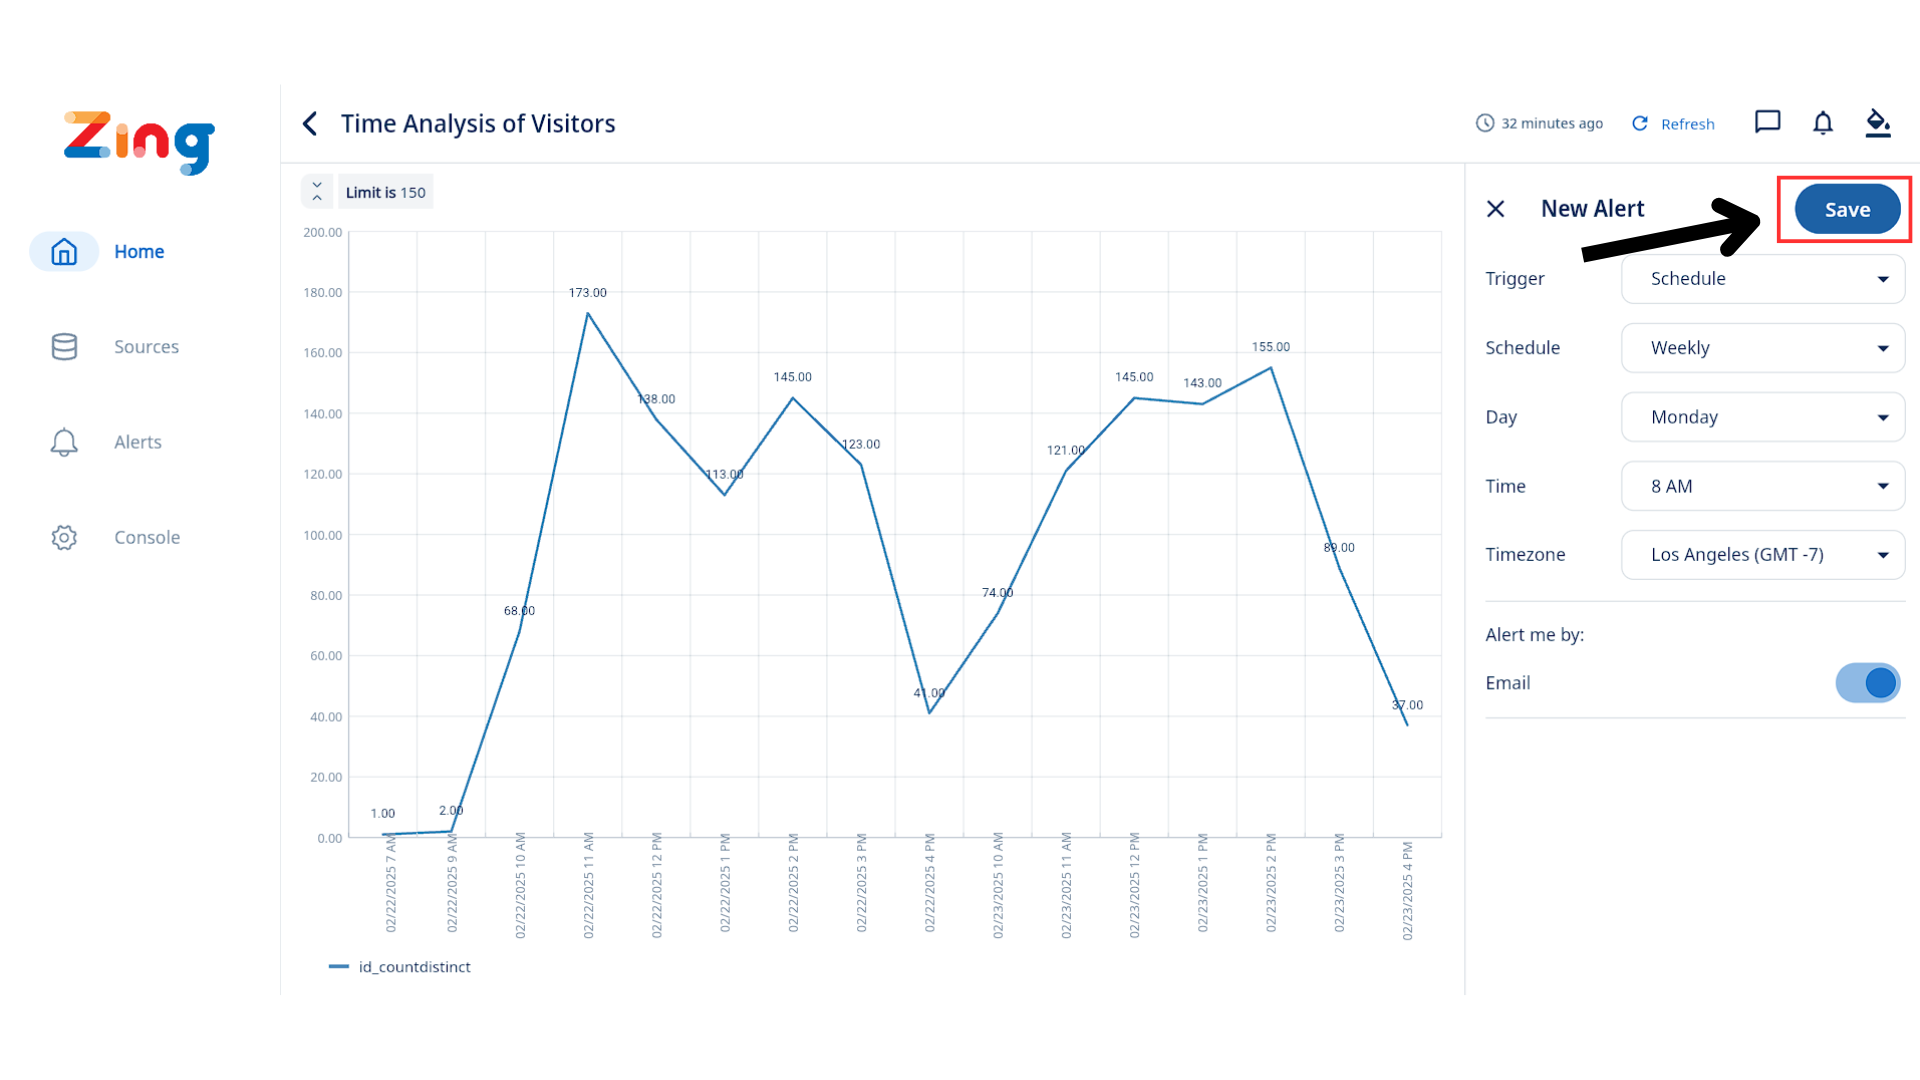
Scheduled alerts complement dynamic alerts and can be used in parallel. Multiple alerts can be set per question and users can create personal alerts. You’ll see a visual overlay on the graph for alert thresholds, which can be dragged or edited manually.
All configured alerts appear beneath the graph. Recently triggered alerts are listed in the ‘Alerts’ tab.
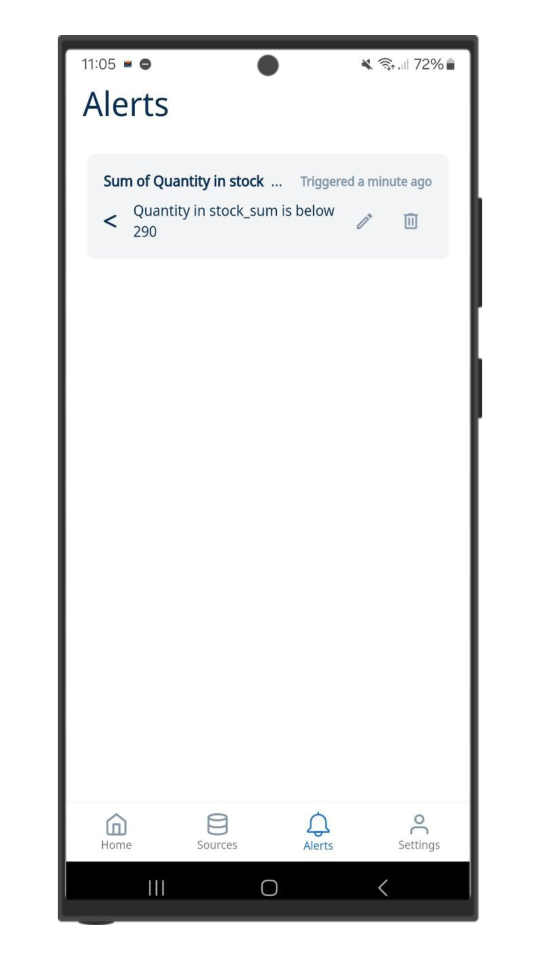
Important: Alerts—both scheduled and dynamic—are only supported on time series questions, which require a date or timestamp on the x-axis.
Alerts for Dashboards
Scheduled alerts on dashboards allow you to send a snapshot of the entire dashboard to yourself or your team at a scheduled time. This is helpful for regular team updates, exec briefings, or performance monitoring.
iOS Demo
Web App Demo
How to create a scheduled alert on a dashboard:
-
Go to a dashboard.
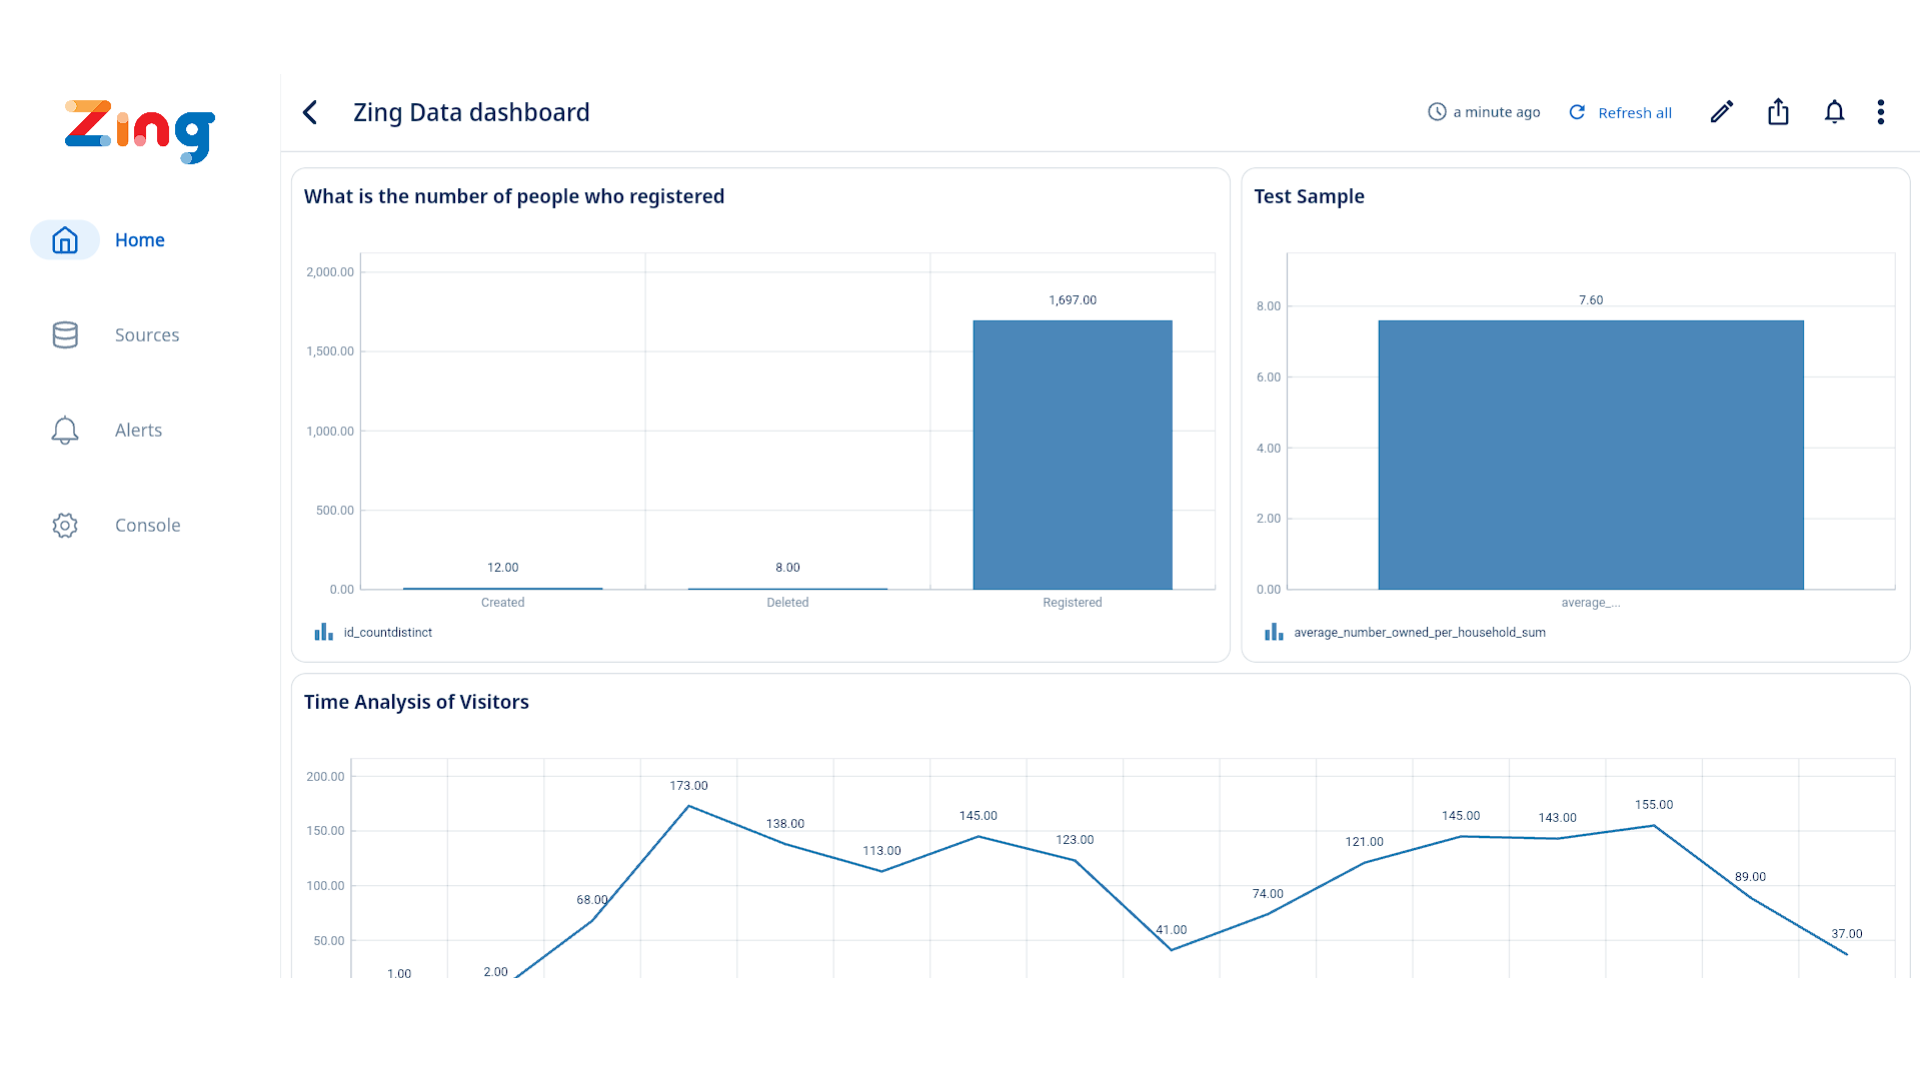
-
Tap the Bell Icon at the top right
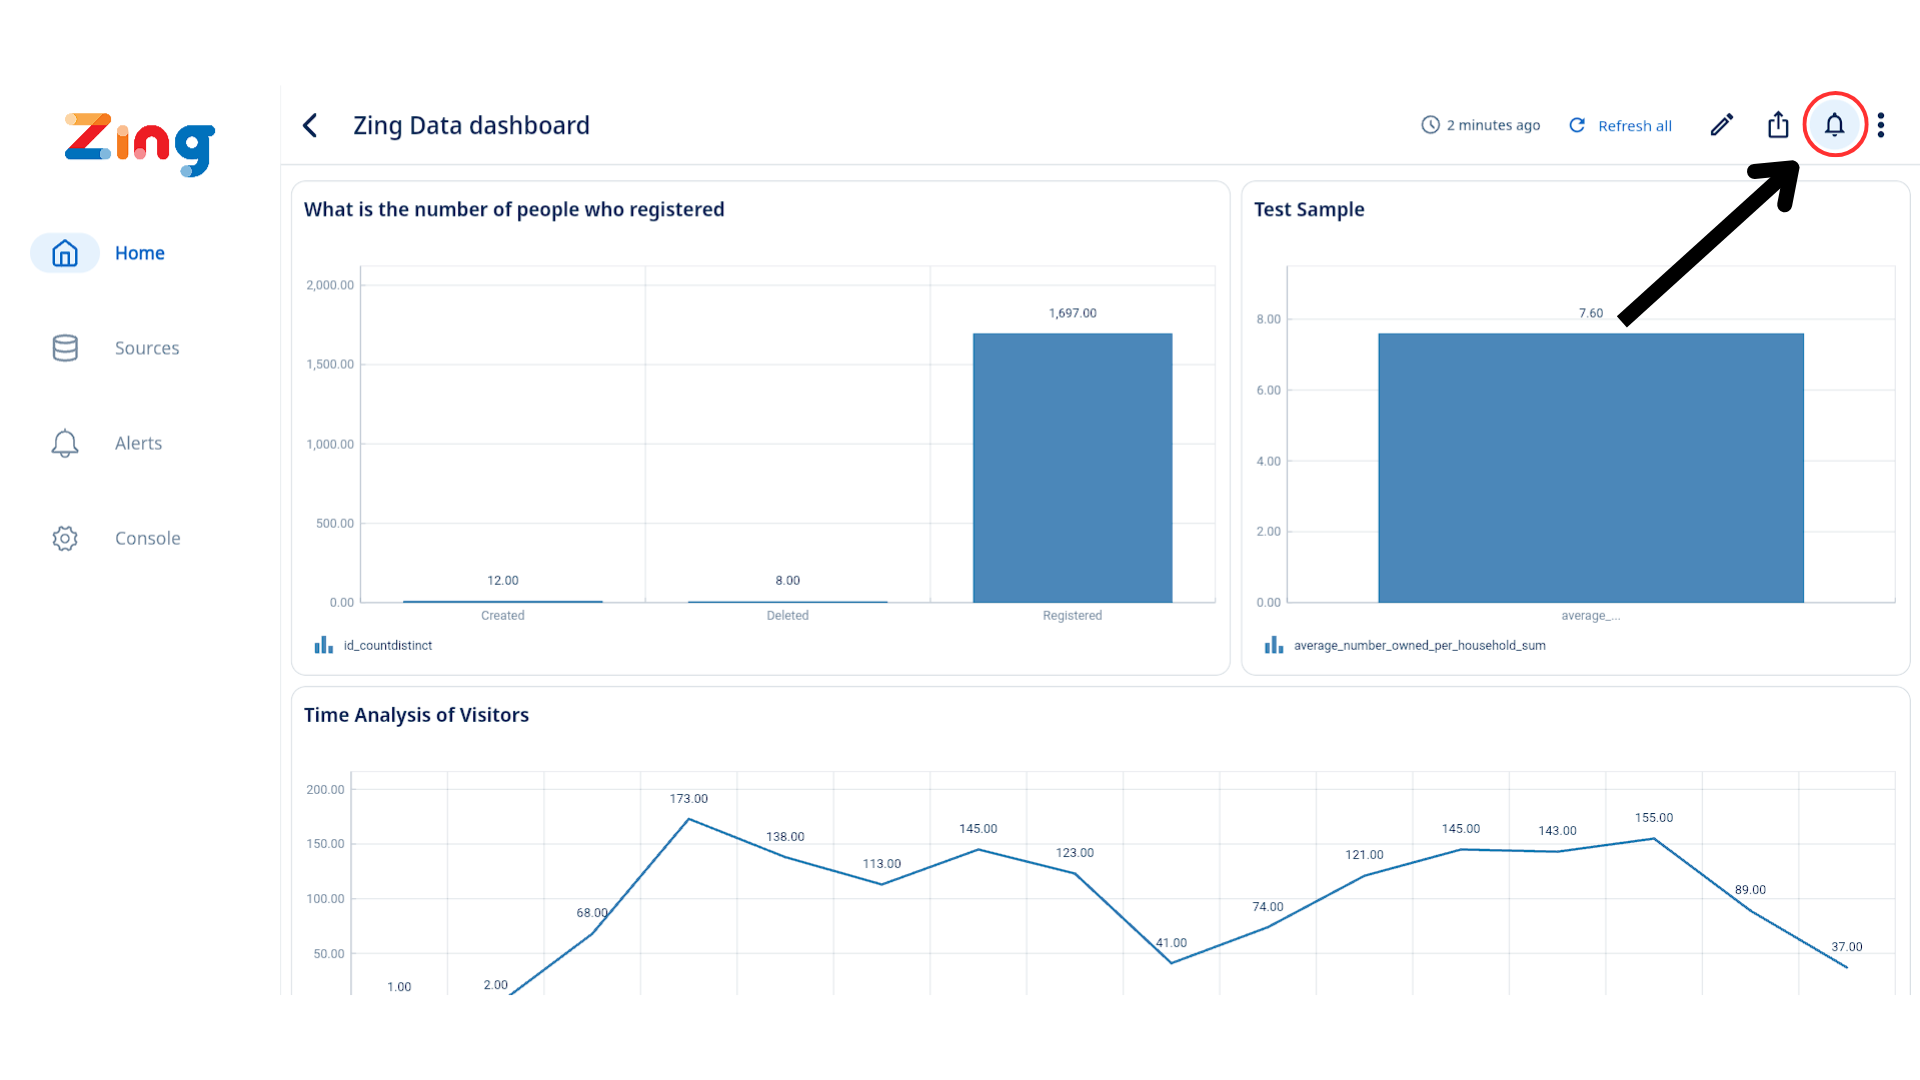
-
Select “Create Alert”.
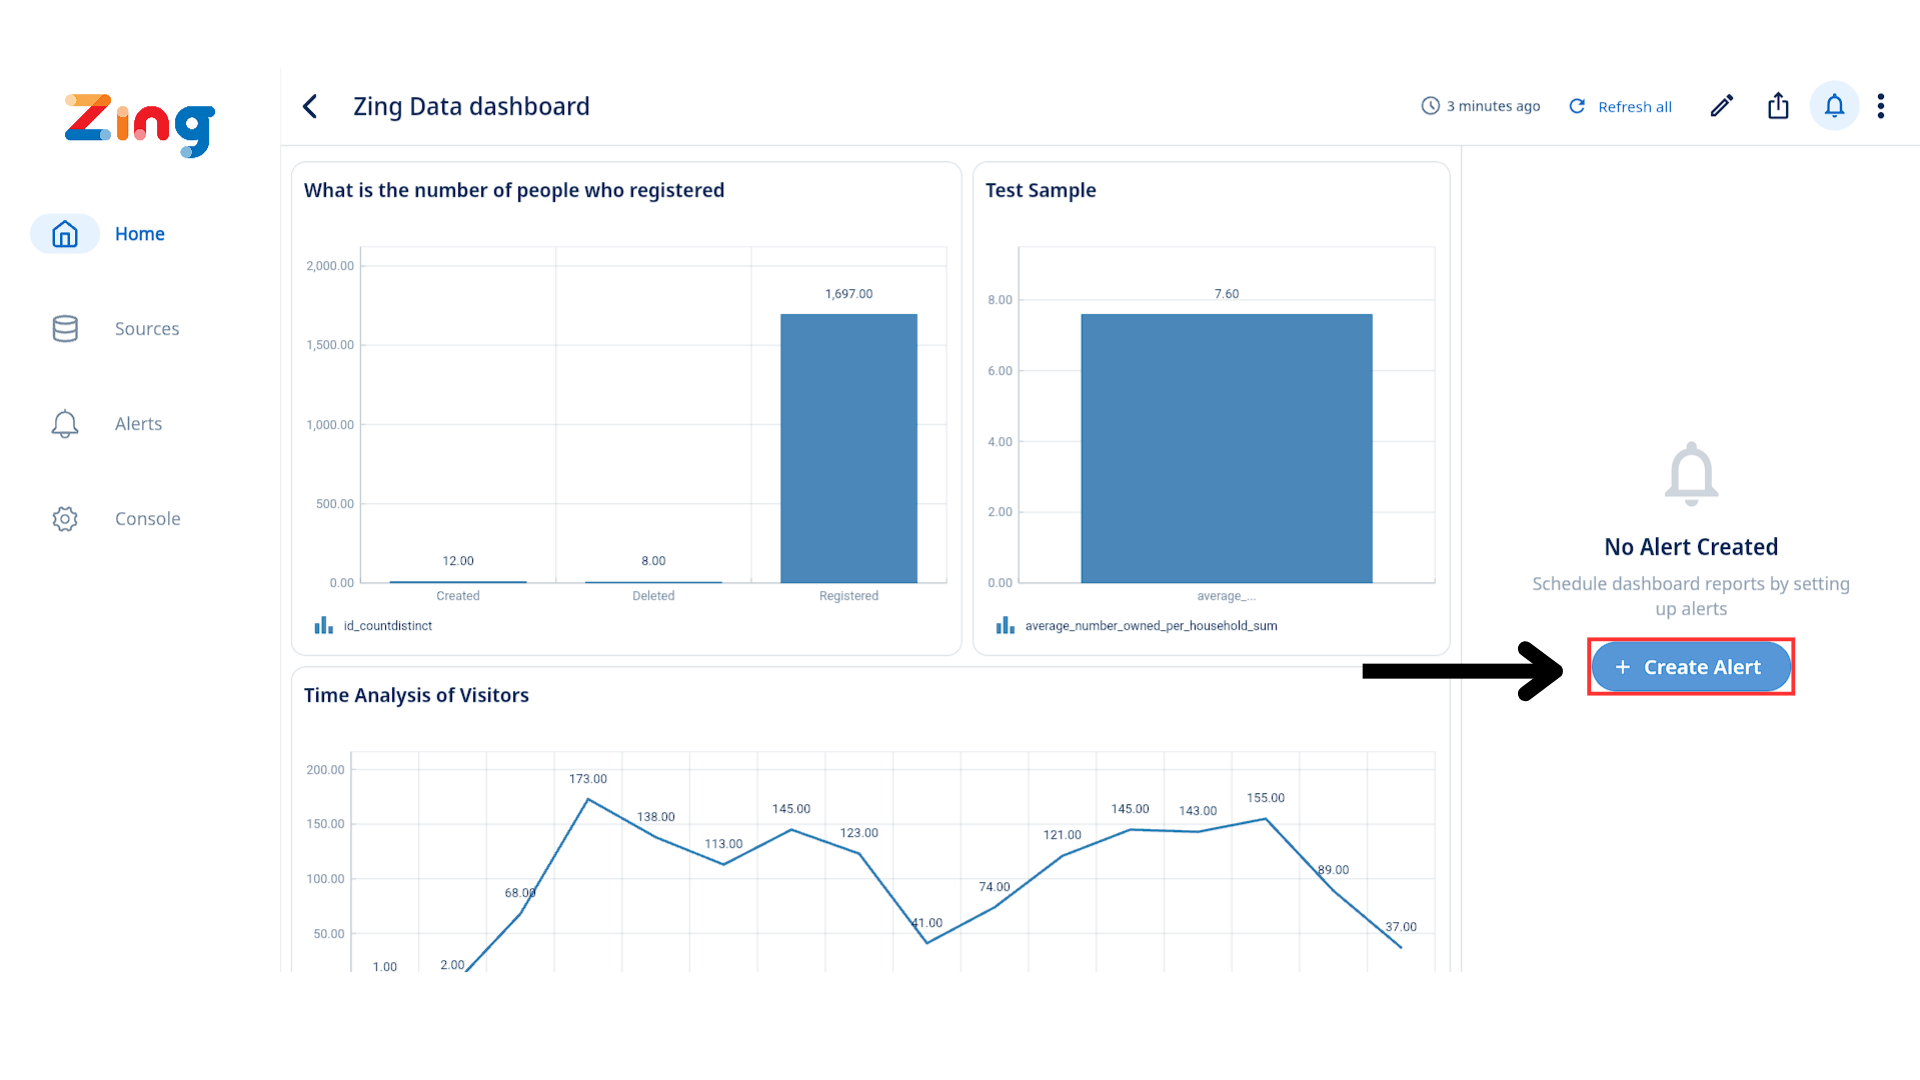
-
Choose the schedule (e.g. every Monday at 9:00 AM).

-
Choose the suitable delivery method (Notification & Email).
Email Options: If “Email” is selected as an alert method, new toggles will be visible under “Email options”:
- “Include image”:
- Default State: Off
- Action: Toggling this ON will instruct the system to generate and attach a snapshot of the relevant chart to the alert email.
- “Include CSV”:
- Default State: Off
- Action: Toggling this ON will instruct the system to generate and attach a CSV file of the data associated with the alert to the email.
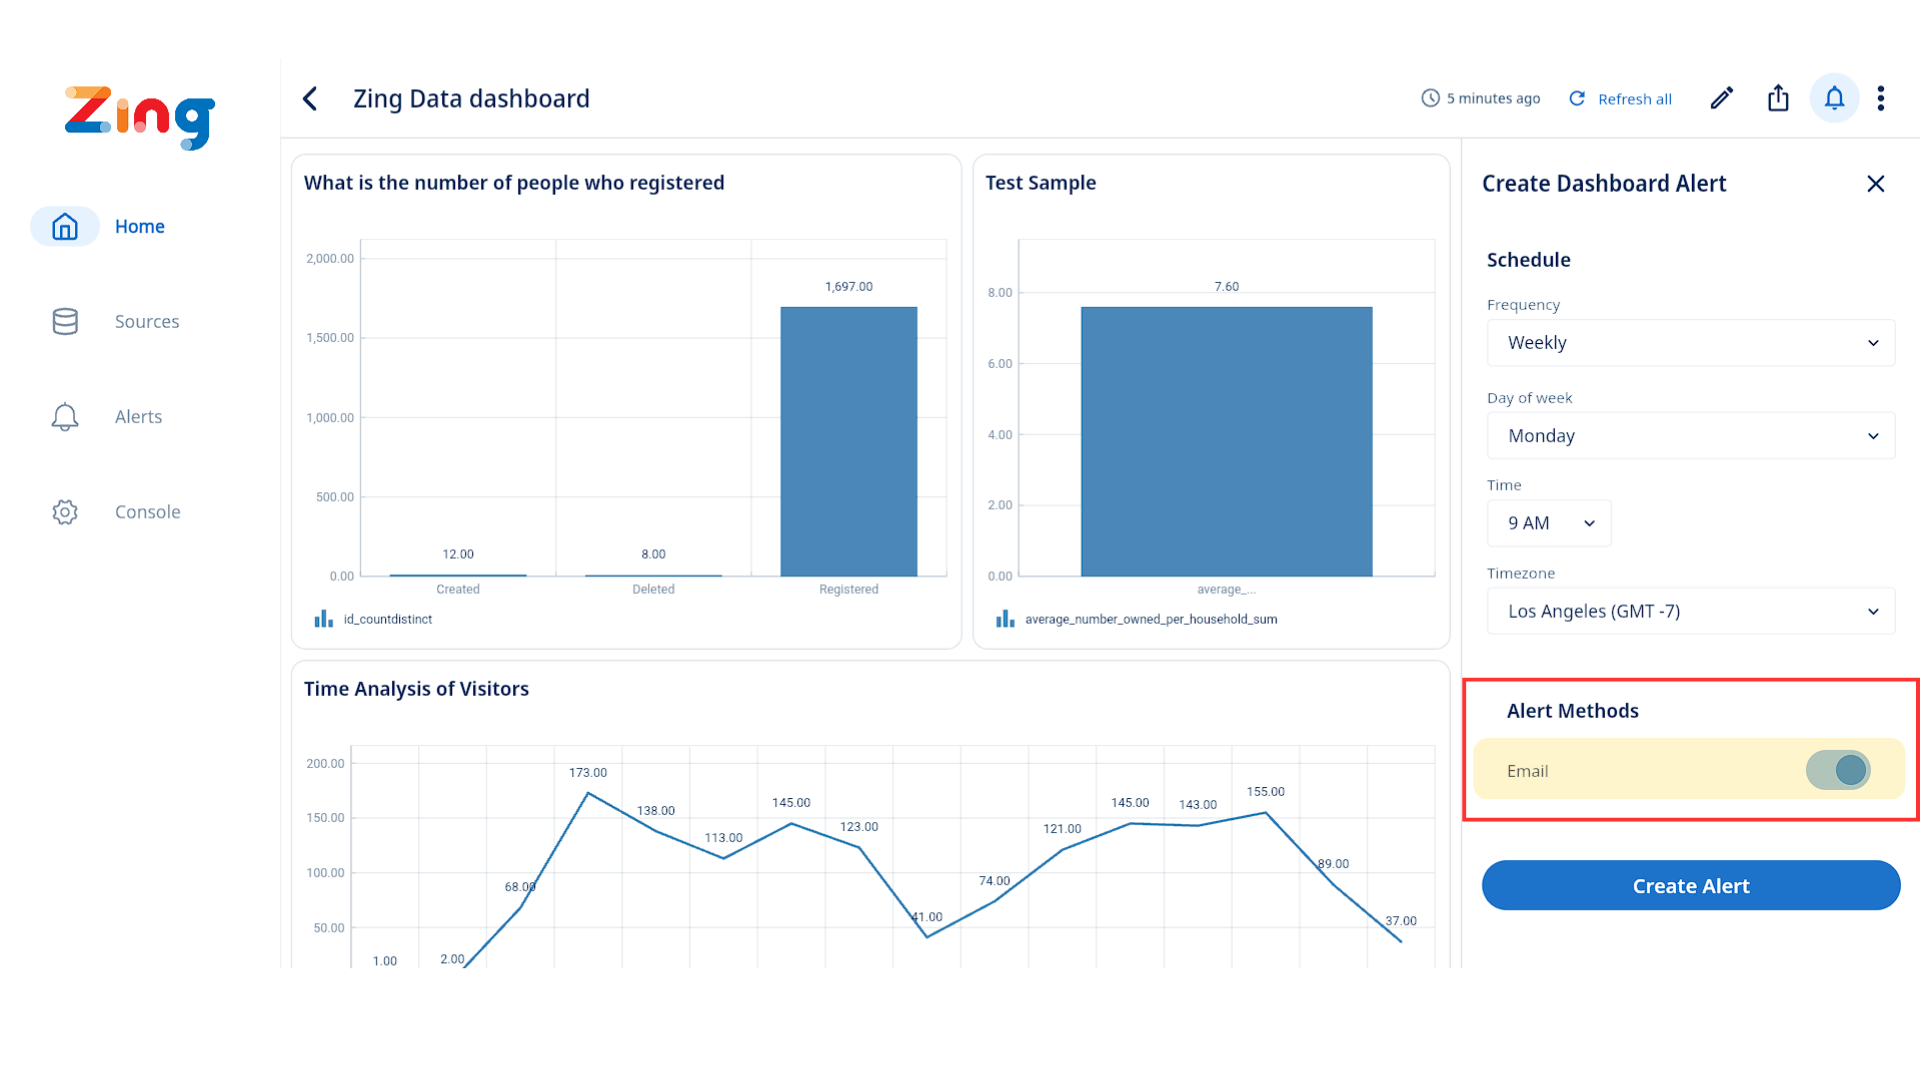
- “Include image”:
-
Tap “Create Alert”.
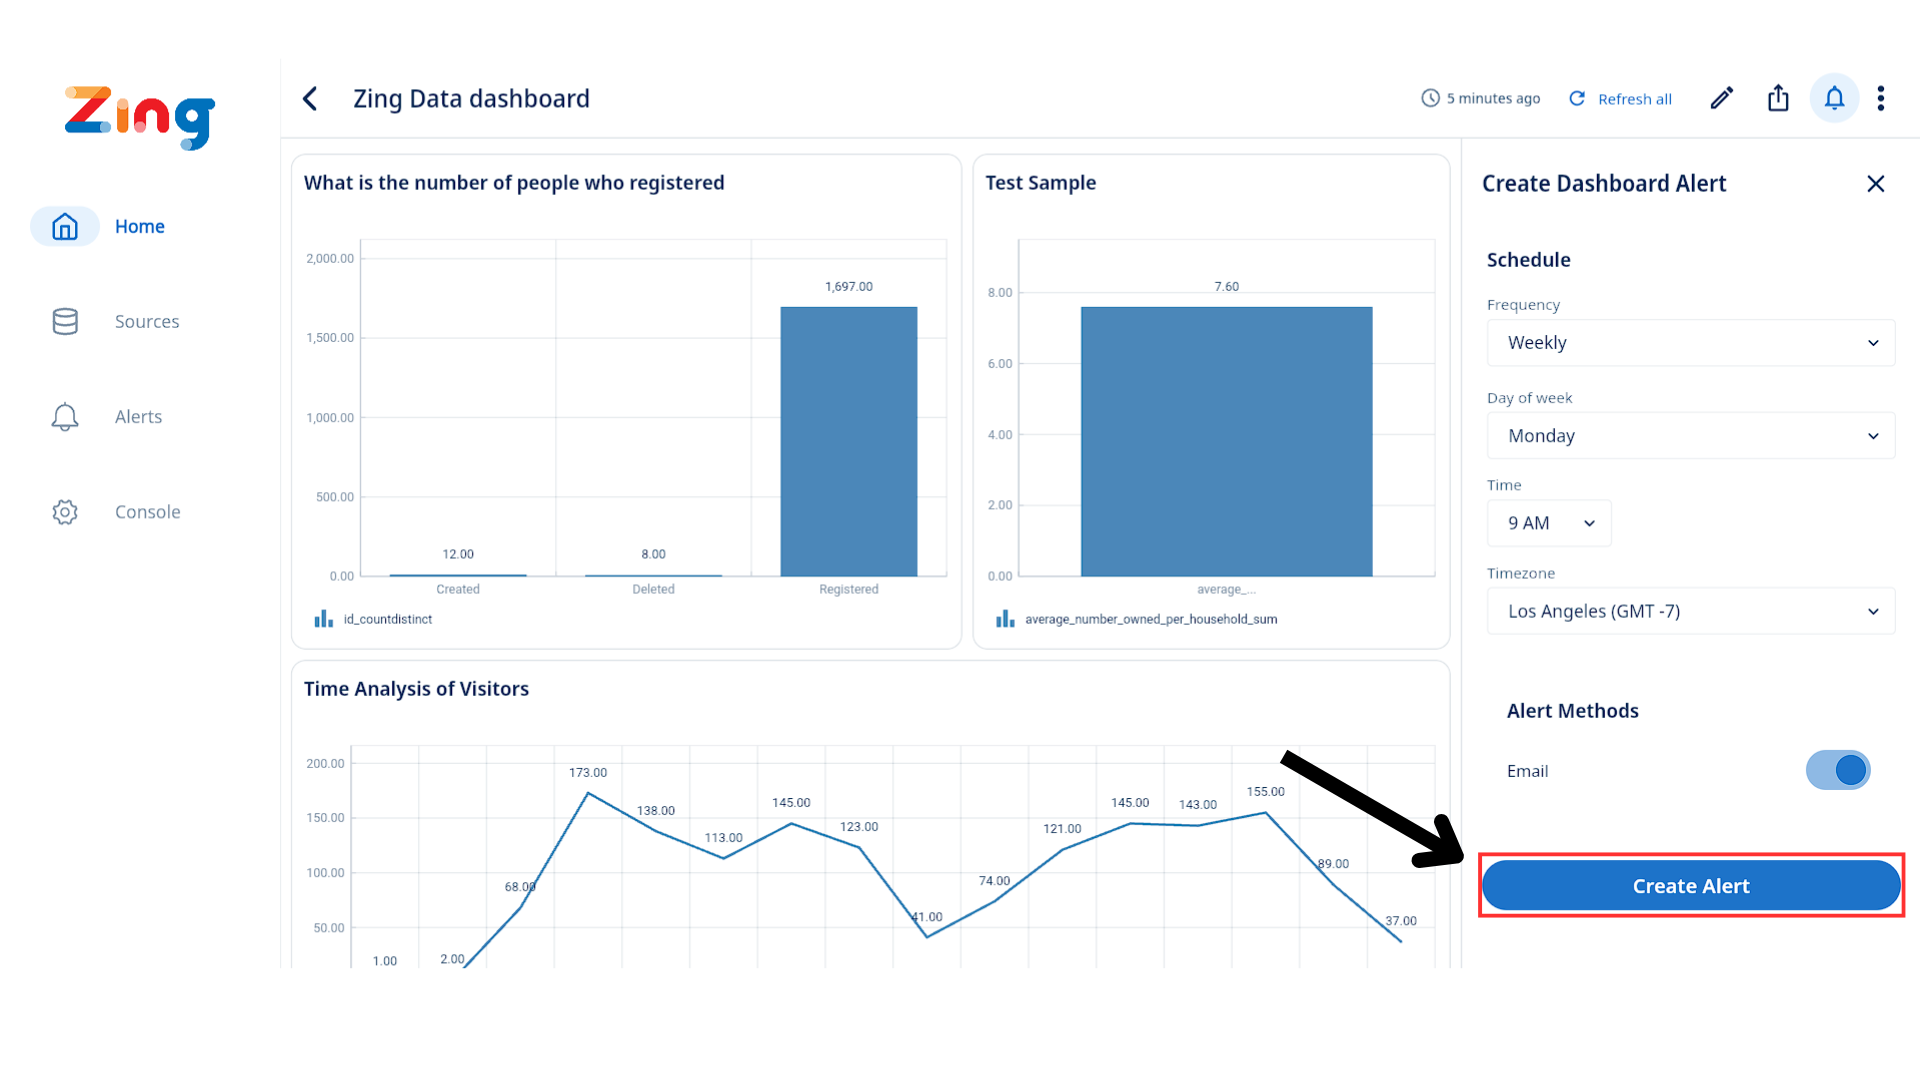
-
Done!
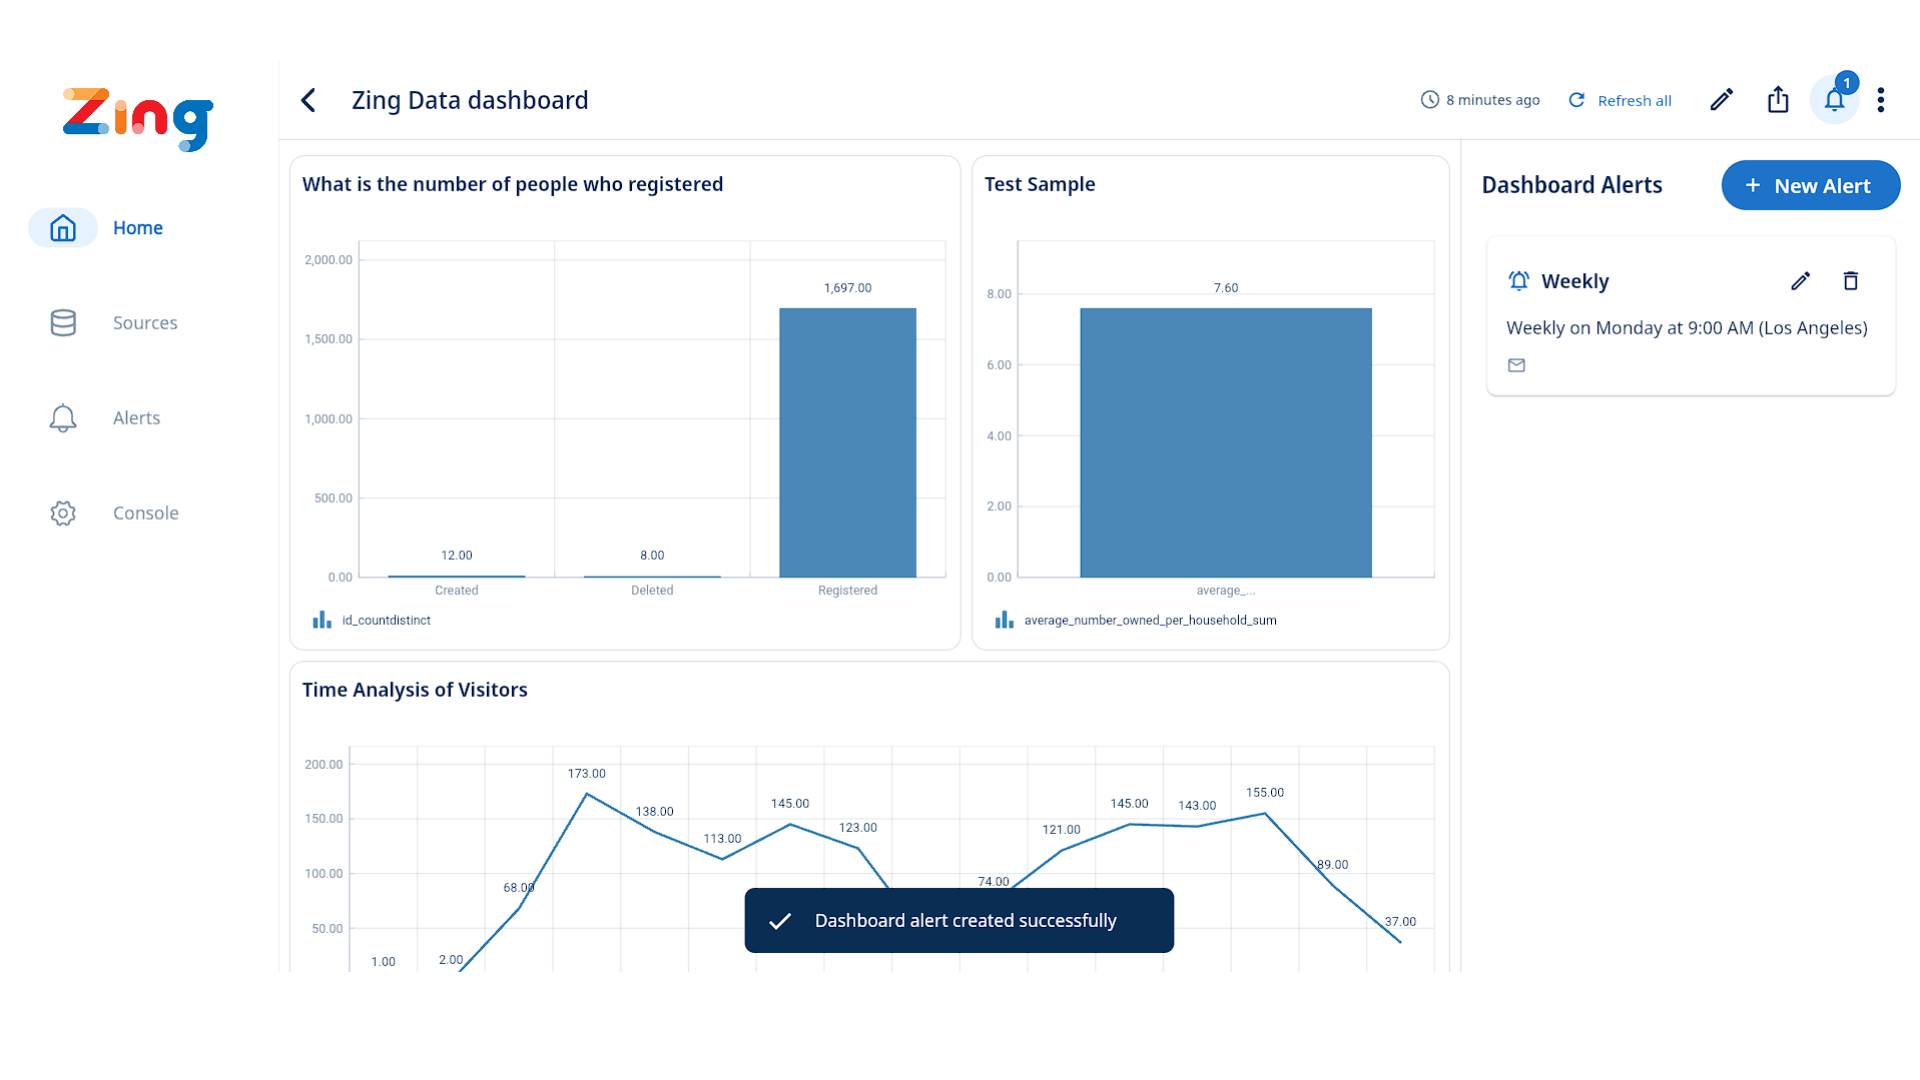
Users can now configure their email alerts to include:
- Image Attachment: A static image (e.g., PNG, JPG) of the chart that triggered the alert. This provides a direct visual representation of the data at the time of the alert.
- CSV Attachment: A Comma Separated Values (.csv) file containing the raw data that underlies the chart/query associated with the alert.
Supported data sources:
Dynamic and scheduled alerts work with questions that have a timestamp or date on the x-axis. Supported sources include: Google BigQuery, Snowflake, Postgres, MySQL, Trino, Presto, Starburst, ClickHouse, Microsoft SQL Server, Databricks, Amazon Redshift, and Google Sheets (LIVE mode only).
Note: Alerts don’t apply to snapshot-mode Google Sheets or CSV/Excel uploads.
Also note: Enabling alerts on a question disables caching—questions must run in live mode for alerts to function as Zing must check for new changes to the data.
Alerts with frequency that is less than a day are only available on the standard plan and above.
12 - Location based querying
Query any database containing geospatial fields in Zing using location-based querying. This lets you:
- Query based on your current location, a radius, or a specific location
- Visualize locations on an interactive map
- Overlay relevant aggregations, calculated fields, and metadata on each data point
To use location-based querying, your data source must contain:
- A numeric field containing ‘lat’ somewhere in the field name (indicating latitude)
- A numeric field containing ‘long’ somewhere in the field name (indicating longitude)
Using natural language:
- Tap on the search bar at the top of the home screen.
- Select the data source you want to base the question on. Ensure your data has the fields ‘latitude’ and ‘longitude’
- Type in your question and remember to include terms such as ‘near me’, ‘around me’, ‘by me’ / street address (e.g. 747 Howard St, San Francisco) / point of interest (e.g. Ferry Building in San Francisco) .
Zing will automatically display results on a map. By default, ‘near me’ gives you results within a 2 mile radius but you can change it to your needs from the filter options.
Next, you can drag and drop fields to customize the pins on the map.
- Color: Pins will have different colors depending on the field you choose
- Size: Size of pins will vary based on the magnitude of the field chosen (smaller values will have smaller size)
- Label: These are the field values you’ll see when when you click on a pin
Using the SwiftQuery drag & drop editor:
- Click the drop down for chart types and select “Map” as the chart type.


- Drag and drop either the ‘lat’ or ‘long’ fields into the “Latitude” or “Longitude” area, and the other coordinate field should be auto-populated.
- A preview of the map with clusters of pins should be displayed.
Next, you can specify how each pin appears based on properties of the data:
- Color: Each pin will have a color corresponding to a value from the field chosen.
- Size: The size of each pin will depend on the relative magnitude of its value from the chosen field.
- Location Filter: You can filter results shown, by specifying a location and a radius size within that location. You will need to give Zing permission to use your phone’s location if “Current location” is selected.
- Labels: You can drag and drop fields inside this area to see each pin’s data for the fields selected on the map.
Here is a demonstration of how you can use SwiftQuery to visualize location data on a map interactively! 
Using the list editor:
-
Tap on a table or view containing latitude and longitude fields
-
Tap and hold a latitude field, and then ‘set as latitude’. If you have a latitude field and longitude field with a similar name structure ( e.g. store_latitude and store_longitude )
Zing will automatically select the corresponding latitude or longitude field.
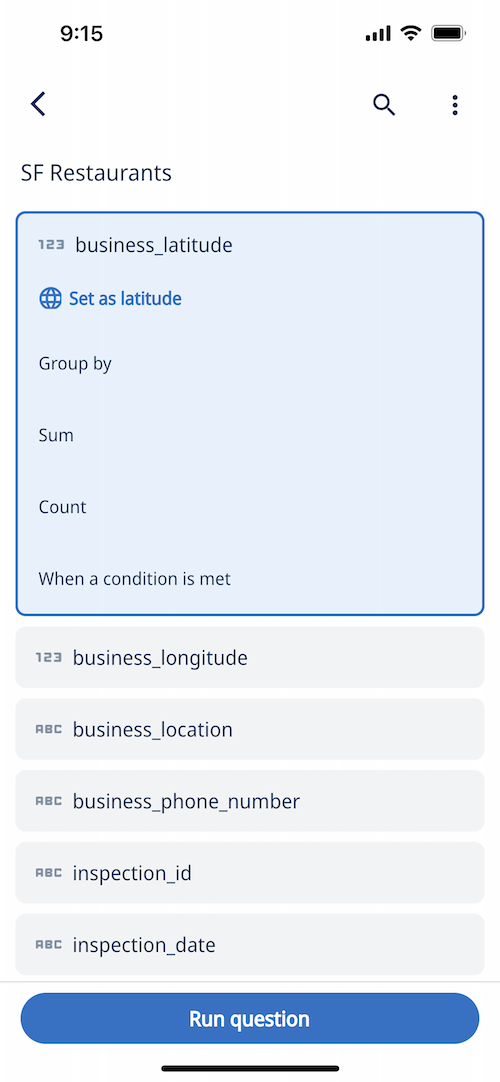
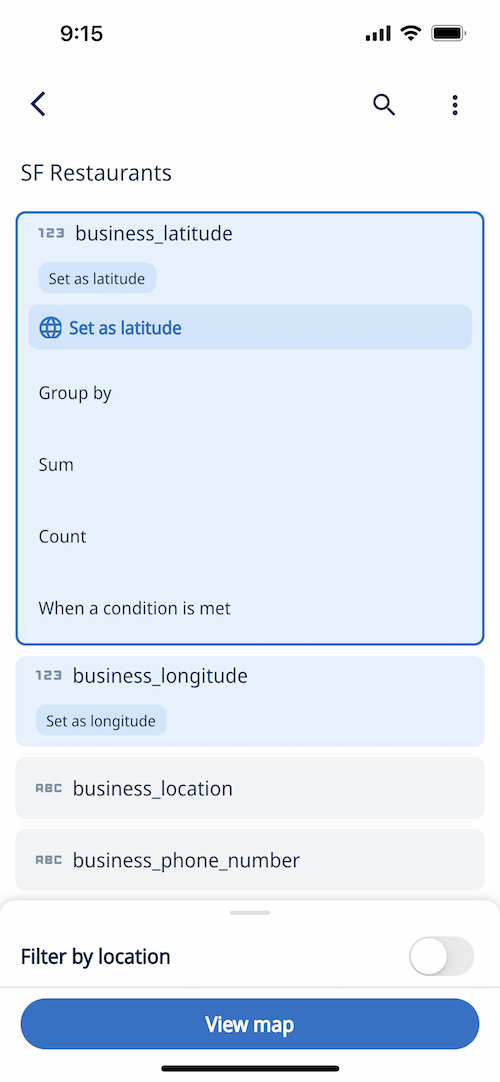
-
Optionally, you can select other fields and aggregations, whose values will appear on the map
-
From here, you can tap ‘run question’ and all points returned from the query will be shown
OR
Select ‘Filter by location’ and give Zing permission to use your phone’s location:
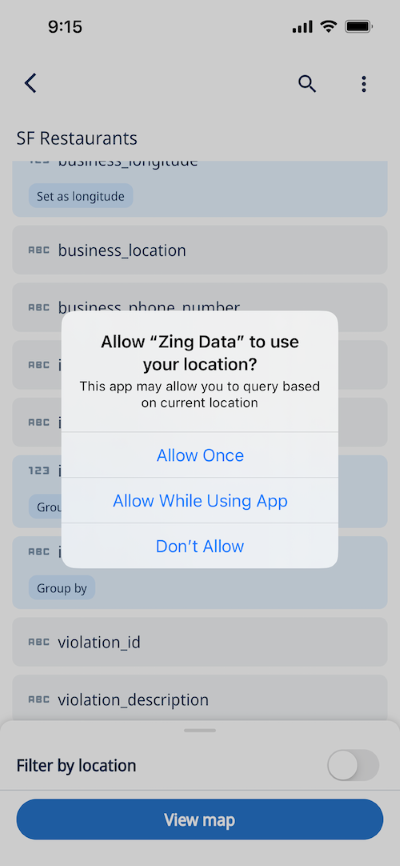
Then select the radius relative your current location, or type an alternate address to filter your query.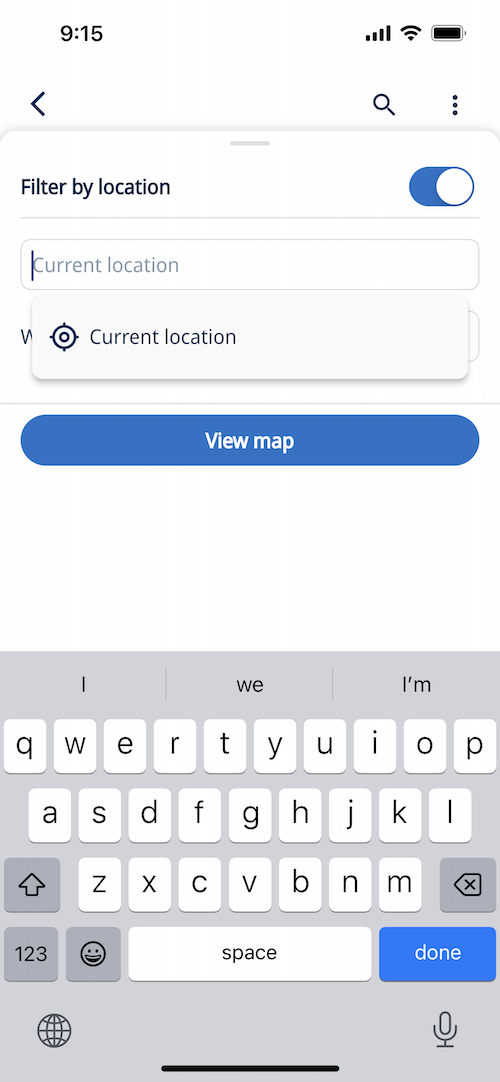
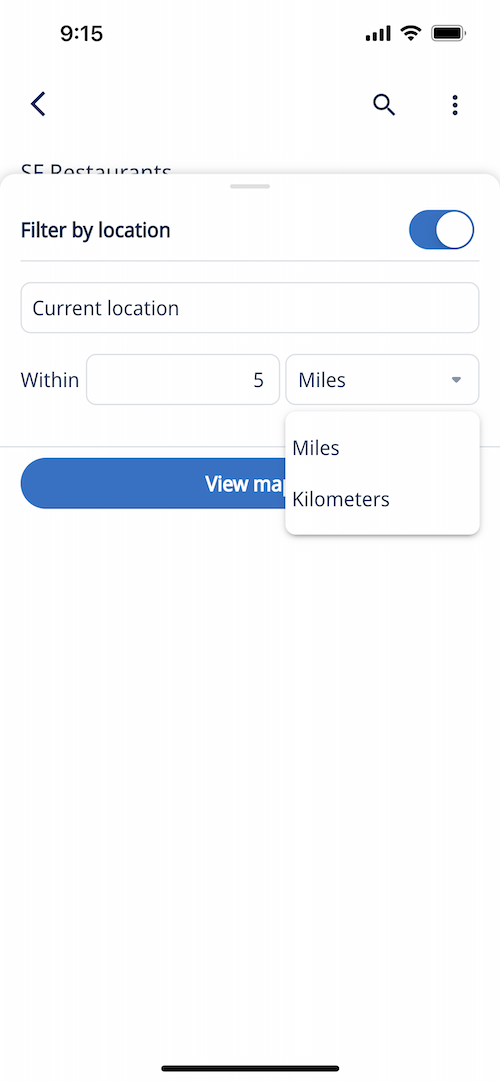
-
Your query results are shown on a map (with up to 50 grouped data points).
You can tap ‘full results’ to see all points for your query, or ‘Always show full results’ to always see full results for that question when saved.
Zoom in or out an Zing will aggregate points for better usability.
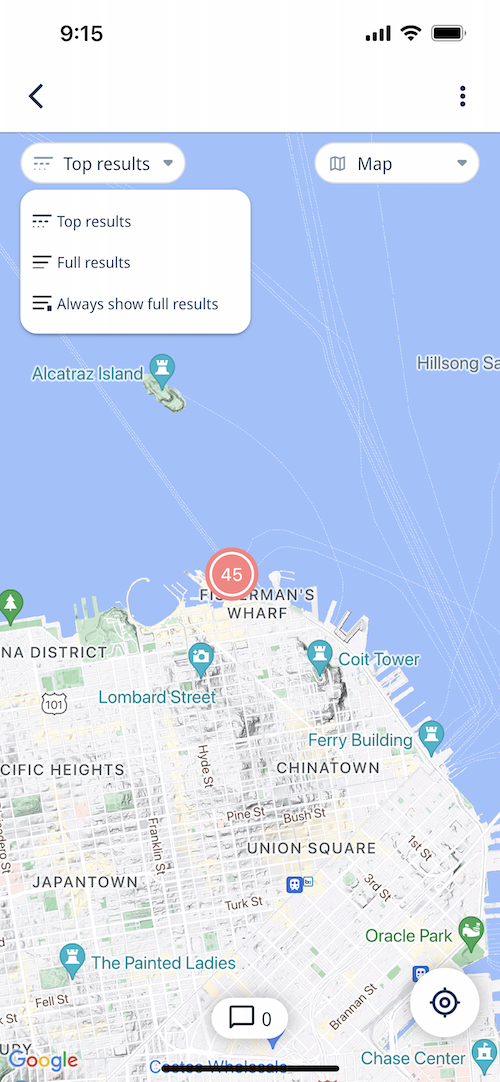
-
Tap on a data point to see all the values and metadata for each point. If you selected other fields than latitude / longitude in your query, or aggregations those will appear when you tap a point.
If multiple points are on top of each other (e.g. multiple inspection dates on a given property and you’ve grouped by inspection_date, you’ll see arrows at the bottom of the screen to swipe through the values.
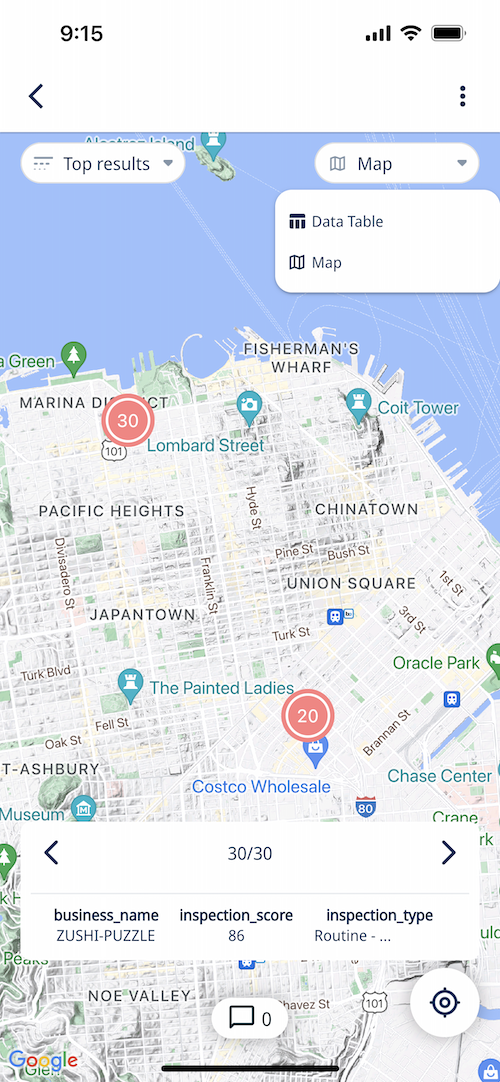
-
Save the question.
-
Each time you or anybody you’ve shared the question with opens the question, the results will be show relative to that person’s location if you specified ‘current location’ when constructing the query, if they have location services turned on.
Location queries can be run on iOS, Android, or the web.
13 - Accounts, Invites, & Collaboration
Creating an account
When you create a Zing account, you’ll want to use an email at the same domain as your colleagues. By default Zing will limit invites to people at the same domain name to ensure that you don’t accidentally share outside your organization (unless you want to, in which case turn on external sharing ) in settings.
Inviting People
You can invite people to your data sources using their e-mail address. Once they accept your invite, they’ll be able to access your organization’s data sources and shared questions.
If you want to invite a user to view a single question, click the ‘Share’ icon on that question (the up arrow in a box in the top right) and add them to the list of people with access. You can specify a viewer or editor role, and you can optionally make a question visible or editable to your organization.
Note that sharing an individual question without inviting a user to the organization will make the question visible to them, but the underlying data source will not appear in their sources tab. If you want a user to have the data source listed in their ‘sources’ tab, share the data source with them using the Zing web console.
Web Console
From the web console:
- Tap ‘Invite Users’

- Type the email(s) of the people you want to invite. You can invite multiple people by seperating the email addreses using a comma - useful for batch invites.
- Tap the ‘+’ icon
- Tap ‘Invite’ to send the invites
You can resend an invite, cancel an invitation, or view if an invitation has been accepted by tapping on the ‘Invitations’ tab.
iOS, Android, and Web App
From the mobile app on iOS and Android, or the Zing Web app (login to Zing then click the ‘Zing Web App’ tab):
- Go to a question and tap ‘share’ in the upper right. If you haven’t yet saved the question, Zing will automatically save it for you to facilitate sharing.
- Type the email(s) of the people you’d like to invite to view this question

-
Tap ‘Invite
’, and you’ll see the email address selection confirmed by a white box and showing only the portion of the email address before the @domain.com

- Tap the blue arrow in the upper right to send the invitations
Note that by default you can only invite people to your data sources and questions if they are part of the same domain (the portion following the @ in the email address). This is to ensure that data from your organization is only shared with people who are part of your organization.
If you want to allow invites to email addresses outside your domain (and are an administrator of the organization), you can turn on external dashboard sharing in the Zing Web Console under ‘settings’ and then ‘Allow invites outside my domain’.
It is strongly suggested that you sign up for Zing using your company email address and not a personal email address (such as gmail or that of your ISP). This is because the default of restricting invites to only your domain is applied on the domain level (the portion after the @ sign in your email).
Commenting and Annotations
Add comments to a question or dashboard using the comment box in the mobile app answer screen, or the right hand pane in the web app from the answer screen. If a question isn’t saved yet and you add a comment, Zing will automatically save the question (you may wish to rename it by tapping the three dots in the upper right of the answer screen).
You can comment on a question or a dashboard. Your comments will be visible to anybody who has access to that question or dashboard.
Mentions
Mention colleagues within the chat function to send them an email which links to your comment. Much like Google Docs or Slack, using mentions in Zing informs your mentioned colleague so they can look at your comment and respond if needed. If they have enabled push notifications, they’ll receive a push notification instead of an email.
To use mentions, just type the @ symbol in the comment box from the question view and you’ll see a list of colleagues who are already part of the organization. After the @ start typing their name (first or last name) and Zing will display a list of the colleagues who match your input. Tap the colleague you want to mention. You may mention multiple colleagues within a comment.
Shared Questions
On the Zing Data web and mobile apps, you’ll see a Questions section and a Tables section.
The Questions section shows questions that you have asked on your own, as well as questions which have been asked by your colleagues recently or which have been shared with you.
You’ll see at a glance when somebody most recently commented, who commented, and the total number of comments. Simply tap on a question to see the visualization for that question and the full comment thread. The questions with the most recent comments, and questions most recently asked will appear at the top. Older questions will appear below that.
How to share a question
- Click on a question on your home screen.
- Click on the Share icon.

- Type the email address(es) of the users you want to share the question with.

- A user can be invited as a “Viewer” or an “Editor” to a question.

- Select the role and click on the Arrow icon to share the question with the user(s).
- The list of users the question is shared with will be shown in the Share Panel. The role of the shared users can be updated here. You can also revoke access to the question for a particular user by clicking on the dropdown in front of the user and selecting “No Access”. You can share the question with the entire organization by selecting a role under the organization dropdown.

- The shared question will appear in the user’s homescreen.
- If you share the question with a user who does not have an account with Zing, they will receive an invitation to join Zing and they will be added to your organization as well.
Activity Feed
You can see a list of all the questions you have created, the mentions you have made of others in comments, and the mentions of you in other people’s comments by viewing your activity feed.
To access your activity feed in the app, tap ‘Settings’ then ‘Profile’. You can click on any question or comment to be taken to that specific question.

Two factor authentication
Zing supports two factor authentication, and is highly suggested for sensitive data sources. 2FA is supported via Google SSO. To turn on 2FA, create your Zing account with Google Single Sign On (SSO), and turn on SSO for your organization in settings as outlined below:
- Ensure that two factor authentication is turned on and required for your Google Workspace users or if you are a single user, your individual account.
- Login to Zing on the web, and go to settings
- Scroll down to organizations turn on Require Google SSO

- Click save changes
Now, all users who are part of your organization will be required to authenticate their credentials with two factor authentication to login to Zing.
Turning on or off custom SQL querying for your organization
Zing allows anybody in your orgnaization to run custom SQL.
- Only SELECT statements are allowed by default, and no INSERT / UPDATE / DROP or other actions that would modify data.
- Administrators of the organization can enable statements such as INSERT / UPDATE / DROP / CREATE which would allow anybody in your organization to modify your data in the datasource. This can be enabled via
Settings–>Optionsfor each datasource on the datasource page.
This is powerful because it lets you do more complex queries, including joining tables or using functions not supported in the visual query builder but which your underlying database supports – for instance regex commands or parsing JSON fields.
An administrator of an organization can turn off the ability to run custom SQL queries (instead limiting users in the organization to the visual query builder only) by going to settings and then toggling on/off Enable Custom SQL IDE.
13.1 - User Roles
User roles in an organization
User roles in Zing Data are defined at two levels:
- Organization-level roles: Set a user’s access across all questions and data sources.
- Question-level roles: Can override org roles to grant more permissive access to specific questions.
By default, an organization-level role governs access unless a more permissive question-level role is granted.
There are five levels of user roles within an organization, ranked from low to high in terms of permissiveness:
A Limited Viewer can:
- Only access specific questions or dashboards that have been explicitly shared with them
A Limited Viewer cannot:
- Ask new questions
- View any questions that were not explicitly shared with them.
- Share questions
- Export questions to CSV
A viewer can:
- View and comment on questions
- Create alerts on questions
- Save questions as photos
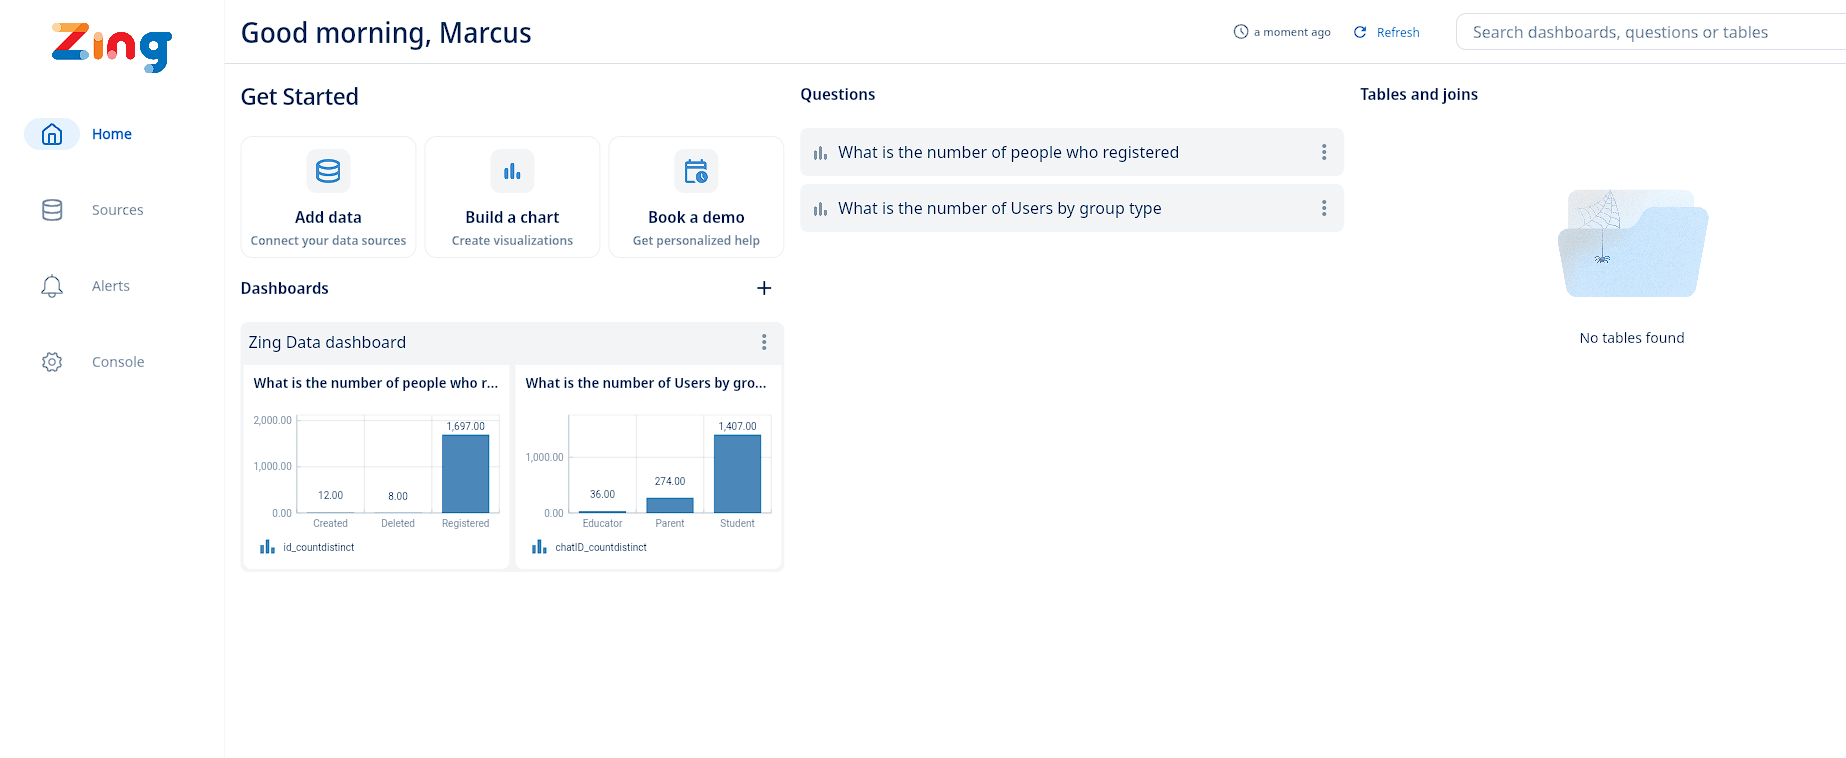
When a viewer logs in, they are automatically directed to the ‘app’ view, which offers a simplified experience focused on interacting with existing questions. They do not see the console screen, tables, joins, or data sources.
A member can do everything a viewer can, AND:
- Create, copy, edit, and delete their own questions and dashboards
- Share questions and dashboards
- Save data tables as CSVs
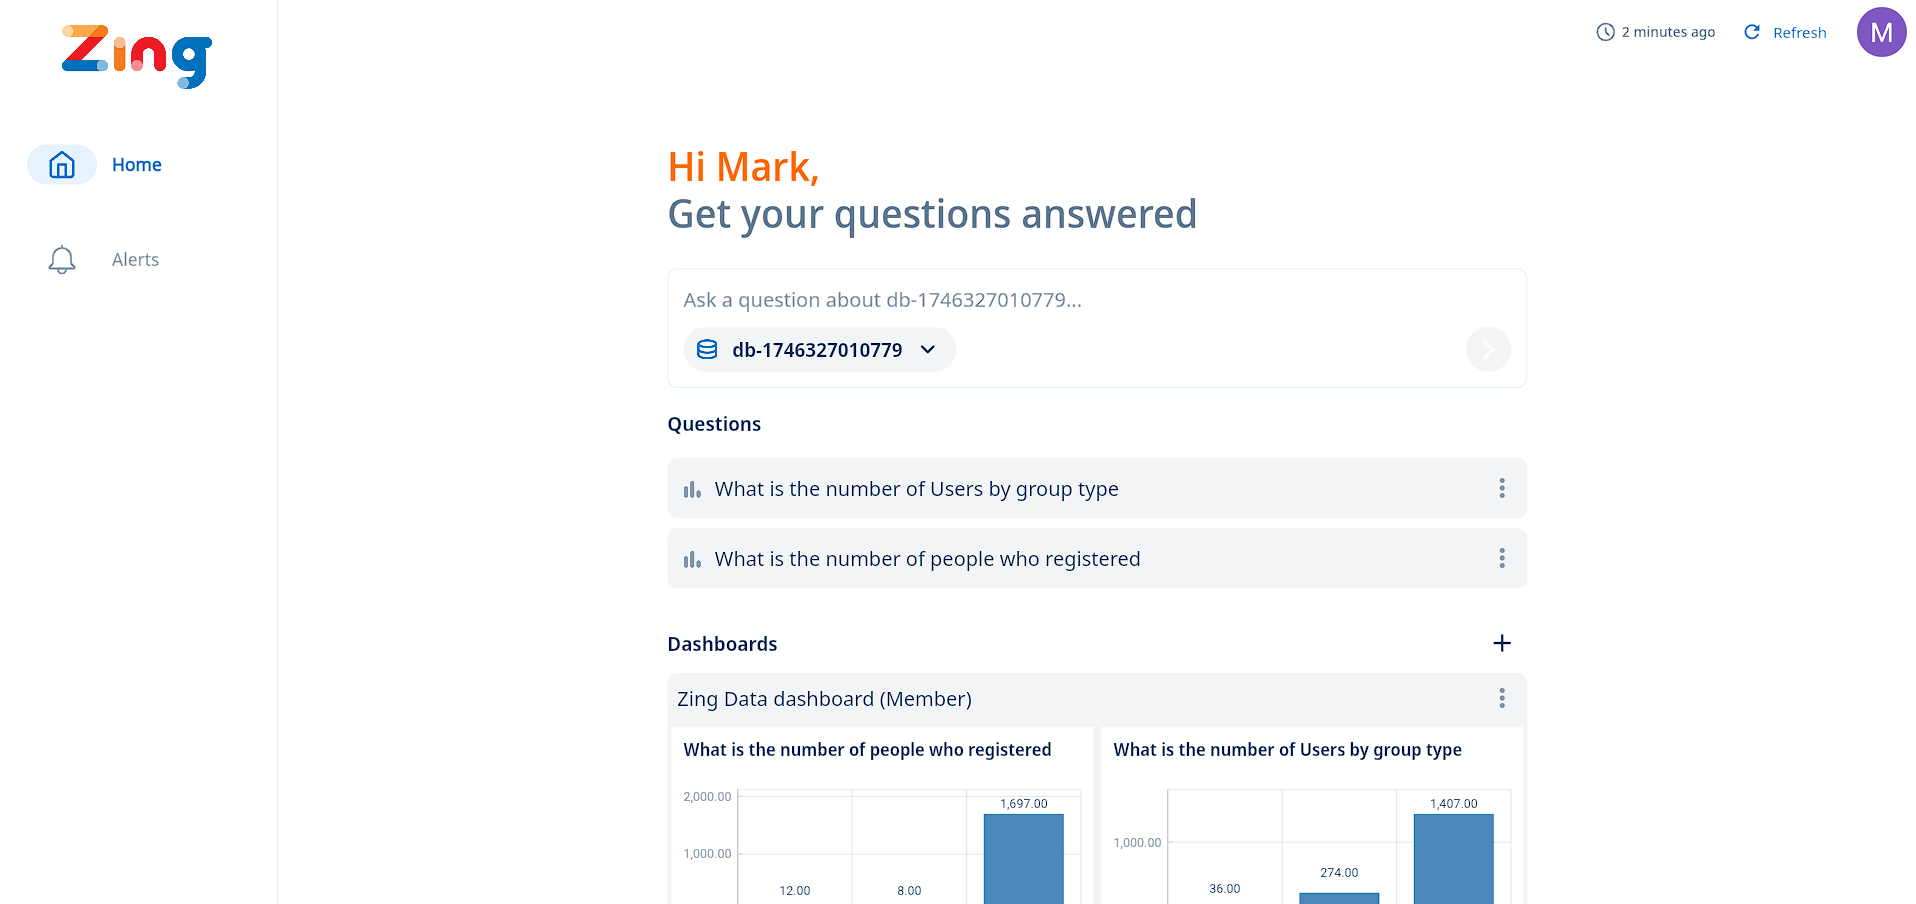
When a member logs in, they are also automatically directed to the ‘app’ view, providing a cleaner, more minimalist home screen experience. This streamlined interface is ideal for users who primarily interact with existing questions and dashboards and do not frequently create new content or manage data sources. Members do not see the console screen, tables, joins, or data sources.
To ensure a user sees this intended member view upon login, the following conditions must be met:
- Single Organization Membership: The user’s account can only be associated with one organization.
- No Owner or Admin Roles Elsewhere: The user must not hold an Owner or Admin role in any other Zing Data organization. These higher-level roles grant access to the console and data management features, which are intentionally hidden in the member view.
*Please note that a user invited to your organization with the Member role has certain restrictions designed to maintain the simplified, streamlined experience of the member view. If a user invited as a Member is part of multiple organizations or holds an Owner/Admin role elsewhere, their initial login experience might differ from the intended member view.
An editor can do everything a member can, AND:
- View and query tables in the Console
- Edit and delete questions where they are listed as an editor
An admin do Everything an Editor can, AND:
- Invite and remove users from the organization
- Manage user roles
- Create, edit, and delete data sources
- Upgrade, downgrade, or cancel an organizations plan
- Get Embedded Analytics API Keys
- Turn on/off external link sharing, the SQL IDE option, and ‘skinning’ options
- Create AI examples and ghost text to improve natural language performance
Special note for Admins:
- You can specify a role when you invite users to your organization
- Only you can add and delete data sources in console or web app

User roles on a question
You can specify user roles when sharing questions with other users.
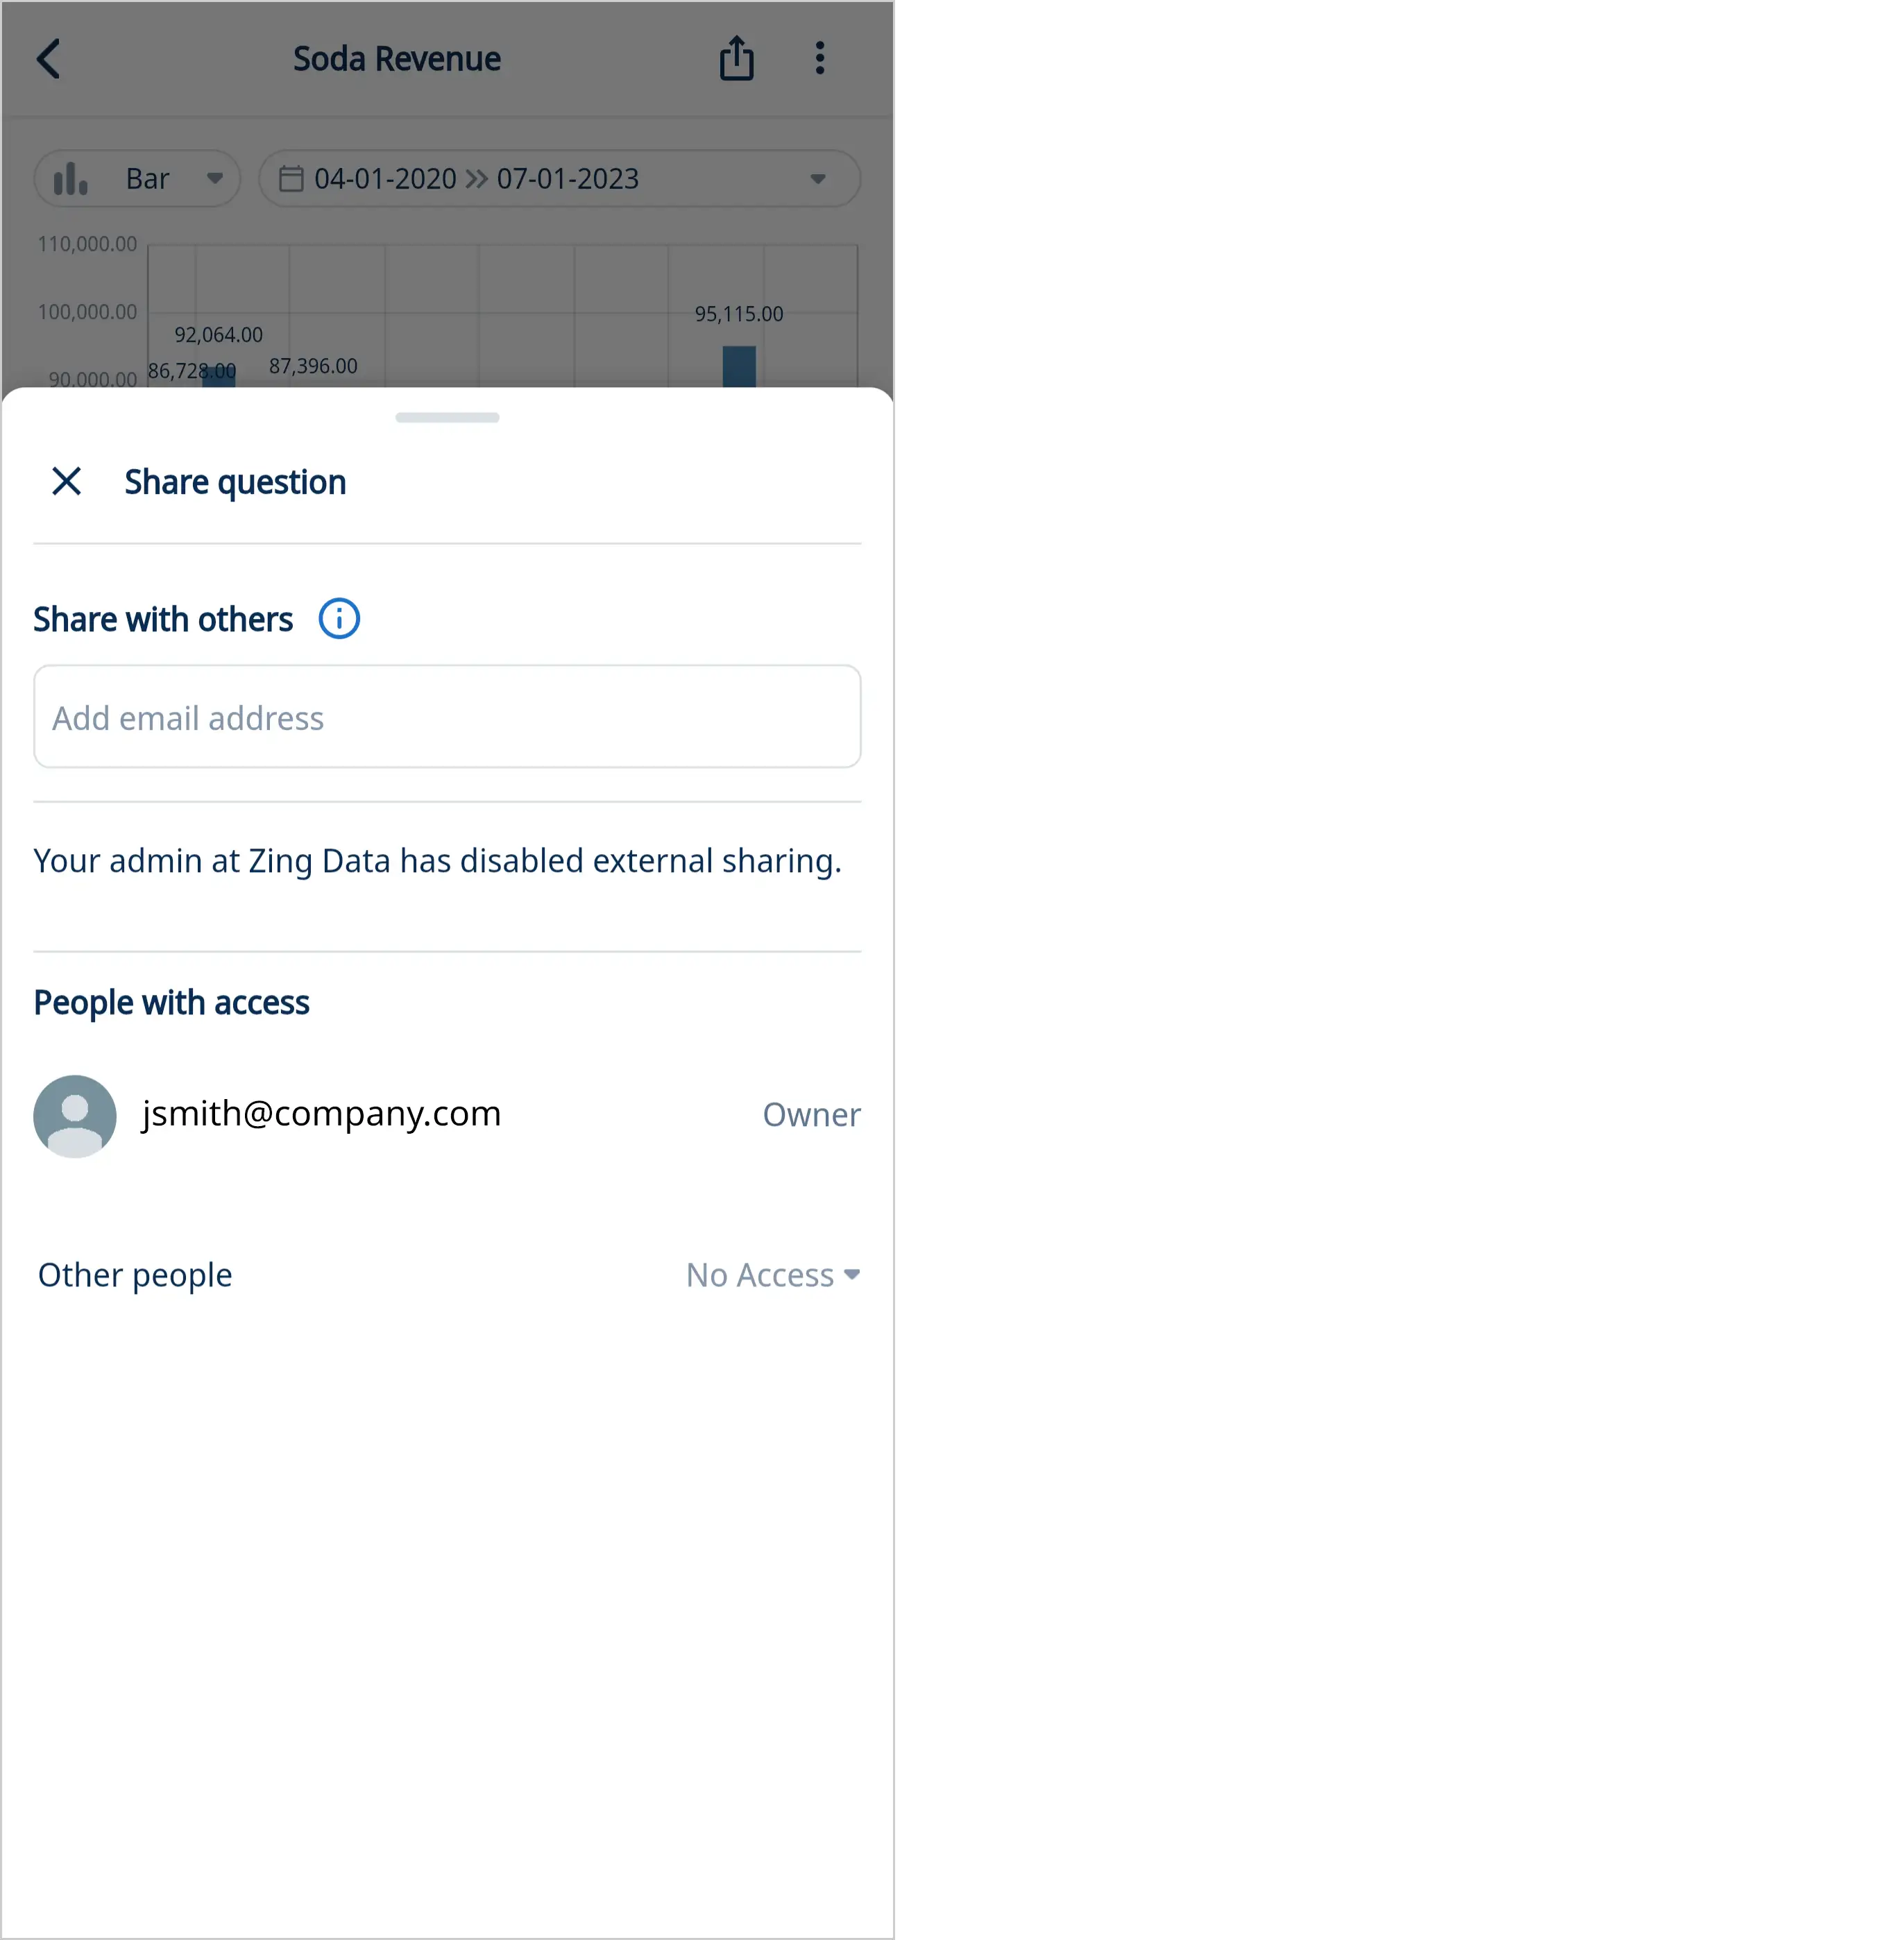
When a user’s role on a question differs from their role within the organization, the more permissive role will be in effect.
Managing Organization Users
As an Admin or Owner, you have the ability to manage users within your organization directly from the web console. This includes changing their assigned roles or removing them from the organization entirely.
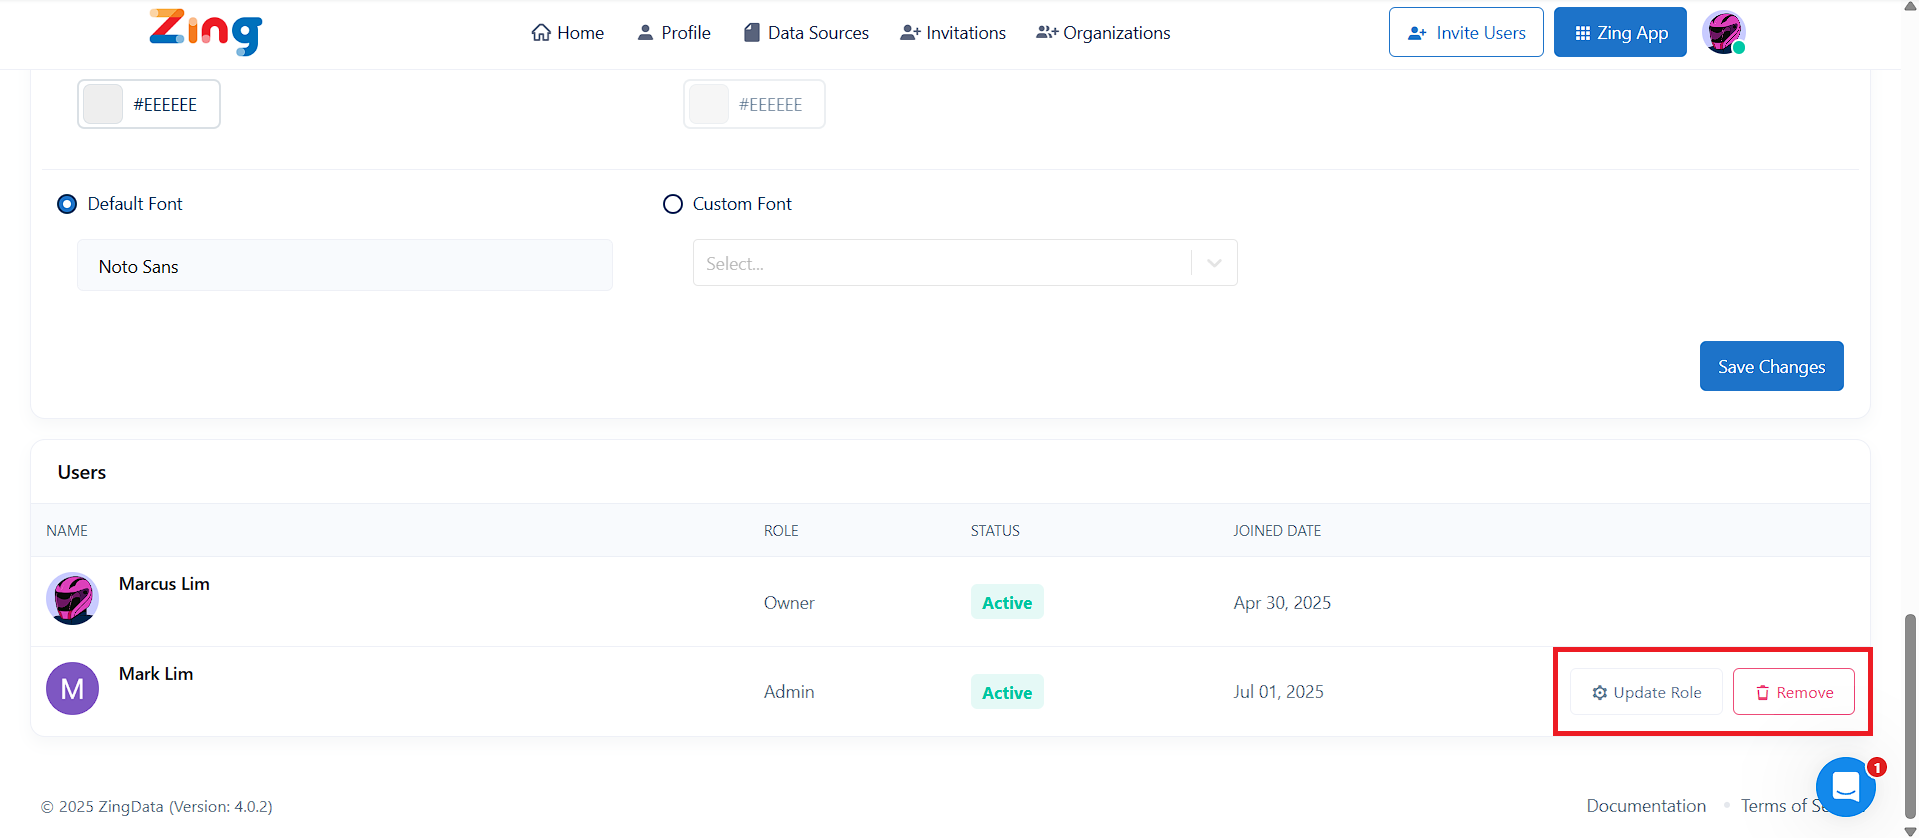
Changing User Roles
You may need to update a user’s role to grant them more permissions (e.g., promoting a Member to an Editor) or restrict their access.
To change a user’s role:
- Navigate to Organizations from the main menu.
- Tap on Settings of the chosen Organization.
- You will see a list of all users in your organization under the Users section.
- To change a user’s permissions, tap Update Roles and select their new role (Viewer, Member, Editor, or Admin).
The user’s permissions are updated instantly.
How to Remove a User
When a team member no longer requires access to your organization’s data, you can remove them completely. This action will revoke all access to your Zing environment, including shared dashboards and data sources.
- Navigate to Organizations from the main menu.
- Tap on Settings of the chosen Organization.
- You will see a list of all users in your organization under the Users section.
- To remove a user from the organization entirely, simply tap the Remove button next to their name.
The user will no longer be able to access your Zing organization.
Leaving an Organization
Users of All Roles except Owners can remove themselves from an organization at any time. This action is performed from the Organization Settings page. Owners cannot remove themselves and must transfer ownership of the organization to another Zing Data user before leaving the organization.
14 - External Sharing
Secure by Default
Zing protects your data with industry-leading encryption and optional multi-factor authentication. We also protect you by ensuring that you’re only sharing data and questions with people you intend to.
Thats why sharing data sources, questions, and tables is limited to people who are part of your domain by default. This ensures that only people at your company can be invited to view your data source.

That said, you can optionally turn on external sharing to allow access to a datasource, question, or table outside your domain.
External Dashboard / Question Sharing
External Sharing lets you share a graph, table, or datasource with a customer or partner.
- For instance a advertising agency may wish to share a set of saved questions on campaign performance with a client so they access it in Zing.
- A survey company may wish to share survey results with a client outside of their organization.
- A company focused on getting recruiting leads for a client might wish to share the number of leads and their status in the pipeline with a client
Automating Personalized Dashboard / Question Emails
The administrator (typically the person who created the Zing account) is the only
Zing supports user-aware variables like zing.user.email to automatically filter data at query time. When you send an alert to multiple recipients, Zing Data dynamically substitutes each person’s context into the query, ensuring personalized results for every recipient.
You can use user attributes set up via row level security or centralized row level security
Create your question and then add user-specific filtering. Use zing.user.email for direct assignments or zing.user.department for role-based filtering. You can assign any attribute or set of conditions to determine which data is visible to each user.
Then configure your alert by setting your schedule (daily, weekly, custom), adding recipients, and selecting output formats. Include dashboard images, direct links, or CSV exports.
Importantly, recipients can be both people inside your organization or external parties (e.g. suppliers, clients, etc.) if your organization settings allow.
Turning on External Dashboard / Question Sharing
The administrator (typically the person who created the Zing account) is the only person who can turn external dashboard sharing. To do so:
- Go to the Zing Console on the web and login
- Click on the ‘settings’ tab

- Scroll down to the organizations section and turn ON the option for “Allow invites to email addresses outside domain”
- Click ‘Save’ at the bottom
Users will now be able to invite email addresses which are outside the domain. You may need to close and re-open the for the updated settings to be active.
You can turn off external sharing at any time and access to existing out-of-domain users will be rescinded.
Public Sharing
Public Sharing lets you share a graph with anyone via a link. Data in public charts will be updated once a day.
Turning on Public Sharing
Public sharing is allowed only if external sharing is turned on for the organization.
To create a publicly shareable link or share a dashboard with an external party (different domain) you’ll need to run on external dashboard sharing first.:
- Go to the Zing App.
- Click on a pre-saved question or run a query on a table.
- Click on the Share button on the top of the screen.
- If the “Generate public link” button is available under “Get public link”, click this button to generate a public link for this question or query.

- Re-confirm the public link generation through the confirmation modal.

- Copy the public link and share it with anyone. (If a link is already available to be copied, step 4 and 5 can be skipped.)
Anyone with the link will be able to view this graph by visiting the link.
15 - Row Level Security (RLS)
Row Level Security allows you to control access to data in a database by row, so that a logged in user can only view the data they are authorized for. You will be able to control “Who sees what in the chart?” by including a RLS filter to the question.
For example, let’s consider the question “Performance statistics per employee”. With a RLS filter, you can control the resulting data for this question so that the logged in user would only see their performance statistics as opposed to seeing statistics for all employees.
With Zing Data, the user’s email, username, or ID can be used for dynamic user-specific filtering. Support for other user attributes can be provided based on your requirement. Reach out to our team to integrate other user attributes.
Row Level Security Use Cases
- Employee based RLS - A user can only see information they own/responsible for or tied to (most common filters are email, user ID or username)
- Department based RLS - A user can only see information for the company, department or unit they belong to.
- Role based RLS - A user can only see information assigned to their role (E.g: Manager, Customer, Engineer, etc.)
- Location based RLS - A user can only see information of their specific region or city
Setting up RLS with Zing Data
Pre-requisites
-
Create a data source with a lookup table.
-
The lookup table in your datasource should have a email field (which is the lookup for logged in users in Zing), along with any other attributes you’d like in your lookup table.
Two RLS options

If you’re using question-level RLS
-
Go to your data source in Zing Console and select the ‘Row Level Security’ tab
-
Activate RLS with the toggle on the right
-
Select the lookup table and field
-
Create an additional filter for RLS on the field you require RLS filtering on. This can be done via the Visual Query Builder or via Custom SQL.
- Query Builder

- Custom SQL

- The format of the filter should include zing.user before the name of the filter. For example, to filter by email, the RLS filter should be {{zing.user.email}}.
- The resulting chart for a query with RLS filtering will have different results based on the logged in user.
- Query Builder
If you’re using centralized RLS
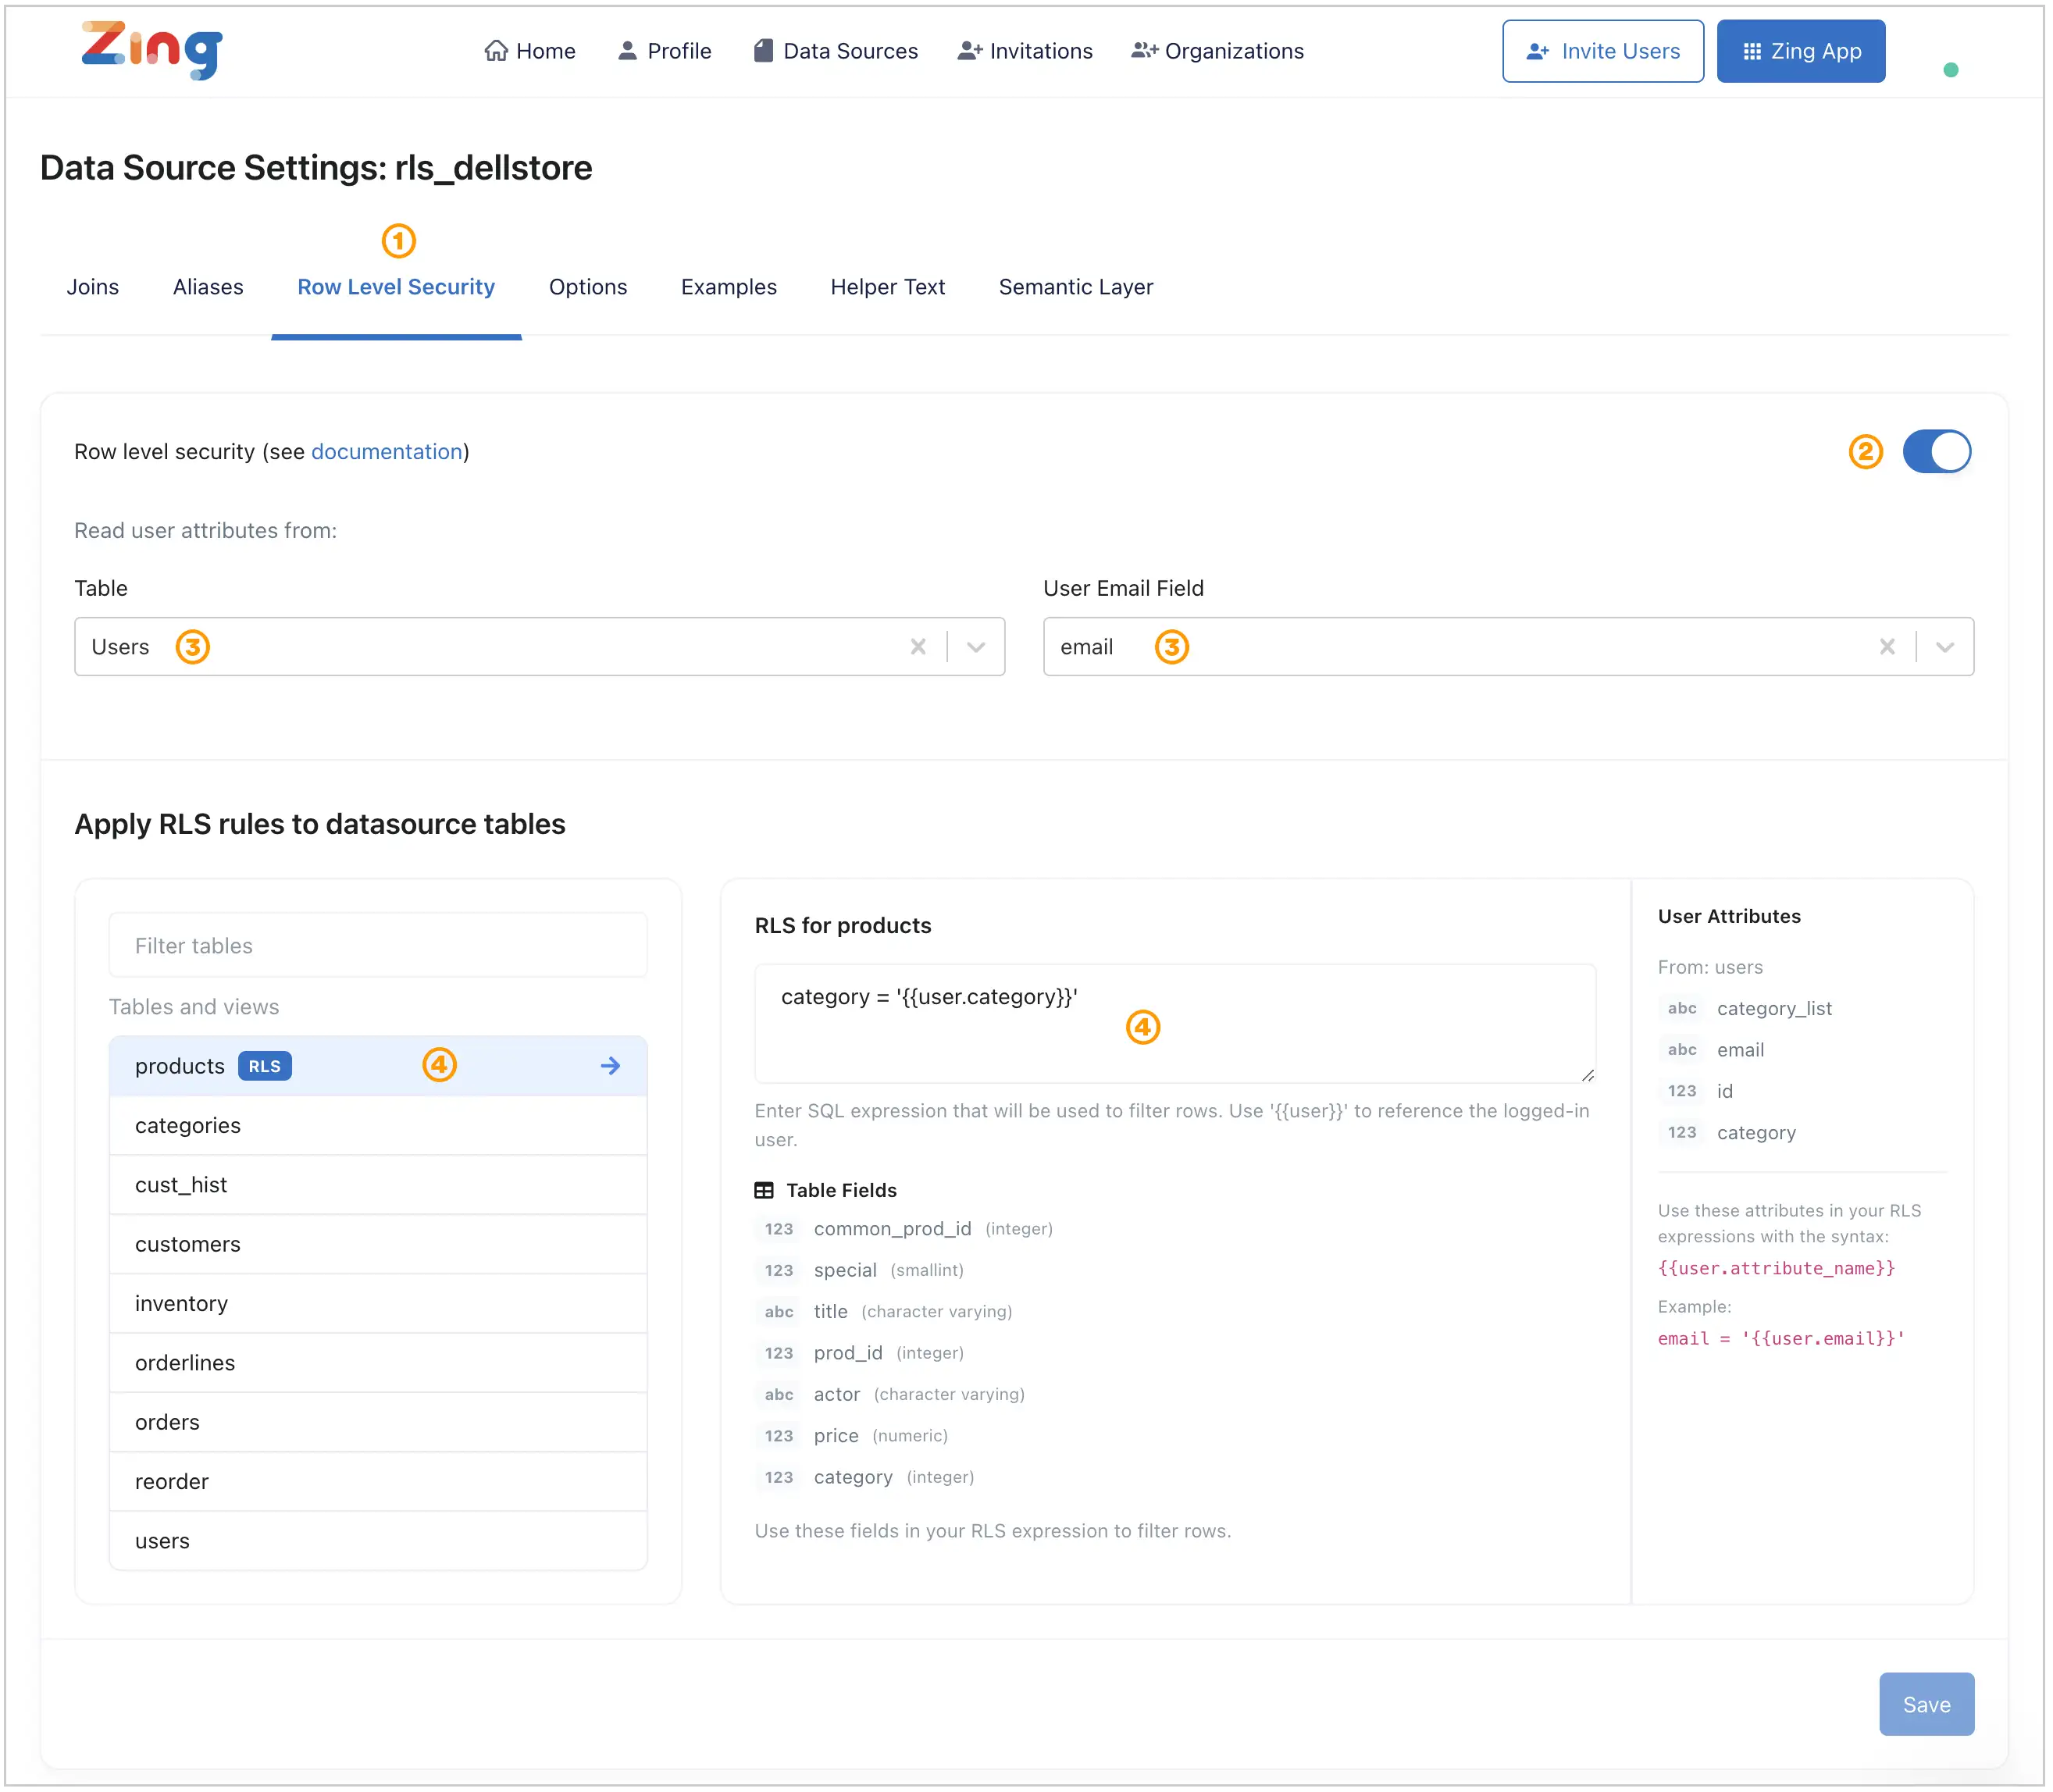
-
Go to your data source in Zing Console and select the ‘Row Level Security’ tab
-
Activate RLS with the toggle on the right
-
Select the lookup table and field
-
Select one of the available tables and enter a SQL expression into the input box that will be used to filter rows. It should evaluate to TRUE for a given row to be accessible to a user.
You can add RLS configurations at the table level using a mix of the lookup attributes or conditions.
 An example RLS condition could be –> email = ‘{{user.email}}’ OR ( ‘{{user.Role}}’ = ‘Manager’ AND ‘{{user.Office_Location}}’ = ‘Boston’)
15.1 - Lookup Tables for RLS
A lookup table allows you to use more user attributes for row level security filtering. For example, without a lookup table you can only use an email field for row level security. By defining a lookup table with user information, you will be able to use any attribute in the table as the RLS filter.
A lookup table can be defined for each of your datasources. The email field is a must have on your lookup table.
Let’s look at an example lookup table.
| user_id | name | role | region | |
|---|---|---|---|---|
| 101 | User1 | user1@acme.com | engineer | east |
| 102 | User2 | user2@acme.com | sales | west |
| 103 | User3 | user3@acme.com | desginer | central |
| 104 | User4 | user4@acme.com | engineer | east |
| 105 | User5 | user5@acme.com | engineer | west |
Specifying a lookup table for a datasource
- Visit the datasource page on the Zing console.
- Click on the Settings button on your datasource.
- Turn on the toggle for Row Level Security.
- Select the table you want to set as the lookup table for the datasource and the email field in that table.
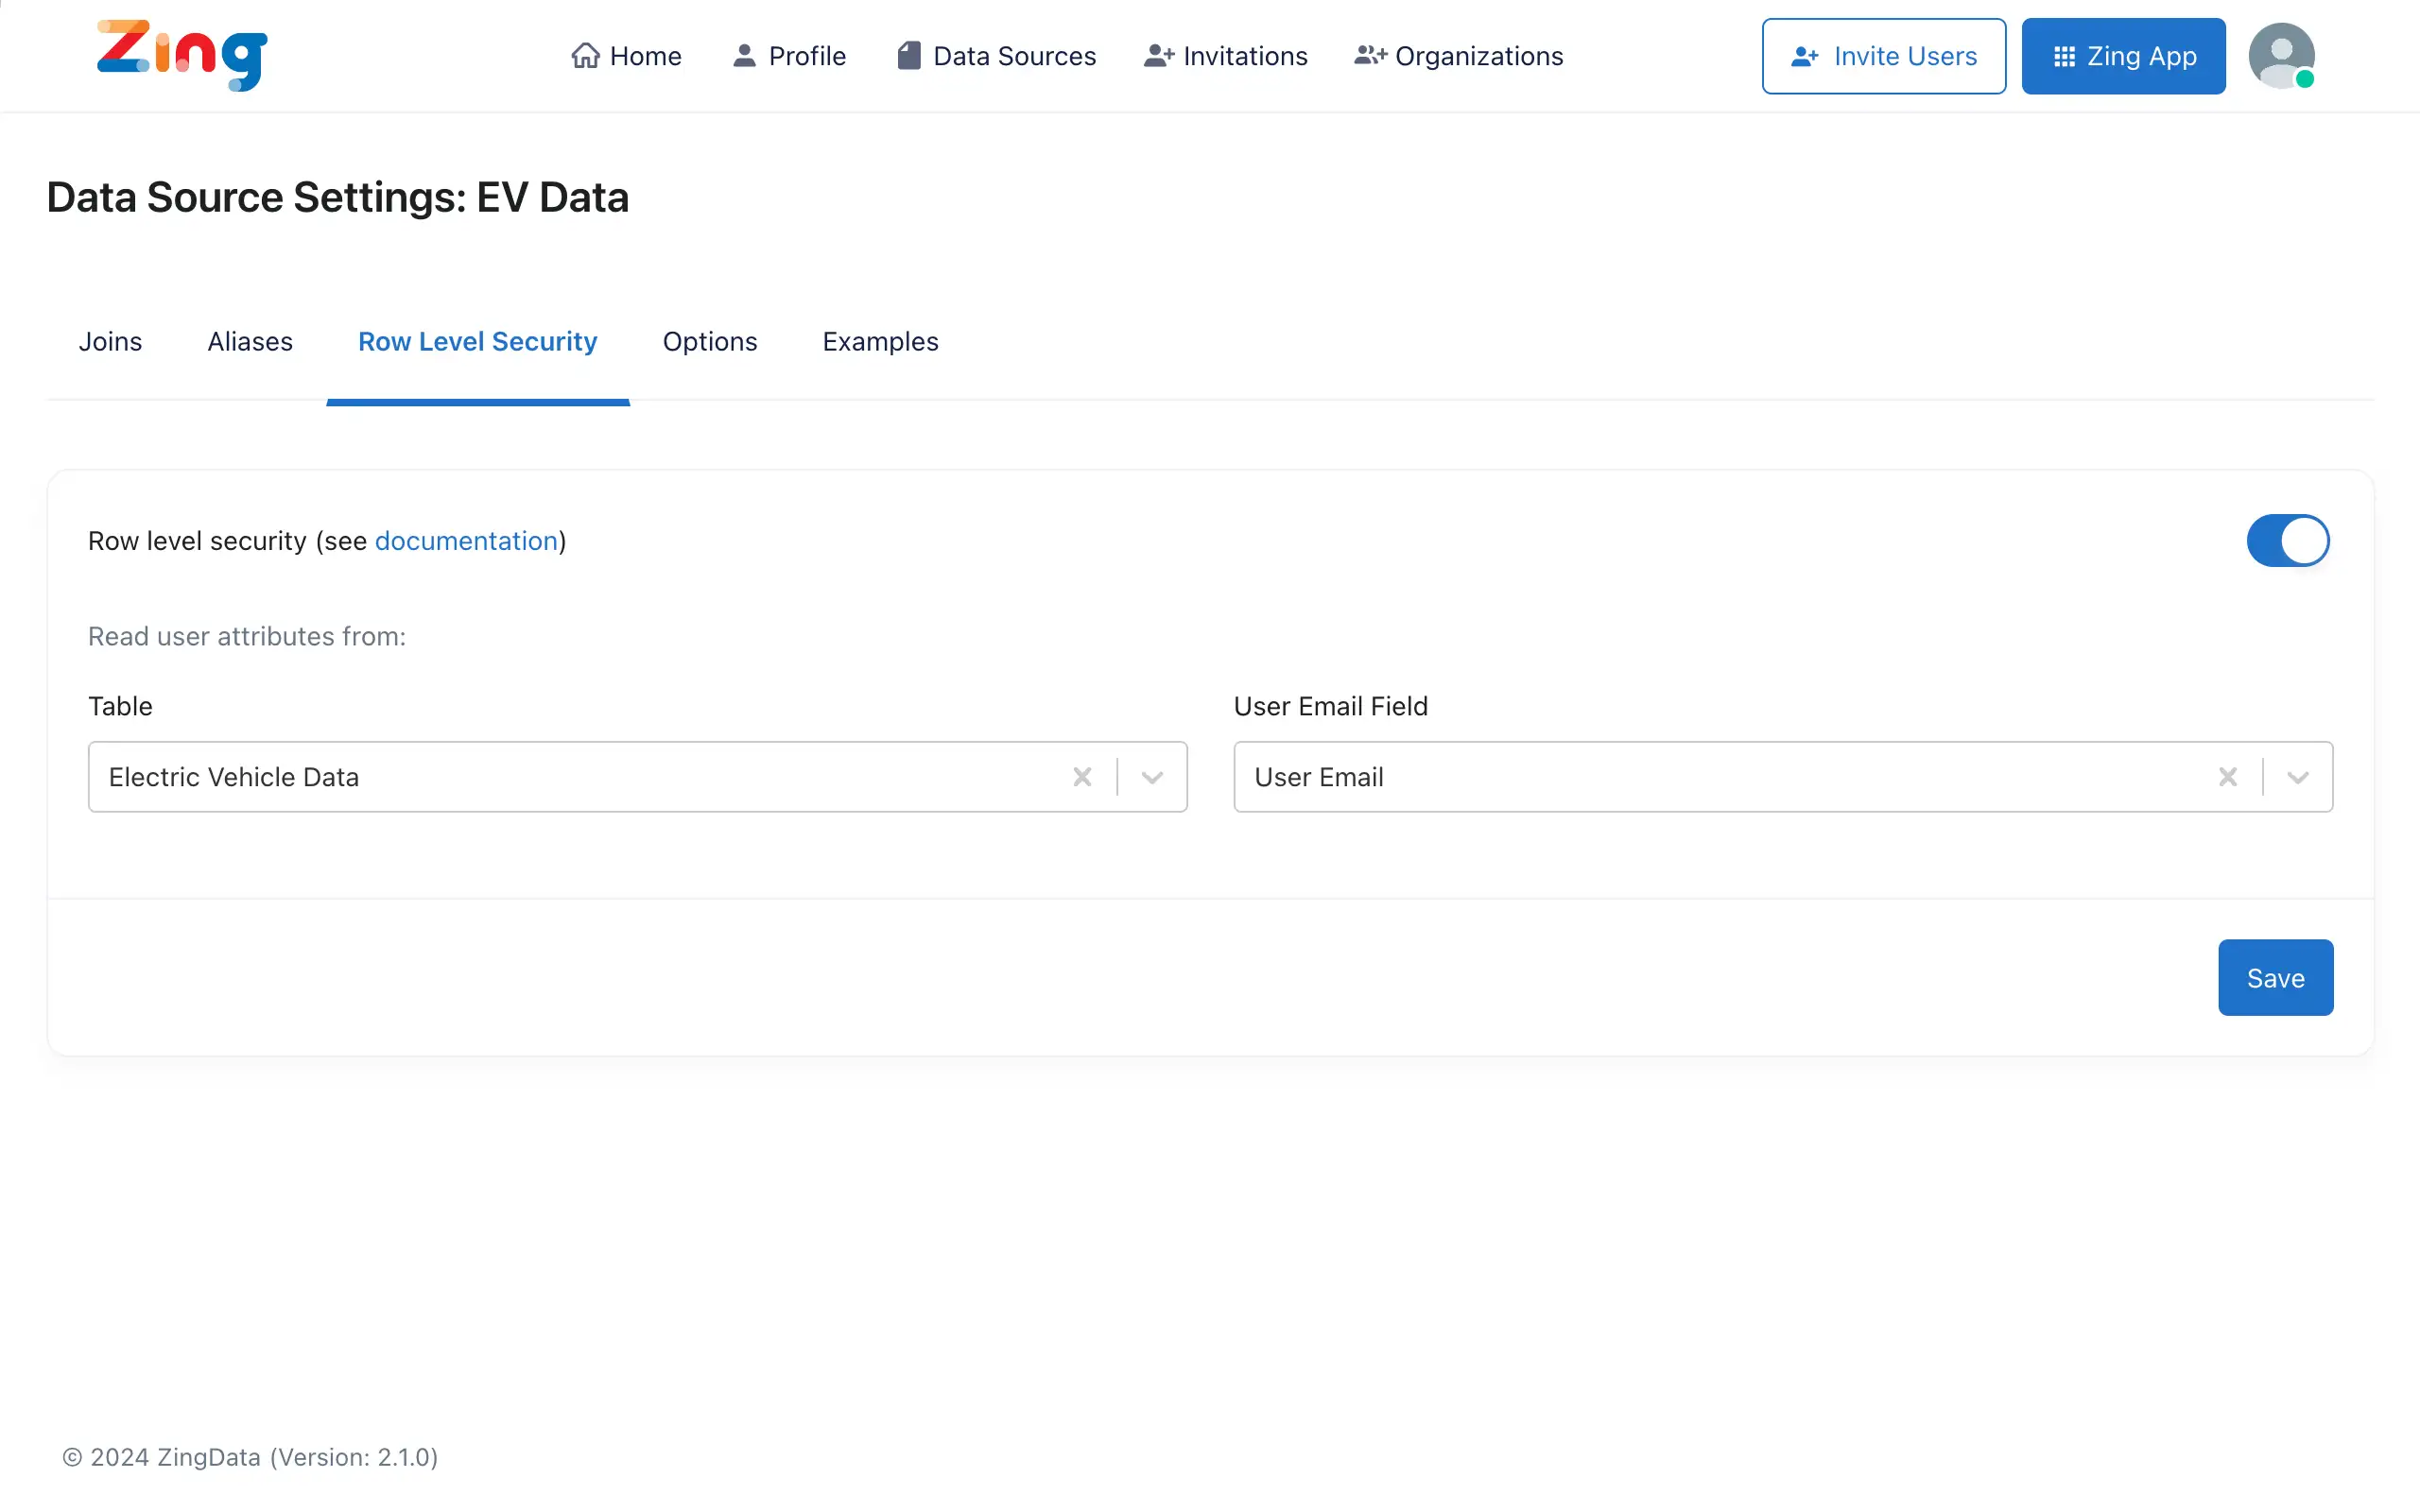
- Now you can specify any filter on your charts/tables as mentioned here using the attributes in your lookup table. For example, if you want to apply the RLS filter on the user’s ID, the filter on the WHERE condition should be {{zing.user.user_id}}. Filtering by the region would be possible by specifying the filter as {{zing.user.region}}.
15.2 - Centralized RLS Setup
Centralized Row Level Security in Zing lets you control what data each user can see based on that user’s attributes and conditions you specify.
Once set up, centralized RLS applies for all user roles (viewer, member, editor, admin), and all query modes (natural language querying, visual querying, SQL IDE).
Centralized RLS differs from simply specifying a user-specific filter when you’re creating question, because it applies the row level filtering as a pre-step, before any query is run.

With centralized RLS, the RLS conditions are always enforced and a user cannot remove the RLS filters like they could if you used lookup tables and user-aware filtering alone. This means even users with an editor role, or those who copy a question and edit it wouldn’t be able to remove the centralized RLS.
When a user is logged in to Zing (or is authenticated in embedded mode), they have an identifier. That identifier and other attributes of that identifier (as specified in a lookup table) are used dynamically at runtime to compare against the conditions you specify.
Note:
- RLS conditions are applied at a table/view level by specifying a SQL condition which would evaluate to TRUE for the rows a user will be able to see.
- Tables/views without any condition specified will have all rows visible to all users.
- Only administrators of an organization can set up or modify centralized RLS.
- Centralized Row Level Security conditions apply to all new and existing questions and dashboards.
- You should verify with a sample question that your RLS conditions are set correctly and working as you expect.
- RLS is compatible with all Zing functionality.
Setting Up Centralized Row Level Security
-
Create a data source then click ‘Settings’ and ‘Row Level Security’
-
Turn on RLS and define a lookup table for user attributes. You’ll have one column indicating the user’s identifier (email), and other columns which will be used as dynamic lookups for that user’s attributes.

Note: this is a live check so updating this table will update the user’s attributes and resulting rows shown on queries that rely on RLS. -
Click on a table or view from the list on the left, and then specify the condition which should evaluate to TRUE if a user is to be shown that row, and FALSE if they shouldn’t see that row based on the condition you specify. For instance:

4. Click ‘save’ and your RLS conditions are immediately applied.
5. Check that the RLS conditions you’ve set are working as you expect and modify them if needed.
16 - Embedded Analytics
Embed Zing’s powerful data visualization and querying capabilities in your own application.
Note: Embedded analytics is available only on the Pro tier, and must be enabled for your account by the Zing team - it is not enabled by default.
Reach out to the Zing team to see a demo and learn more about pricing.
Capabilities
Zing charts, tables, and interactive querying functionality can be embedded in your app via Zing’s React SDK.
Providing users embedded analytics can:
- Improve user retention
- Help users understand their usage of your product and drive upgrades
- Compare performance to peers (e.g. conversion rate compared to peers in a segment)
- Create new revenue sources (such as offering advanced analytics and reporting functionality as an add-on)
Zing’s React SDK allows developers to get up and running with rich charting, querying, and visualization capabilities without having to maintain complex data architecture, or build visualizations from scratch.
Benefit from Zing’s robust data analysis and querying capabilities and get up and running in minutes:
* Easy visual querying
* Natural language based querying
* SQL typehead for power users
* Flexible graph formatting (including specifying colors, date formatting, sorting, and more)
* Export to PNG or CSV
When you’re setting up embedded analytics you can control the features you want to show up on the embeds.
For example, if you want to disallow exporting as a PNG, you can simply turn off that capability in the admin panel and no user will have that option from the embed.
Update frequency
Choose refresh frequency to optimize data freshness while minimizing database load.
Update frequency options include:
- Full-live
- Every minute
- Every 5 minutes
- Every 15 minutes
- Every 30 minutes
- Every hour
Authentication and data visibility
- Inherit user access controls from your app if you’d like to customize end-user experiences based on user id, role, entitlement, or other attributes
- Limit chart visibility to verified sessions for improved security
- Apply chart-level controls
Getting Started
Zing’s embeds also support secure authentication using a Single Sign On provider, session-based authentication, and row level security. Speak to our team to learn more.
16.1 - Setup and Preparation
- Visit the Zing console and click on Organizations.

- The organization that has embeds enabled will have a “Pro” badge.

- Click on Settings for the organization and click on the Embeds tab.
- Generate an API key for your organization (E.g.:
7bf7aa96-dee0-4750-b97c-3bd13864de81).- This API key will be used to authorize the organization for embedded charts/tables.
- Along with the API key, an embed secret will be generated for you which will be used to create an immutable signed URL for your embeds.
- Make sure you don’t expose the API Key or the Embed Secret publicly as this will be used to authenticate your organization.
- Admins of the organization will have the ability to create multiple API keys per organization and activate/deactivate an API key anytime.
Generate Embed IDs for questions
- Create your questions on the Zing Web App or Mobile App.
- To generate an embed ID for a question, click on the three dot menu for a saved question and click on Embed Options.
- All questions embed IDs were generated for, will appear under the Embeds tab on the organization page of the Zing console.

- Embed IDs can be enabled and disabled when required.

Generate Embed IDs for dashboards
- Create your dashboard on the Zing Web App or Mobile App.
- To generate an embed ID for a dashboard, click on the three dot menu for a saved dashboard and click on Embed Options.
- All dashboards embed IDs were generated for, will appear under the Embeds tab on the organization page of the Zing console.

- Embed IDs can be enabled and disabled when required.
16.2 - Integration
In order to embed a chart, your application’s source code needs to be updated based on the below steps.
Server-side (backend)
Step 1 - Create a Secure Session with Zing
A secure session needs to be created with Zing in order to start embedding charts/dashboards. This should be done by calling the API:
POST https://console.getzingdata.com/api/v1/embed-sessions
An example of how to create a Zing session using NodeJS:
const url = 'https://console.getzingdata.com/api/v1/embed-sessions';

const payload = {
 userData: {
  email: loggedInUserEmail,
 },
};

const options = {
 headers: {
  'Content-Type': 'application/json',
  'x-zingdata-api': ZING_API_KEY,
 },
};

const response = await axios.post(url, payload, options);
const oneTimeSessionToken = response.data.token;
This token created by the backend will need to be passed to the frontend for your end user to be able to view an embedded chart. You can expose an API from your backend for the frontend to fetch this token for each chart that you embed. A session token needs to be created for every chart you want to embed.
Step 2 - Generate Signed Embed URL
You can create signed one-time-use URLs for graphs/dashboards, which are more secure because they can’t be reused and are a way to ensure your server has validated each request. In order to generate the signed URL, add a new API endpoint in your server code.
A NodeJS example for this API endpoint is given below.
const crypto = require('crypto');
const uuid = require('uuid');
app.post('/api/generate-url', (req, res) => {
const { embedId, where } = req.body;
const baseUrl = 'https://console.getzingdata.com/embeds';
let parameters = `?nonce=${uuid.v4()}`;
parameters += `×tamp=${Math.floor(new Date().getTime() / 1000)}`;
parameters += `&embedId=${embedId}`;
if (where) {
parameters += `&where=${where}`;
}
const urlWithParameters = baseUrl + parameters;
const signature = crypto
.createHmac('sha256', Buffer.from(process.env.ZING_EMBED_SECRET, 'utf8'))
.update(Buffer.from(urlWithParameters, 'utf8'))
.digest('hex');
const finalUrl = `${urlWithParameters}&signature=${signature}`;
res.json({ url: finalUrl });
});
In here, the ZING_EMBED_SECRET is read from an environment variable.
Now let’s move on to the frontend updates.
Client-side (frontend)
-
Contact the Zing team and obtain the Zing key (REACT_APP_ZING_KEY).
-
Install the Zing SDK on your application’s front-end.
From NPM:
npm install --save @zingdata/zingdata-react
- Import the Zing CSS file in your main HTML or CSS file.
import "@zingdata/zingdata-react/dist/zing.css";
-
Call the API endpoint that you defined in your backend to fetch the Zing session token for each chart (E.g: zingToken).
-
Call the API endpoint that you defined in your backend to generate the signed embed URL for each chart.
- Payload should contain the embedId of the question and the where property (If dynamic filtering is required - where property is optional. More information about the where condition is given at the end of this guide.)
- This should be done for each embedded chart/dashboard in your application, as each chart/dashboard will have an immutable URL.
const fetchUrl = async (embedId, where) => {
  const result = await axios.post(
   '/api/generate-url',
   {
    embedId: embedId,
    where: where,
   },
   {
    headers: {
     'Content-Type': 'application/json',
    },
   }
  );

  return result?.data?.url;
};

// Call the above function to fetch the generated URL
const signedUrl = await fetchUrl(embedId, where);
- Embed the chart using the SDK
Include the below code on the page where the chart/dashboard needs to be rendered.
import { ZingDataEmbed } from '@zingdata/zingdata-react';

<ZingDataEmbed
  embedUrl={signedUrl}
  apiKey={process.env.REACT_APP_ZING_API_KEY}
  token={zingToken}
  zingKey={process.env.REACT_APP_ZING_KEY}
  className="mt-5" // optional
/>
- An optional className parameter can be passed to ZingDataEmbed if you need any custom styles to be applied to the container.
- embedUrl, token and apiKey properties are required.
- A question can be filtered from your application’s source code by adding a chart property: where. For instance, you could filter based on city, company, or any other field in your datasource to customize the chart to a specific context. The example below shows filtering based on the city.
where={JSON.stringify({
  queryConstruct: {
    where: [{
      column: ['Prospect City'],
      condition: '!=',
      values: 'Boston'
    }]
  }
})}
This condition needs to be passed to the fetchUrl function in step 3 to be included in the signed URL.
Multiple conditions can be added to the where property as follows.
where={JSON.stringify({
  queryConstruct: {
    where: [
      {
        column: ['Prospect City'],
        condition: '!=',
        values: 'Boston'
      },
      {
        column: ['Year'],
        condition: '=',
        values: '2023'
      },
    ]
  }
})}
The where property can have the following conditions.
- Equals (=) only returns results which match the value you input (e.g. “City = ‘New York’” will return results only where the city field for that row equals New York).
- Does Not Equal (!=) returns results which do not match the value you input (e.g. “City != ‘New York’” would return all cities except New York).
- Greater than (>) returns results which are greater than the value you input.
- Greater than or equal (>=) returns results which are greater than or equal to the value you input.
- Less than (<) returns results which are less than the value you input.
- Less than or equal (<=) returns results which are less than or equal to the value you input.
- Between (between) returns results which are between the two values you specify. For date fields this will be two dates.
- Includes (includes) returns results which include part or all of the value you input. For instance “City includes ‘San’” would return “San Francisco” and “San Diego” if those values are present in the data.
- Excludes (excludes) returns results which do not include any of the value you input. For instance “City excludes ‘San’” would return all cities which do not contain “San” in their name so “New York” and “Boston” would be part of the result set, but “San Diego” and “San Francisco” would not.
where conditions should not be defined for user specific data.
- Multiple charts/tables/dashboards can be embedded by using an embed ID for each chart/table/dashboard.
16.3 - Row Level Security for Embedded Charts
Row Level Security allows you to control access to data in a database by row, so that a logged in user can only view the data they are authorized for. You will be able to control “Who sees what in the chart?” by including a RLS filter to the question.
Steps
- Ask a question via the Zing Web App or Mobile App with a Row Level Security filter. Refer this guide for more information on how to create a question with an RLS filter.
- Embed the chart by following the steps under the Setup and Preparation and the Integration sections.
- Send the logged in user’s data when creating a session with Zing via your backend code. The information sent in the payload will be used for RLS filtering.
An example of how to create a session token in NodeJS is shown below.
const url = 'https://console.getzingdata.com/api/v1/embed-sessions';

const payload = {
 userData: {
  email: loggedInUserEmail,
  role: loggedInUserRole,
  username: loggedInUserUsername,
  name: loggedInUserName,
 },
};

const options = {
 headers: {
  'Content-Type': 'application/json',
  'x-zingdata-api': ZING_API_KEY,
 },
};

const response = await axios.post(url, payload, options);
const oneTimeSessionToken = response.data.token;
How to use this one-time token is explained in the Integration steps.
That’s it. 🎉
The resulting chart for a query with RLS filtering will have different results based on the logged in user in your application. By excluding certain data from the dataset based on the logged in user would reduce access of data by users who are unauthorized to view them.
17 - Partner Integrations
Zing Data has tested and verified connections with trusted partners.
Set up multiple data sources to seamlessly view tables and questions from across all your database sources all in one screen.
PostgreSQL

Postgres is one of the most commonly used databases in the world, is open source, and has around for 30+ years. Zing Data connects to any PostgreSQL database and has been tested with thousands of tables and for long-running queries. Zing also supports multiple schema within a Postgres database.
MySQL

MySQL is one of the world’s most popular databases, now owned by Oracle. Zing Data connects to any MySQL database, tested to thousands of tables and for long-running queries.
Google BigQuery

Google BigQuery is a powerful, cloud-hosted database that scales to huge data volumes easily. Available with a free-to-try version, BigQuery is an easy way to get up data in the cloud without having to deal with hosting, database maintenance, or database optimization. Zing is a trusted Google Cloud Partner, verified by the team at Google to work with Google BigQuery.
Snowflake
![]()
Snowflake is a cloud-based data warehouse that is popular for ingesting, transforming, and querying data from many sources. Available with a free-to-try version, Snowflake is an easy way to get up data in the cloud without having to deal with hosting, database maintenance, or database optimization.
Google Sheets, Microsoft Excel, and CSV files
![]()
Google Sheets and Microsoft Excel are commonly used spreadsheets. Other common data analysis tools and spreadsheet programs allow saving files as comma separated values. Zing can connect to data from these sources via the Google Sheets Integration.
Zing also supports two modes for Google Sheets:
- Live connection mode, where Zing always pulls from the latest version of the sheet
- Snapshot mode which ‘freezes’ the gSheet at the point you make the connection, so subsequent changes to the sheet won’t be reflected in Zing.
Trino, Presto, And Starburst
![]()
Trino is a fast, distributed query engine that can support large queries and heavy analytics workloads. It is free and open source, and is a successor to the open source Presto query engine.
A hosted and well-supported version of Trino is available from Starburst.io. Zing has been tested to work with all three variants. Find out more about how Zing and Starburst can work together here!
Databricks
![]()
Databricks is a cloud data warehouse and lakehouse that runs on Amazon Web Services, Google Cloud Platform, and Microsoft Azure.
Created by the people behind Apache Spark, Databricks is able to support large-scale workloads and the SQL Warehouse functionality provided allows you to set scaling and timeouts to optimize cloud spend.
Zing is an official Databricks partner. Learn more here!
Mozart Data
![]()
Mozart Data is a full-service modern data platform for centralizing, organizing, data across multiple sources. Get set up in an hour and start working with support from Mozart’s data analysts. Mozart lets you pull data from more than 200 data sources and join across them including Salesforce, Google Analytics, Adobe Analytics, Amazon S3, Hubspot, Facebook Ads, Square, Stripe, and SAP Concur.
Microsoft SQL Server
![]()
Microsoft SQL Server is one of the most widely used databases for enterprise deployments, developed by Microsoft. MS SQL is scalable and includes ETL (Extract, Transform and Load) tools and reporting services. It is evolving rapidly in the cloud and on hybrid platforms. You can get Zing connected to your MS SQL database with our set-up guide here
Clickhouse
![]()
Clickhouse is an open-source database management system (DBMS) for online analytical processing (OLAP). It uses a column-based structure. Clickhouse was designed to be fast and highly-scalable. Clickhouse stands out for high performance because it gives attention to low level details when performing queries. Get connected to your Clickhouse database with our set-up guide here
Portable
![]()
Portable’s self-service ELT product makes it simple to replicate data from 250+ business applications to your data warehouse with no-code.
Cube JS

Cube is a cloud infrastructure layer that lets you connect to MongoDB, Postgres, Athena, Bigquery, mySQL, Hive, Snowflake, and other databases to transform underlying data sources into more easily queryable and visualizable data. They have a free tier, and are a great way to get started with Zing for data sources that Zing doesn’t yet natively support, or where data transformation is needed. This video walks you through how to use Cube’s SQL API with Zing.
Hydra
![]()
Hydra is an open source cloud data warehouse built on Postgres that offers high uptime and scales to large datasets easily. Zing can connect to Hydra as a Postgres data source to enable easy analytics on even large warehouse datasets. Follow the Postgres setup instructions here to get set up.
Agile Data
![]()
Agile Data is a data automation tool which provides data to Zing so you can easily take action. Agile Data supports business analyst and data analyst teams to translate business questions into repeatable data.
18 - Migrating from other SQL clients
Zing alongside other tools
Zing works well alongside existing analytics tools. For instance, you may use Jupyter notebooks for your data science team’s analysis, alongside with Zing to enable more lightweight analysis to the broader organization.
While Zing is optimized for asking questions easily with simple tap-to-select actions, sometimes you’ll have more complex questions that require SQL, such as joins, text parsing, JSON parsing, and more.
You may already have those questions created in an existing querying tools such as:
- Metabase
- Apache Superset
- Alation
- SQLGate
- Postico
- PopSQL
- Adminer Editor
- Valentina
- DBeaver
- SQuirrel SQL
- HeidiSQL
- RazorSQL
You can bring them over to Zing by simply copying + pasting SQL into Zing to enable powerful collaboration with your team and access data from Zing’s mobile apps on iOS and Android.
Bring questions over to Zing
-
Sign up and set up your database source in Zing (instructions here)
-
From your other SQL tool, simply copy the SQL for a question you’d like to ask
-
Open the Zing web app, iOS app, or Android app and click a table
-
Tap the three dots in the upper left and then “Write Custom SQL”

- Paste in your custom SQL and then click ‘Run’
You can now:
- Save this question to make it available to anybody you’d like to share it with
- Chat and @mention people
- Export CSV tables
- Enable collaborators to clone your query
- View these results across web, iOS, and Android
19 - Joins
Querying more than one table in a datasource is a common use case when analyzing data. This can usually be done by using custom SQL statements. However, this requires the knowledge of SQL syntax. With JOINS in Zing Data, you can easily create JOINS between tables or views using our web console, or while asking a question.
Zing also supports joins on multiple fields at once.
This feature is available for all datasource types on Zing Data except Live Google Sheets. It is available for imported files such as Excel and CSV files.
Features
- Create
JOINSbetween two or more tables. You can create a singleJOINor a set ofJOINS. - Pick from different
JOINtypes such asLEFT JOIN,RIGHT JOIN,INNER JOINandFULL JOINto logically connect your tables and views. - Query the joined tables/views directly without having to write any SQL statements.
- Save storage costs and reduce administration overhead as Zing Data creates an internal representation of the
JOINyou create.
Let’s look at how to create a JOIN on Zing Data.
Create a Datasource
- Login to the Zing Data console and create a datasource.
- Click on the “Settings” button for the datasource on the Data Sources page.
Create a Join using Web Console
- Click on the “Add New Join” button which will take you to a canvas where you can create your
JOIN.
- The tables in your datasource will be displayed on the sidebar. Drag a table to the canvas to start creating your
JOIN. The first table you drag will be considered as the root table for theJOIN. The header of this table will be highlighted in blue. - Drag another table to the canvas.
- You can create a connection between these two tables by placing the cursor on the right hand side of a field (the cursor will turn to a
plussign) on the first table and dragging a line towards the left side of one of the fields from the second table. - You can change the type of the
JOINby clicking on theJOINicon and selecting aJOINtype from the dropdown menu. - You can also have joins between tables that use multiple fields. Simply draw multiple lines between table fields.
- If you need to connect another table in this
JOIN, you can drag another table and follow the same steps as above. - Give the
JOINa name and click “Save”.

Create a Join using Natural Language (Magic Model)
1. Ask a question using natural language in Zing via the the search bar.
- If there is an existing join you’ve created using the UI that is appropriate to answer the question asked, Zing will use that.
- If no join exists which would allow the question to be answered, Zing will create a join using AI between multiple tables on the fly based on the field names and attributes. More detail about this feature is available here.
- If there is no relevant existing join and the AI cannot determine an appropriate join to answer the question, Zing will notify you that it could not determine the necessary tables / views to answer the question. You can then manually create a join by scrolling down to the bottom of the field list and tapping ’edit join’ or ‘add new join’

2. You will see if a join was pre-existing or was created with AI on the fly as indicated by a star icon. You can create or modify a join by tapping ’edit join’ which will display the full join relationship and will let you define:
- Left Join
- Right Join
- Outer Join
- Inner Join
Note that you can define as many join relationships within a join as you’d like. Any table / view present in the join must connect to others in the join.
Create a Join with the SwiftQuery interactive builder
1. Click a table using the SwiftQuery interactive builder
2. You’ll see a list of fields and tables on the right hand side. At the bottom of the list of fields, click the ‘add new join’ button

3. Choose the join type (inner, outer, left, right) you’d like and the ’left’ table and ‘right’ table along with the join fields
4. Hit ‘save’ and the list of all fields from all joined tables / views will be visible
Note that you can create as many join relationships as you’d like. Just click ‘add relationship’ in the join creation screen within SwiftQuery to add another join.

Create a Join using SQL
1. Ask a question using custom SQL. Access custom SQL from the Zing App by clicking on the three dots next to ‘run’ in the visual query builder.
2. You’ll see a list of fields and tables on the right hand side. Write the joins you’d like to create in SQL.
Editing a Join in Web Console
- Once you’ve created a
JOIN, it will appear under the “Joins” tab in your datasource settings. - Click on the “Edit” button to update your
JOIN, or click on the “Delete” button to remove theJOIN. - You can create/edit/delete
JOINSfrom this page.
The features of the JOINS canvas are shown below.
Editing a Join in Zing App
- From SwiftQuery builder, you can edit an existing join that has been created by clicking ’edit join’
- You can add additional join relationships here, edit join relationships, or delete joins from this page.
Querying an existing Join
- Click on the “Zing App” button to navigate to the Zing Data Web App.
- Querying a
JOINcan be done on the Web App as well the Mobile App. - You will see the created
JOINunder “Tables and Joins” on the home page. - Click on the
JOIN. You will be navigated to the Swift Query builder where you can ask a question. - Fields from all tables in the
JOINwill be available for you to start querying.

More information about how to ask a question can be found here.
20 - Troubleshooting
List of common solutions to help with data source connections.
20.1 - Connnecting to AWS RDS
Zing Data can connect to any AWS RDS database, but there are a few steps to go through to allow Zing’s platform to access.
Steps
- Go to your AWS console
- Go to RDS and select the database you want to view on Zing Data.
- Then look for the security group shown below

- Confirm that the instance is
Publicly Accessible

- Now hit the edit button for the inbound rules for the security group.

- Add a single rule for the database type and port that it is running on. The screenshot shows two inbound rules that have been added for mySQL on standard port 3306 and one for Postgres on standard port 5432. The IP address for Zing Data’s platform is
34.75.82.6
- That’s it. You’re done!
20.2 - Natural Language Queries
There are three primary methods to more precisely control Natural Language responses in Zing:
- Examples: Define specific examples to clarify ambiguous terms and calculations.
- Regular
- Analysis Question
- Run question as custom SQL if exact match
- Aliases: Create human-readable labels for databases, fields, and calculations to improve query interpretation.
- Exact Responses: Specify exact SQL queries for complex or highly specific questions.
1.1 Example: Regular
Even the best AI needs a little bit of help from time to time to understand your data and questions better. With Zing, you can clarify ambiguous terms and calculations quickly by adding a few training examples to your data source.
Ambiguous terms are words or phrases that have multiple meanings or interpretations, which can lead to confusion or inaccuracies in the AI’s response. For example, the word “bark” can refer to the sound a dog makes or the outer covering of a tree, and without context, an AI might not understand which meaning is intended.
Similarly, ambiguous calculations are those where the operations or variables are not clearly defined or could be interpreted in multiple ways. For example, if someone asks an AI to “calculate the increase,” without specifying what to increase, by how much, or over what time period, the AI would not be able to provide a correct answer.
Example Question and how to fine tune the response
Q: How many trips are long by plan type?
Task: We want to define “long” as being greater than 10 minutes
Step 1: Go to Zing Console and select a data source
- Web console: https://console.getzingdata.com/
- Select your data source you want to train AI on
- Go to the Examples tab and enter your questions and corresponding SQL.
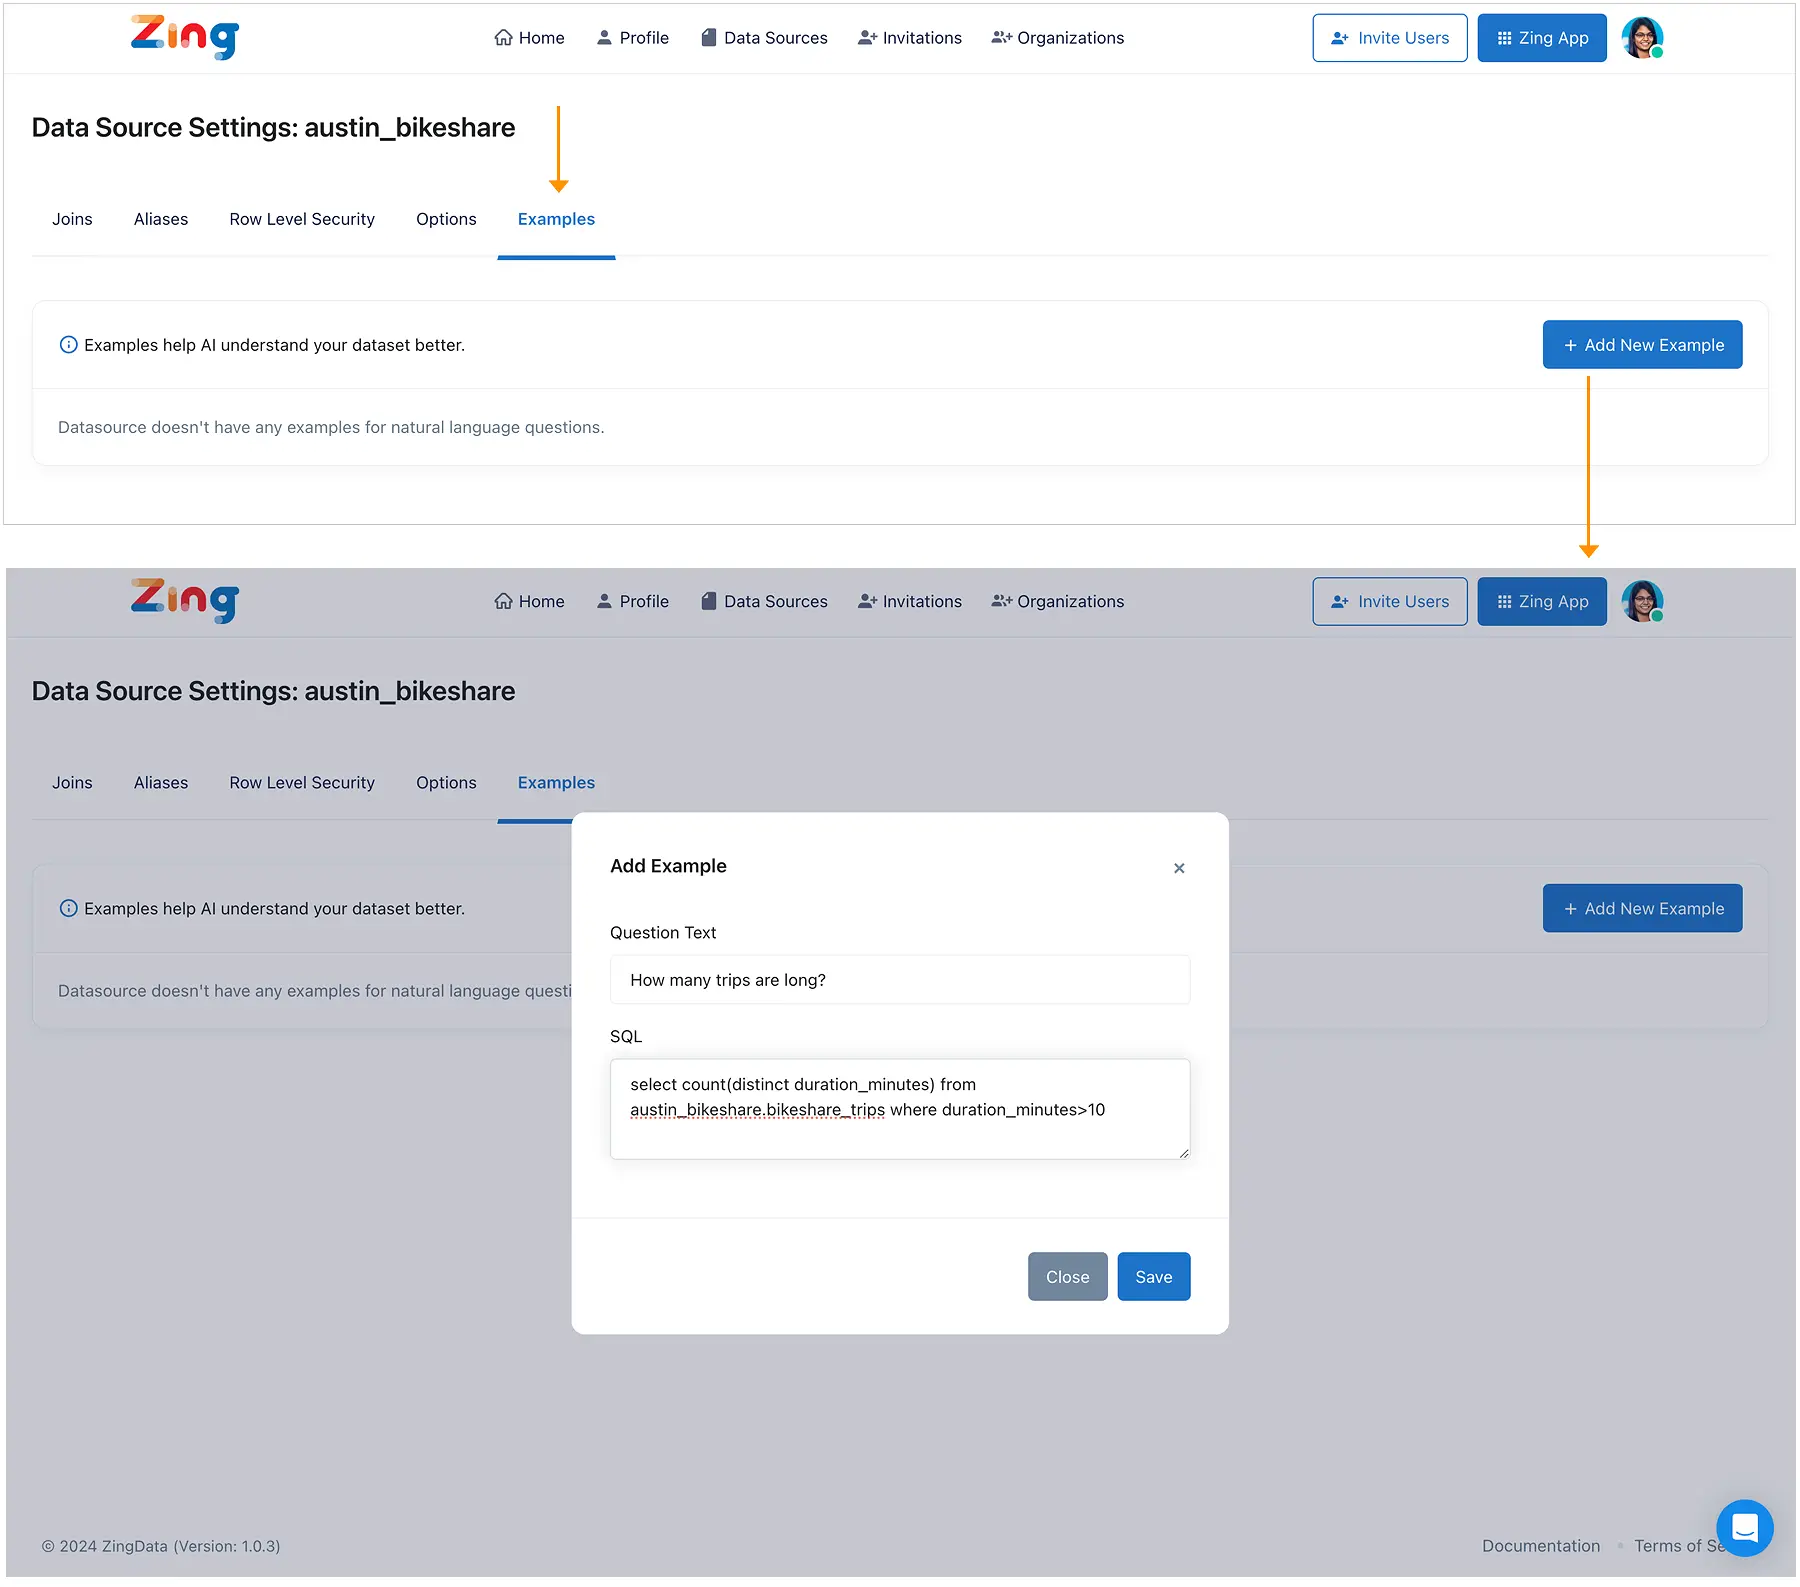
Step 2: Go to Zing App
Ask “How many trips are long by plan type?” and see how AI is now showing a visualization with a filter automatically applied with trips that are longer than 10 minutes!
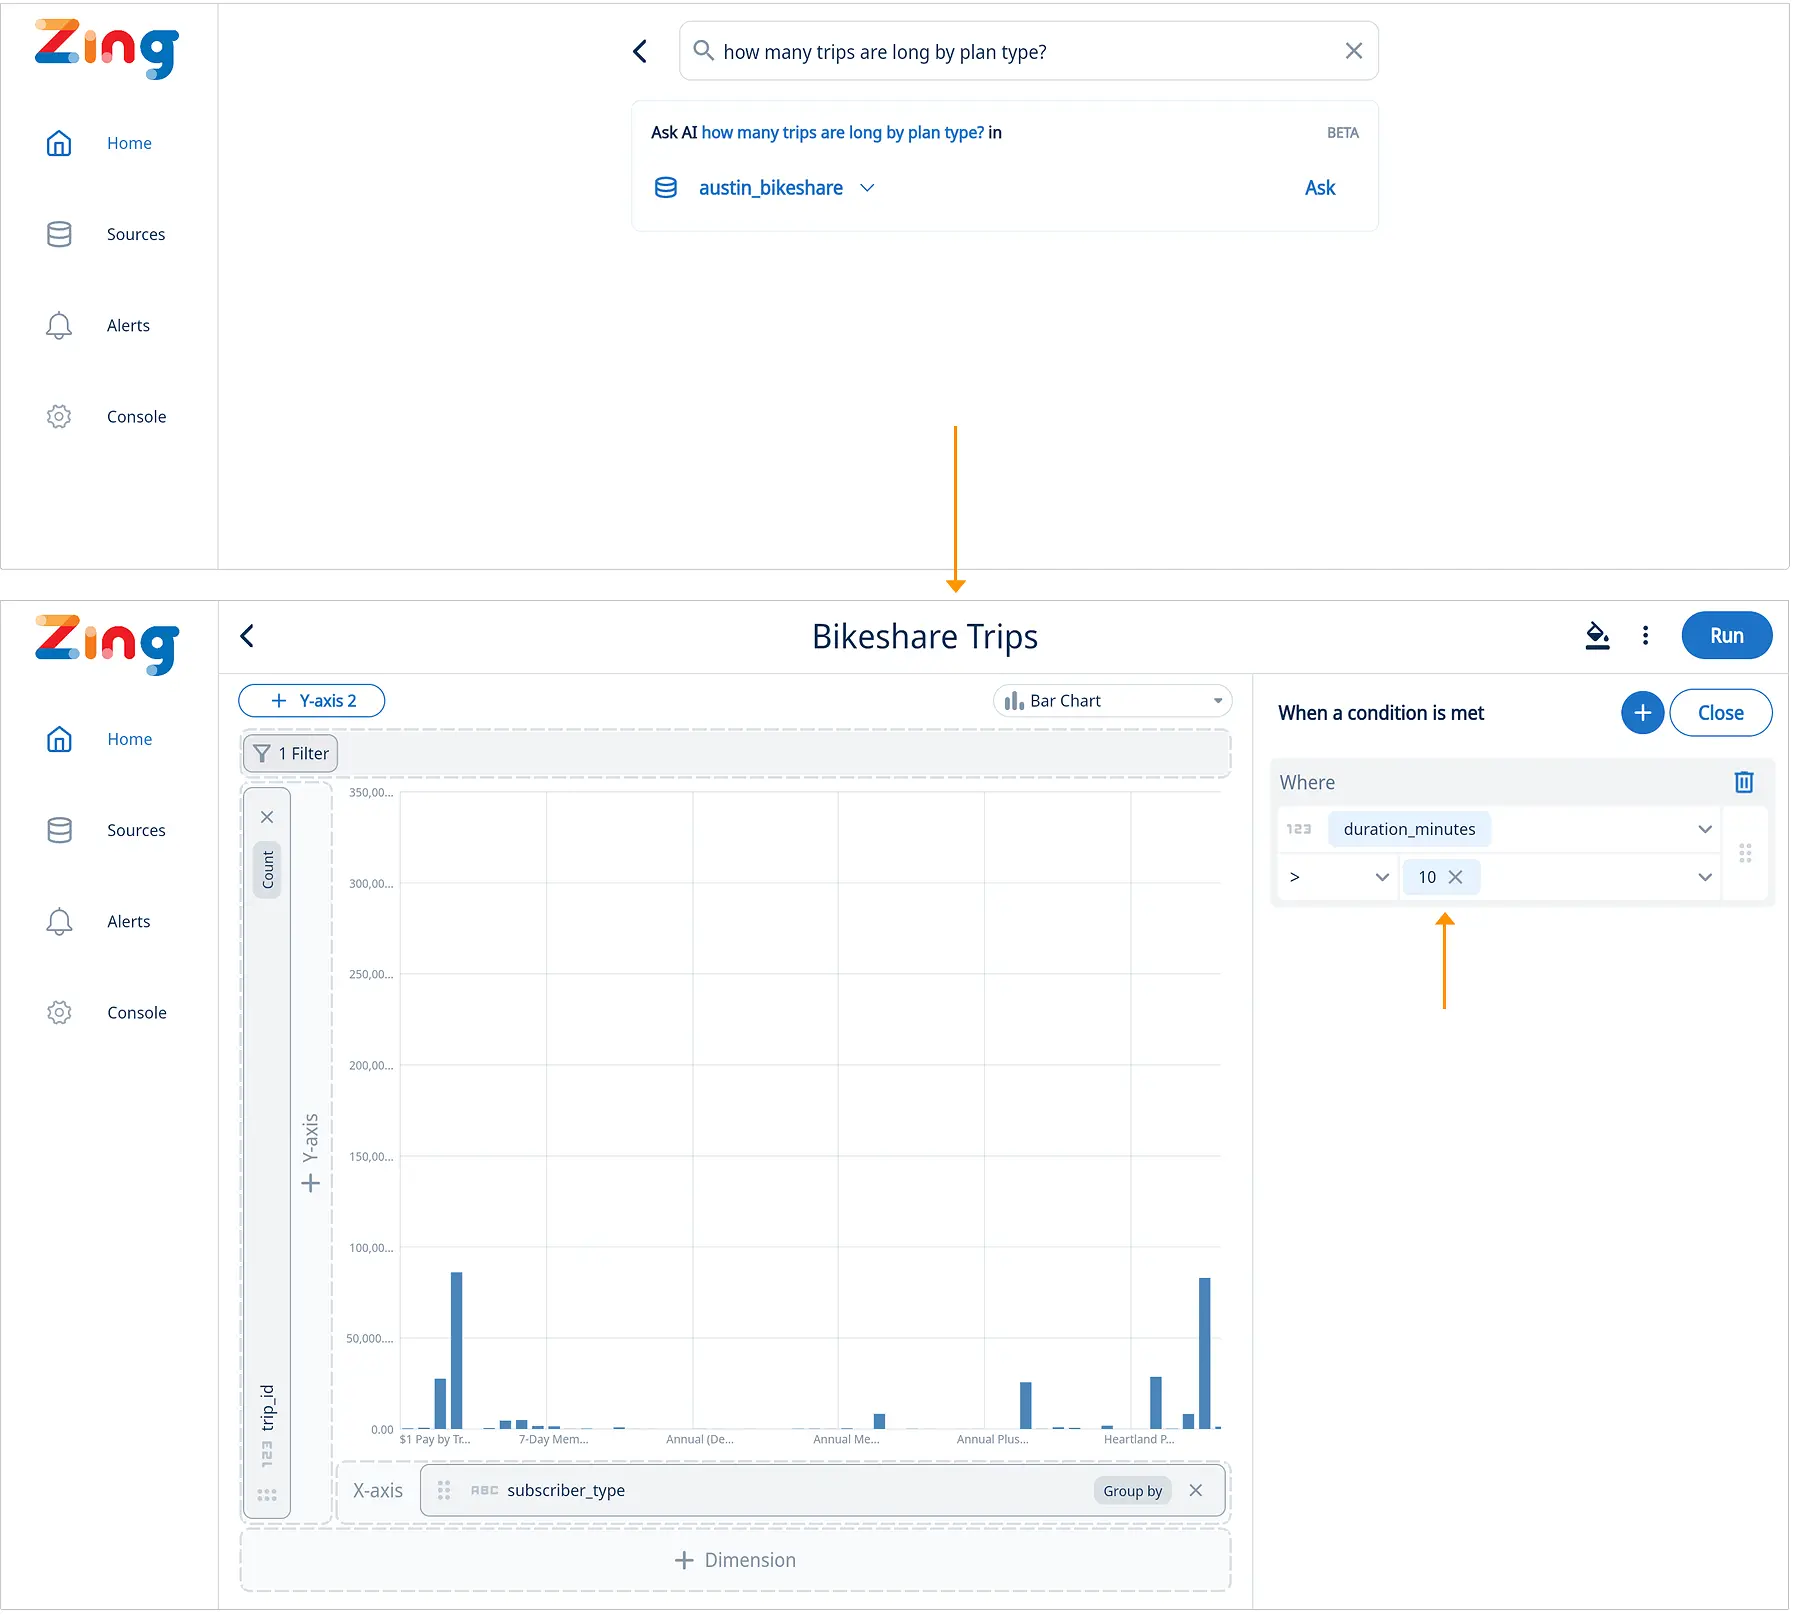
2. Aliases
Creating human-readable labels ensures your analysis is easily understood by others.
With Zing, you can alias databases, fields, and calculations, enhancing clarity and interpretability across all queries.
To Create a Database Alias:
- Go to the data source ’edit’ screen in the Zing Data web console.
- Specify a display name; this will be shown within the Zing app.
- If left blank, the original database name will be used.
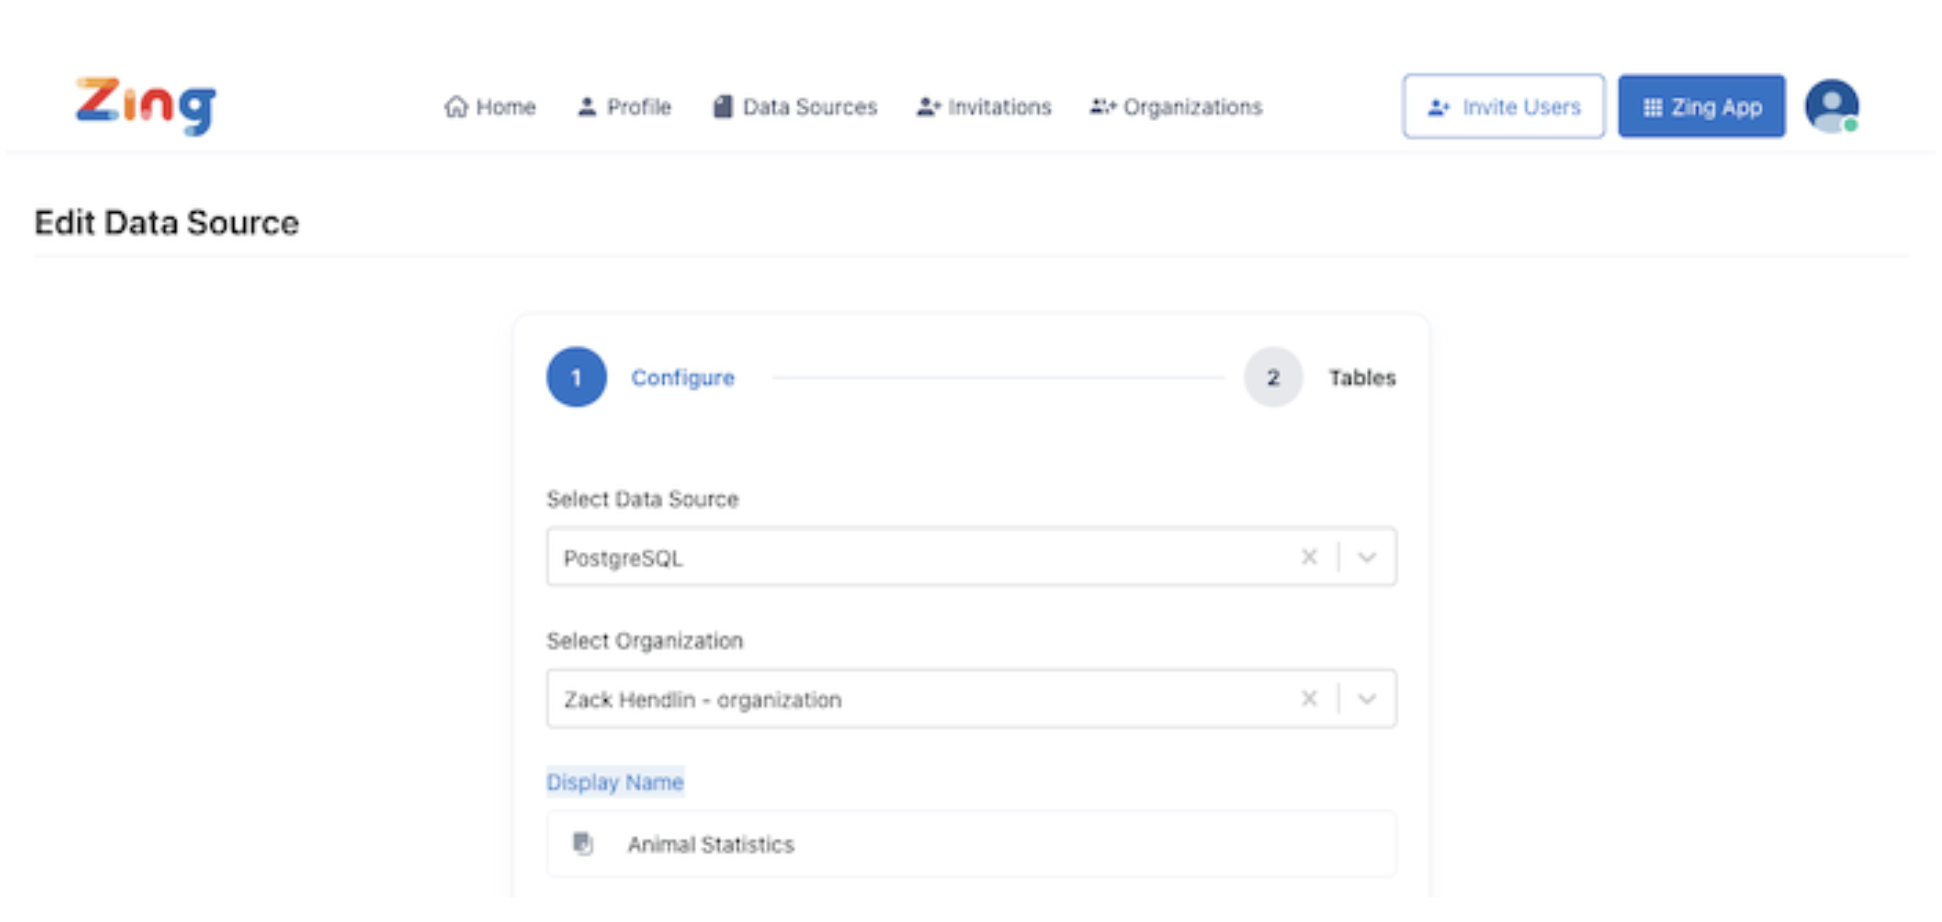
To Create a Field Alias:
- Go to the data source settings in the Zing web console.
- Select ‘alias’ and then ‘add/edit.’
- Choose the fields to alias and save.
These aliases help the AI translate natural language questions into accurate query results.
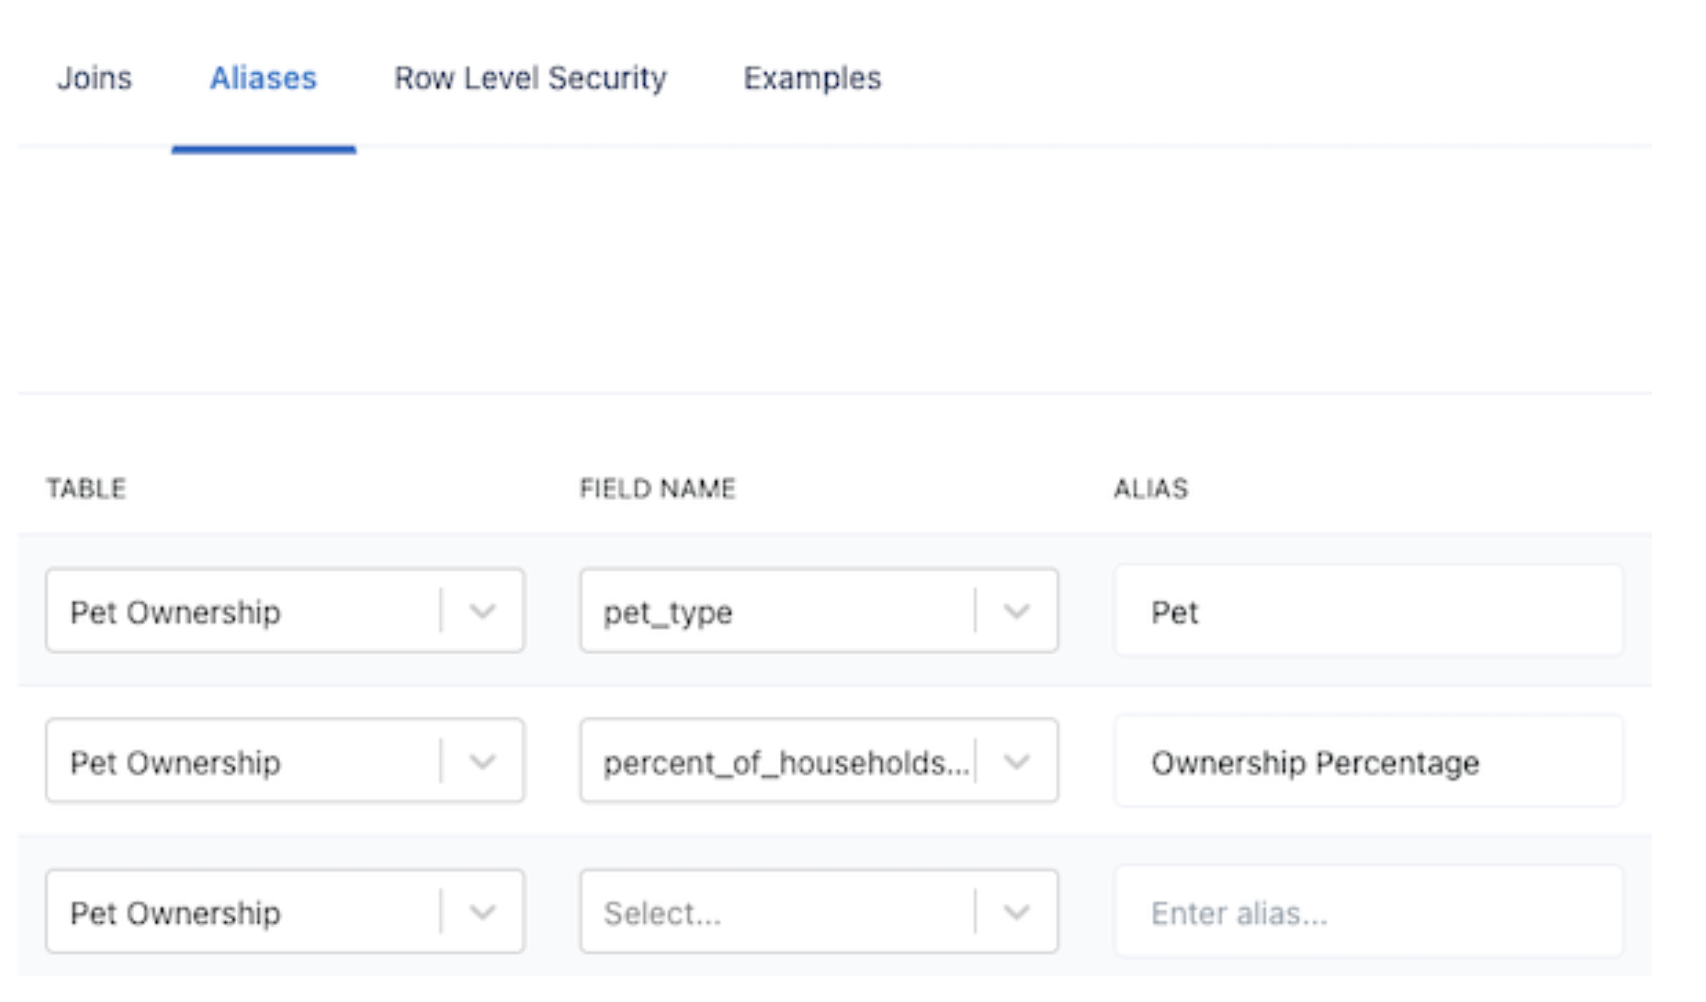
To Create a Calculation Alias:
- Go to the data source settings and navigate to the Examples tab.
- Create a new example by specifying the question text and corresponding SQL.
For example, defining “utilization” as select sum(hours_worked)/sum(hours_available) as utilization from mytable allows you to use “utilization” in natural language queries effectively.
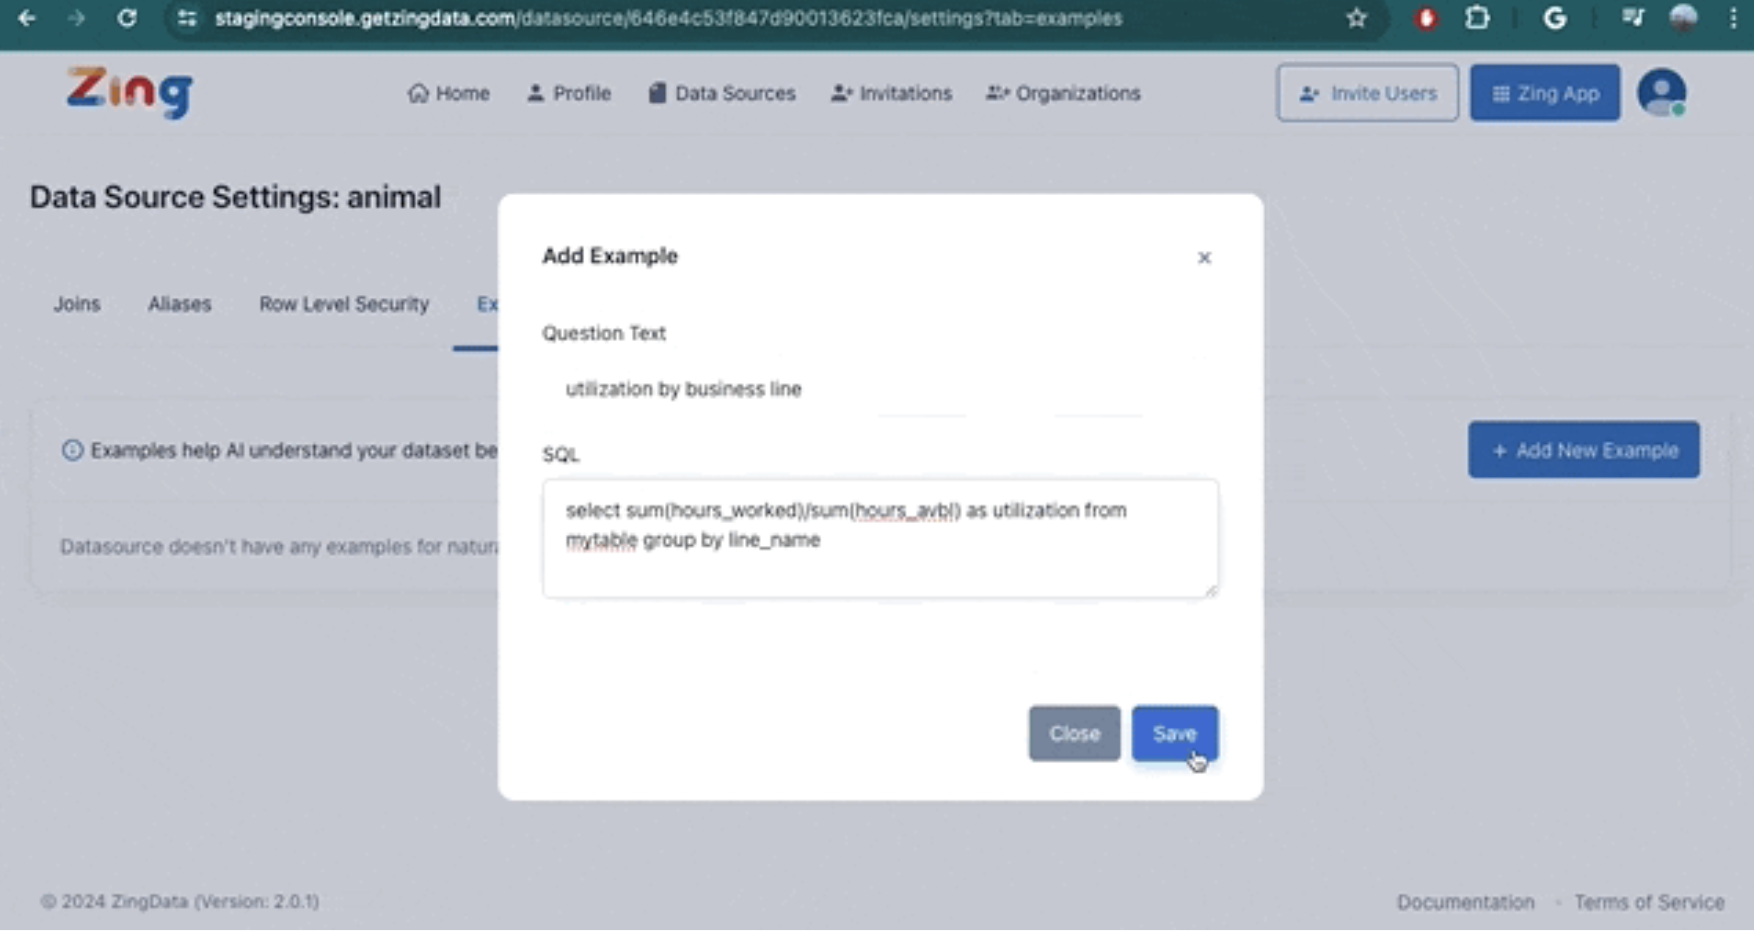
3. Creating Exact Responses
Sometimes a question requires SQL complexity beyond what SwiftQuery can handle. In these cases, you can define an exact response that the AI will use.
How It Works:
- When a user asks a question that matches an exact response, the AI will run the specified SQL directly.
- Exact responses can include complex SQL, including CTEs and subqueries.
Please Note:
-
Define a question in the Examples tab with the corresponding SQL.
-
If a user’s query is an exact match, the system executes the SQL; otherwise, it maps to SwiftQuery.
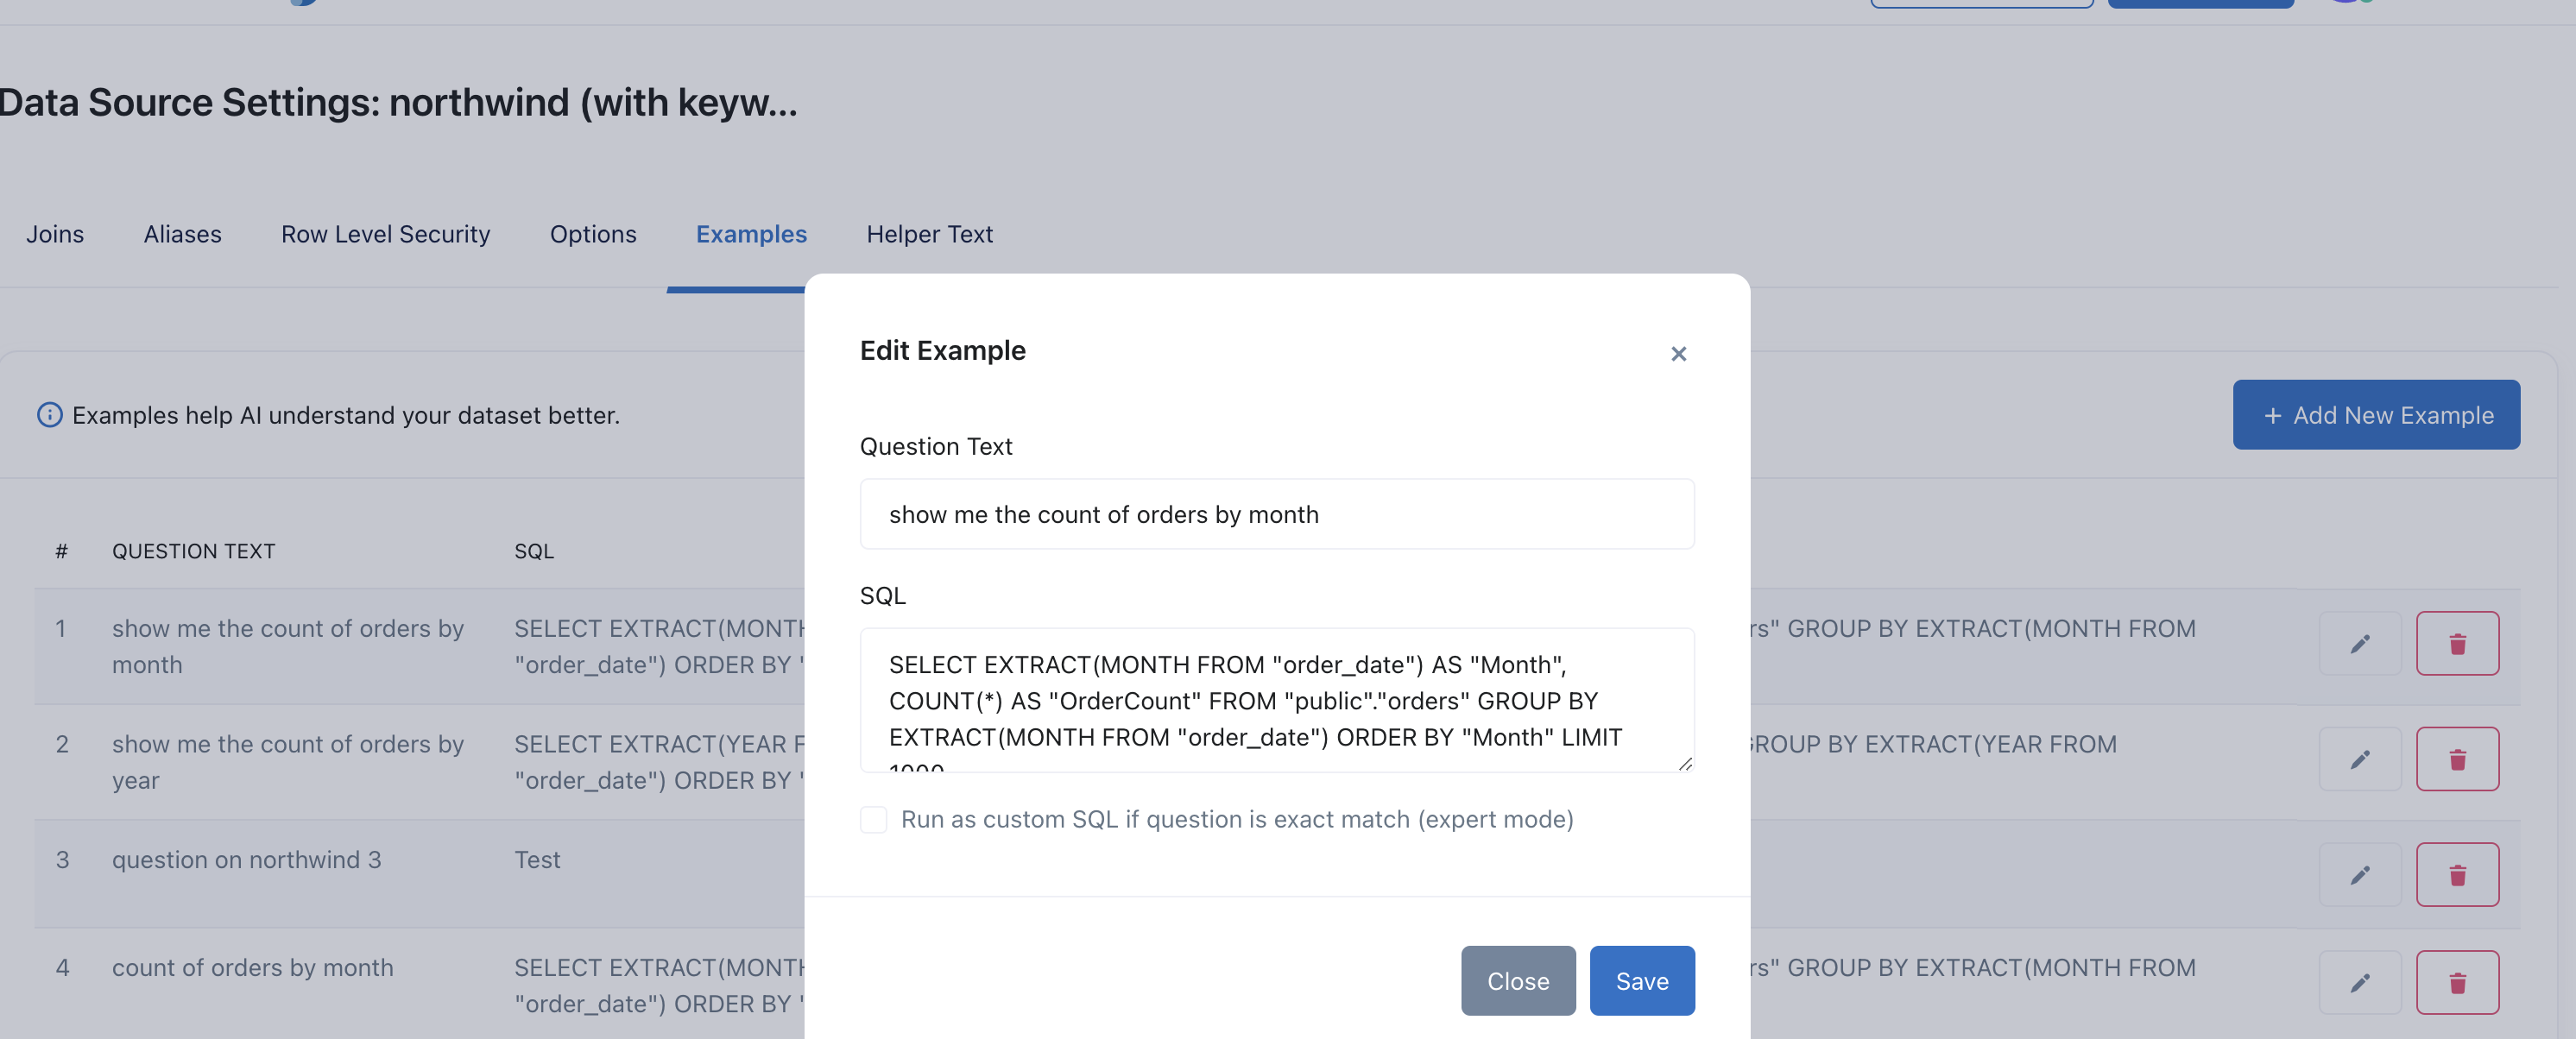
In Addition: Helper Text
You can also create ghost text to guide a user. Ghost text provides a prompt within the input field, offering suggestions on what users might want to ask. This helps users frame their questions more effectively, ensuring they get the most relevant responses.
How It Works
- Click on ‘Data Sources’
- Click on ‘Settings’ of your chosen data source
- Use the Aliases, Examples, or Helper Text functions
20.3 - Connnecting to Google Cloud SQL
Zing Data can connect to any Google Cloud SQL database, but there are a few simple steps to enable access for the Zing Data platform.
Steps
-
Go to your GCP console here
-
Select
SQLfrom the sidebar shown here
-
Select
Connectionsfrom the sidebar for the mySQL, postgres or SQL Server Cloud SQL instance you want to connect to Zing Data.
-
Now hit the
Networkingtab to be able to manage the ip allow lists for your instance.
-
Here you can add Zing Data’s IP as an allow list =
34.75.82.6

-
After you’ve saved this configuration, you can now add your CloudSQL instance as a datasource in the Zing Console (instructions here)
-
That’s it. You’ve now successfully configured a Google CloudSQL instance with Zing Data. Happy Querying!
21 - Account Management & Billing
You are in full control of who you invite to your Zing Data instance, which data sources you configure, and if you’d like to delete your account.
Upgrading your billing plan
- From the Zing console, click the organizations tab.
- Click the ‘Upgrade’ button next to the organization you want to upgrade
Note: If you plan to share an organization with others, we strongly suggest creating a new organization (different from the default one created when you sign up) named after the company / organization you intend to share with other users.
- Select a plan tier and enter your payment information
- Confirm
- Your account will be immediately upgraded. If you are upgrading to a plan partway through the subscription period, the prorated difference in amount will be charged for the remainder of the billing period.
Note: If you have the Zing App open in another tab, you may need to refresh that tab in order to unlock the additional functionality from your paid plan.
Downgrading or cancelling your billing plan
- From the Zing console, click the organizations tab.
- Click the ‘Settings’ button next to the organization you want to downgrade

- Click ‘Manage Subscription’

Deleting your Zing Account
You can delete your app via the web console or the Zing App.
To delete your account via the Zing Web Console:
1. Login to console.getzingdata.com
2. Click on your profile image in the top right, then click ‘profile’
3. Scroll down to the ‘delete your account’ section and click ‘Delete’
To delete your account via the Zing App:
Note: If you are an administrator on a paid plan, make sure to transfer your organization ownership to another team member, or cancel your organization’s subscription before deleting your account to avoid ongoing charges.
- From the Zing app, click Settings

- Click Account Settings

-
Click Delete Account
This will remove:
- Your acccount
- All data sources associated with your account
- Any saved questions
- Any saved dashboards
- Any saved alerts
Note: Account deletion is not reversible

- You’ll be prompted to type ‘delete permanently’
- Your account is immediately deleted and you will be logged out
Note: If you are the administrator of an organization account having other people within it, you will be prompted to choose who will be the new administrator of the account. This is to ensure that a single employee leaving a company and de-activating their account does not inadvertently delete the whole organization or leave it without an administrator.
Zing’s iOS app package name is com.getzingdata.ios
Zing’s Android package name is com.getzingdata.android
Our developer name on both the Apple App Store and Android Play Store is Zing Data, Inc.
21.1 - Personalization
Get started
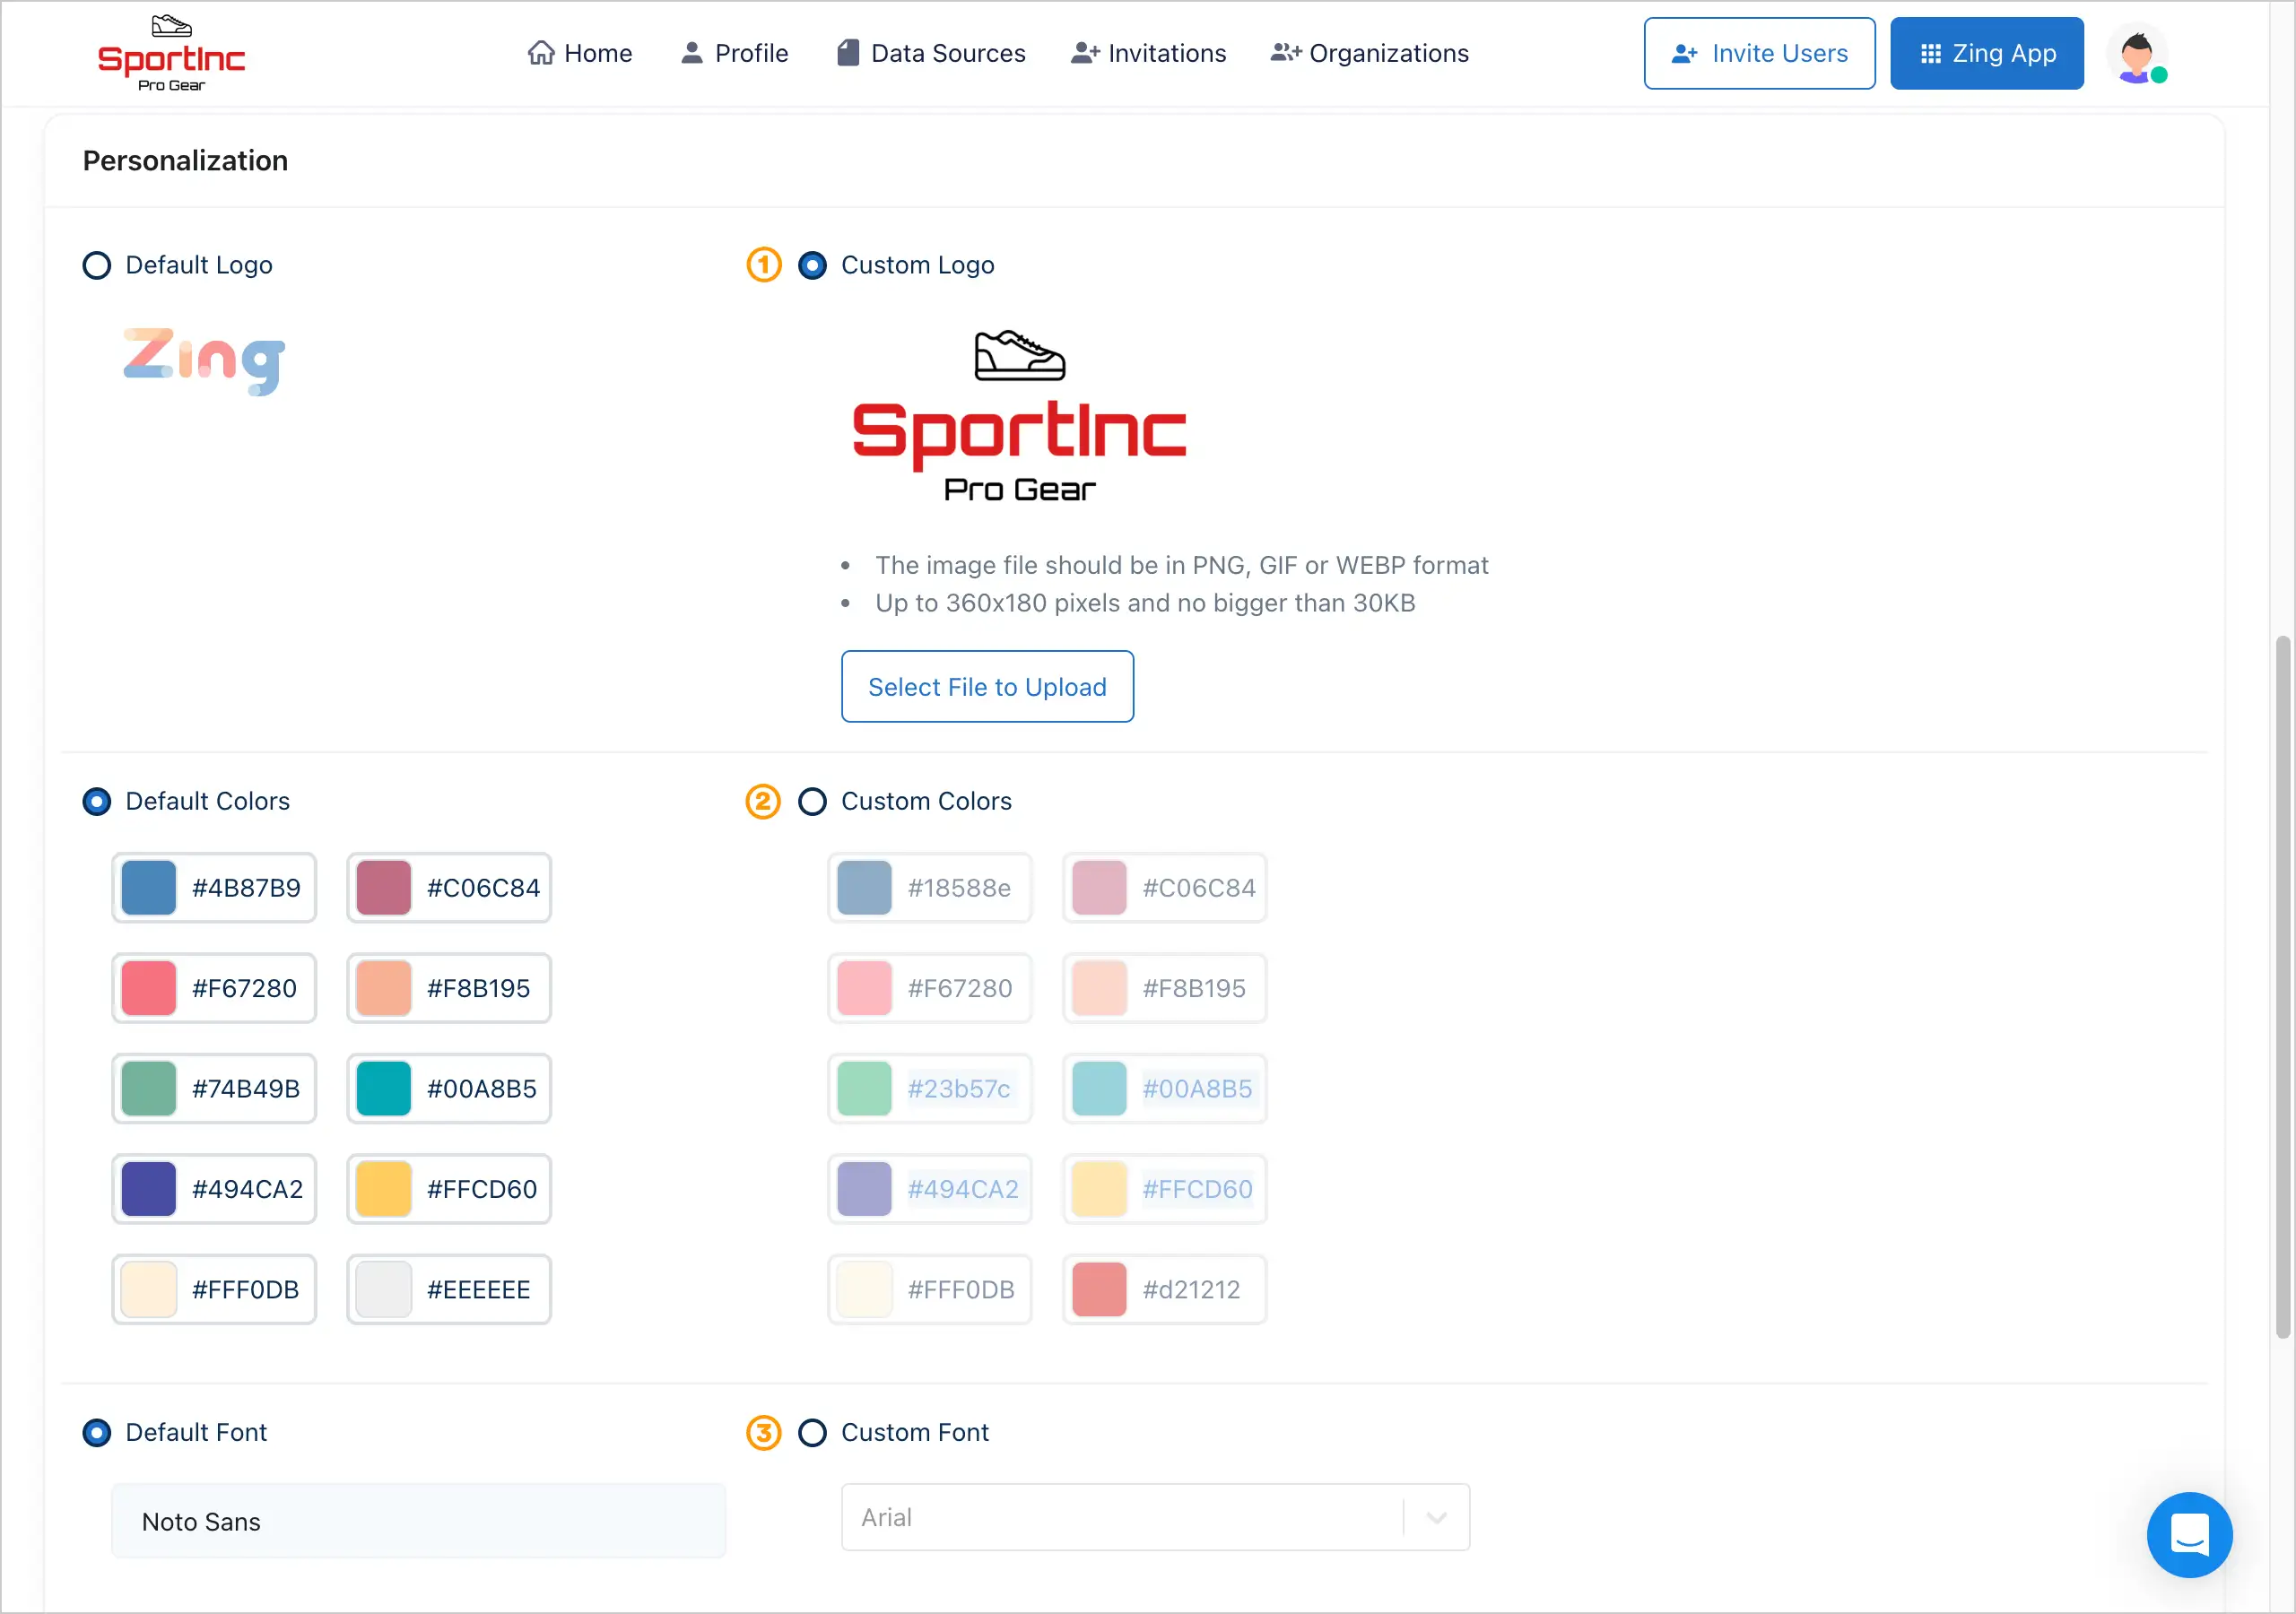
Go to Zing Console and click on “Organizations” followed by “Settings”. Now scroll down a bit to reach the personalization section where you can:
- Upload your own logo
- Customize colors (ideally use your brand colors) which determine the color used for series 1, series 2, series 3,… colors within your graphs
- Select a different font (serif, sans serif)

Now Zing is displaying your logo and color palette throughout the Zing platform. Your custom color palette is now applied to Series One, Two, Three, and subsequent series in your charts.
This feature is available if your organization is on the Zing Pro plan and Zing Enterprise plan. Learn more about pricing.